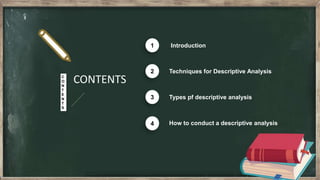
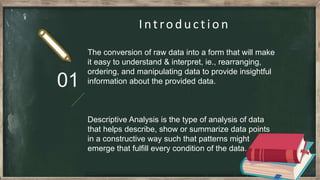
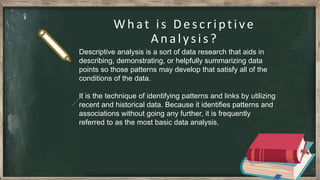
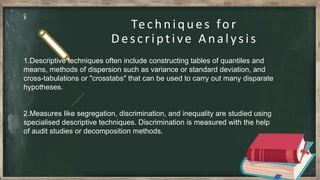
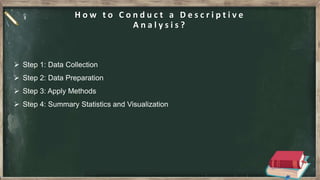
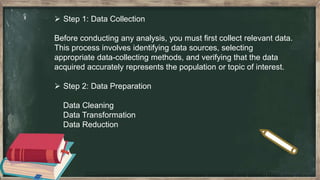
3. 01 .
Intro ductio n
The conversion of raw data into a form that will make
it easy to understand & interpret, ie., rearranging,
ordering, and manipulating data to provide insightful
information about the provided data.
Descriptive Analysis is the type of analysis of data
that helps describe, show or summarize data points
in a constructive way such that patterns might
emerge that fulfill every condition of the data.
4. .
What is Descriptive
Ana lysis?
Descriptive analysis is a sort of data research that aids in
describing, demonstrating, or helpfully summarizing data
points so those patterns may develop that satisfy all of the
conditions of the data.
It is the technique of identifying patterns and links by utilizing
recent and historical data. Because it identifies patterns and
associations without going any further, it is frequently
referred to as the most basic data analysis.
5. .
Techniques fo r
Descriptive Ana lysis
1.Descriptive techniques often include constructing tables of quantiles and
means, methods of dispersion such as variance or standard deviation, and
cross-tabulations or "crosstabs" that can be used to carry out many disparate
hypotheses.
2.Measures like segregation, discrimination, and inequality are studied using
specialised descriptive techniques. Discrimination is measured with the help
of audit studies or decomposition methods.
6. .
3. A table of means by subgroup is used to show
important differences across subgroups, which mostly
results in inference and conclusions being made.
4. A crosstab or two-way tabulation is supposed to show
the proportions of components with unique values for
each of two variables available, or cell proportions.
12. H o w t o C o n d u c t a D e s c r i p t i v e
A n a l y s i s ?
13. Step 1: Data Collection
Before conducting any analysis, you must first collect relevant data.
This process involves identifying data sources, selecting
appropriate data-collecting methods, and verifying that the data
acquired accurately represents the population or topic of interest.
Step 2: Data Preparation
Data Cleaning
Data Transformation
Data Reduction
14. Step 3: Apply Methods
Frequency Distribution Analysis
Measures of Central Tendency
Measures of Dispersion
Measures of Position
Step 4: Summary Statistics and Visualization
Summary Statistics
Data Visualization