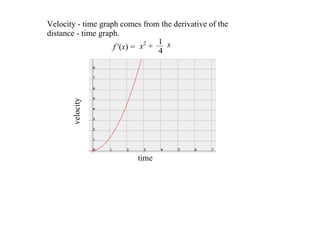
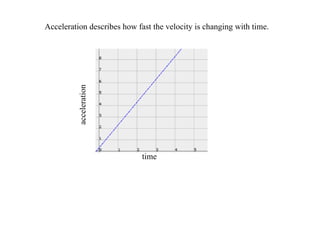
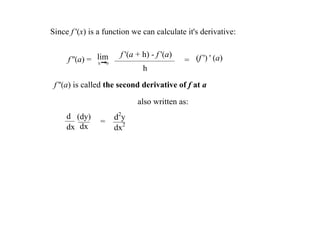
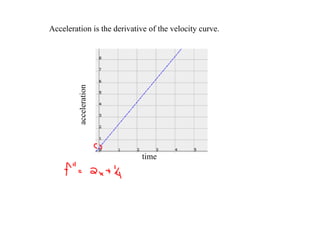
1. The document discusses distance-time and velocity-time graphs and their relationships. It defines acceleration as the derivative of velocity over time.
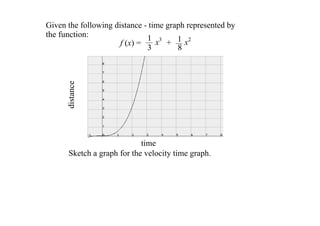
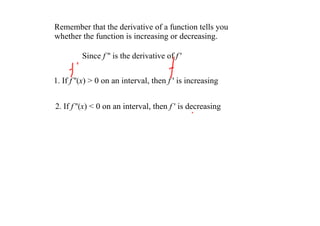
2. It provides an example distance-time function and asks to sketch the corresponding velocity-time graph. It also discusses how to determine if a function is increasing or decreasing based on the signs of its derivative.
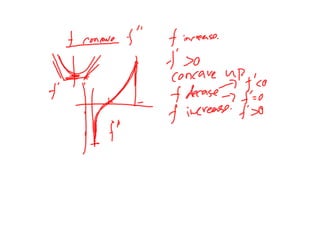
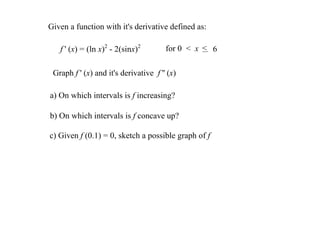
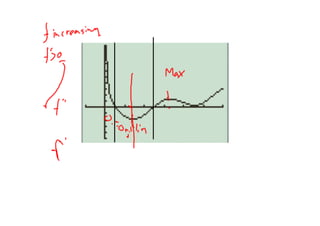
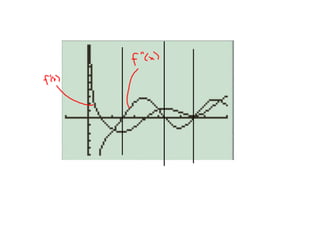
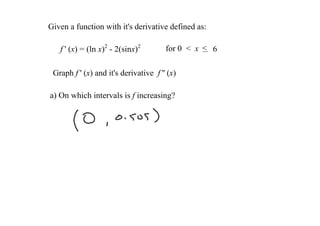
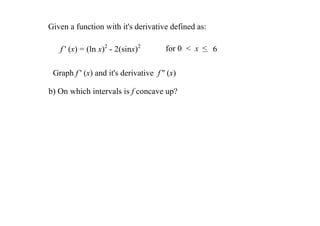
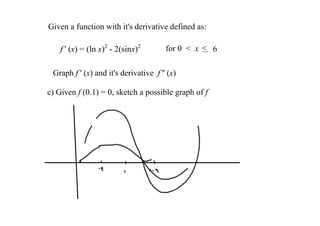
3. The document ends by giving a velocity function and asking to graph its derivative and determine where the original function is increasing, where it is concave up, and to sketch a possible graph based on an initial value.