Download as PDF, PPTX


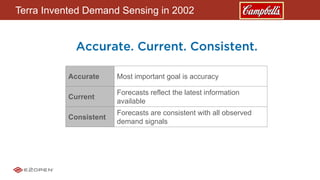
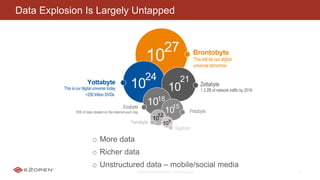
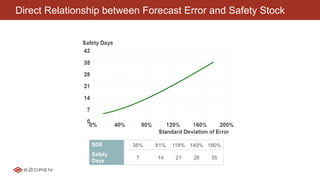
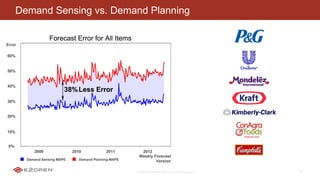
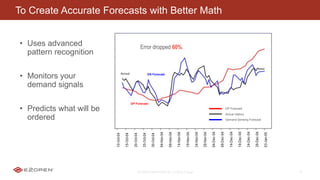
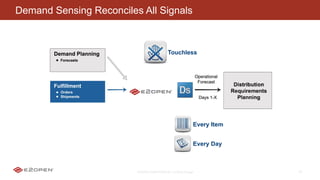
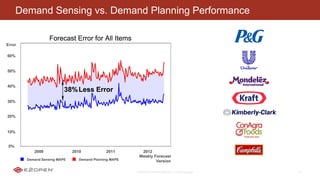
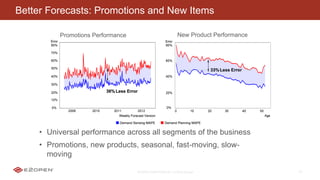
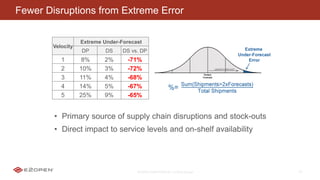
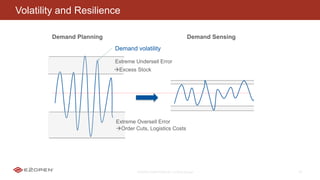
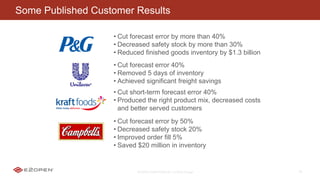

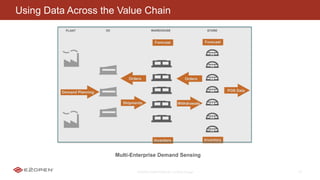
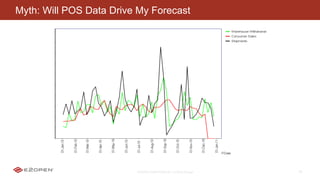
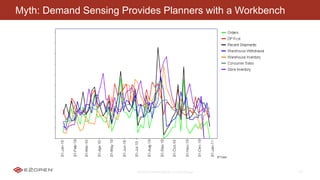
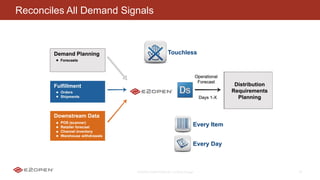
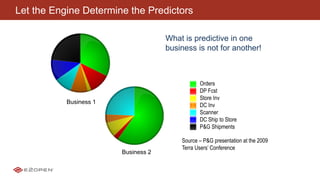
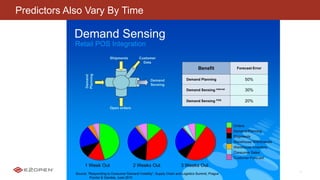

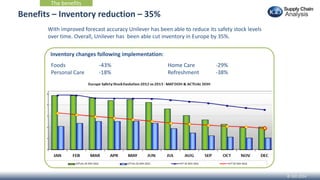
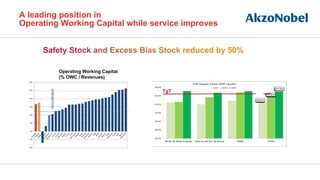


Demand sensing is a technique that uses advanced pattern recognition and machine learning algorithms to monitor demand signals and predict customer orders. It provides more accurate forecasts than traditional demand planning by reconciling all demand data from different sources. Demand sensing cuts forecast error by over 40% on average and reduces safety stock levels and inventory, while improving order fill rates and service levels. It debunks myths that it is a "black box" or will disrupt planning processes. Customers report benefits like reducing inventory by 35% while improving service.


