Download to read offline


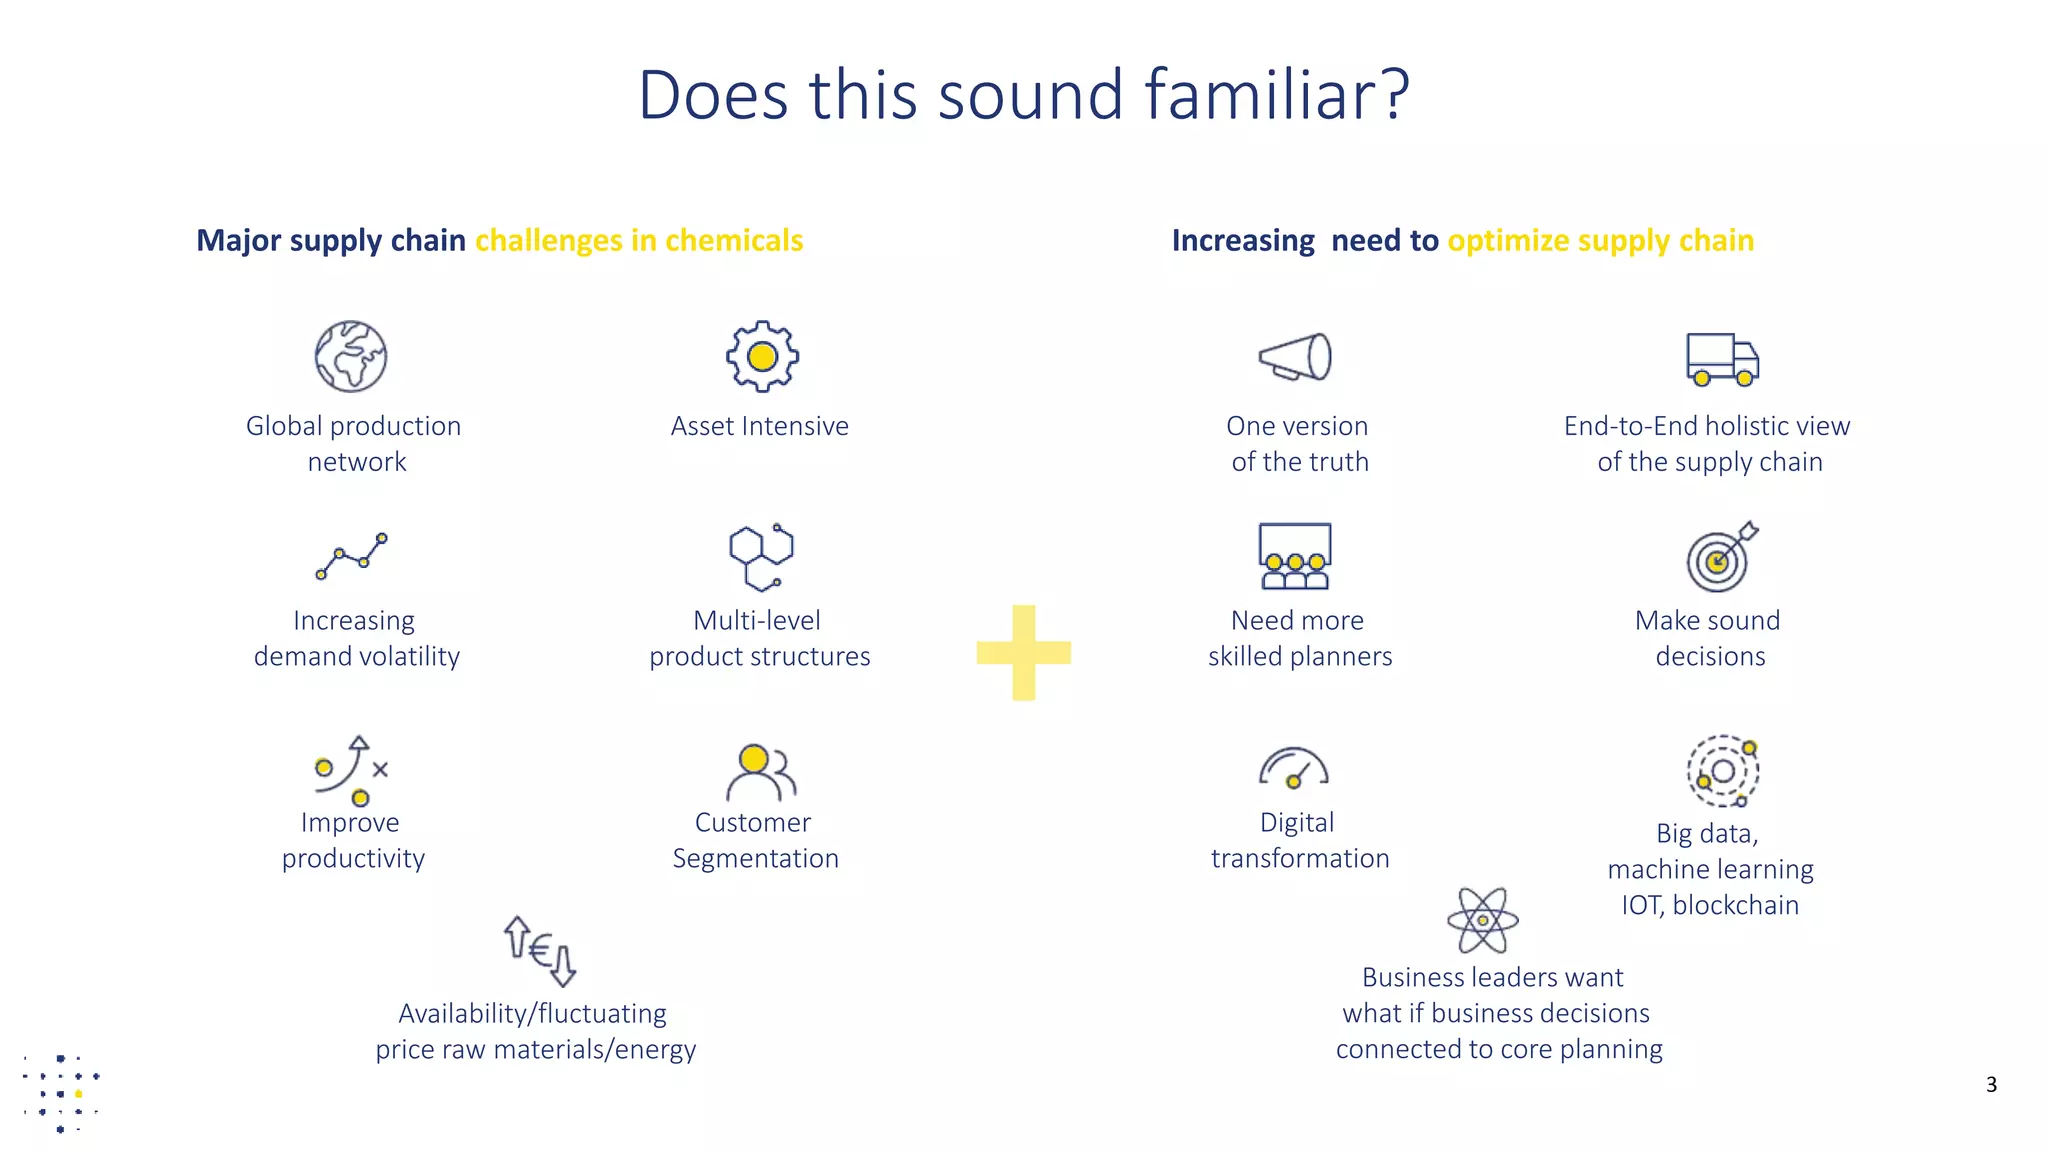
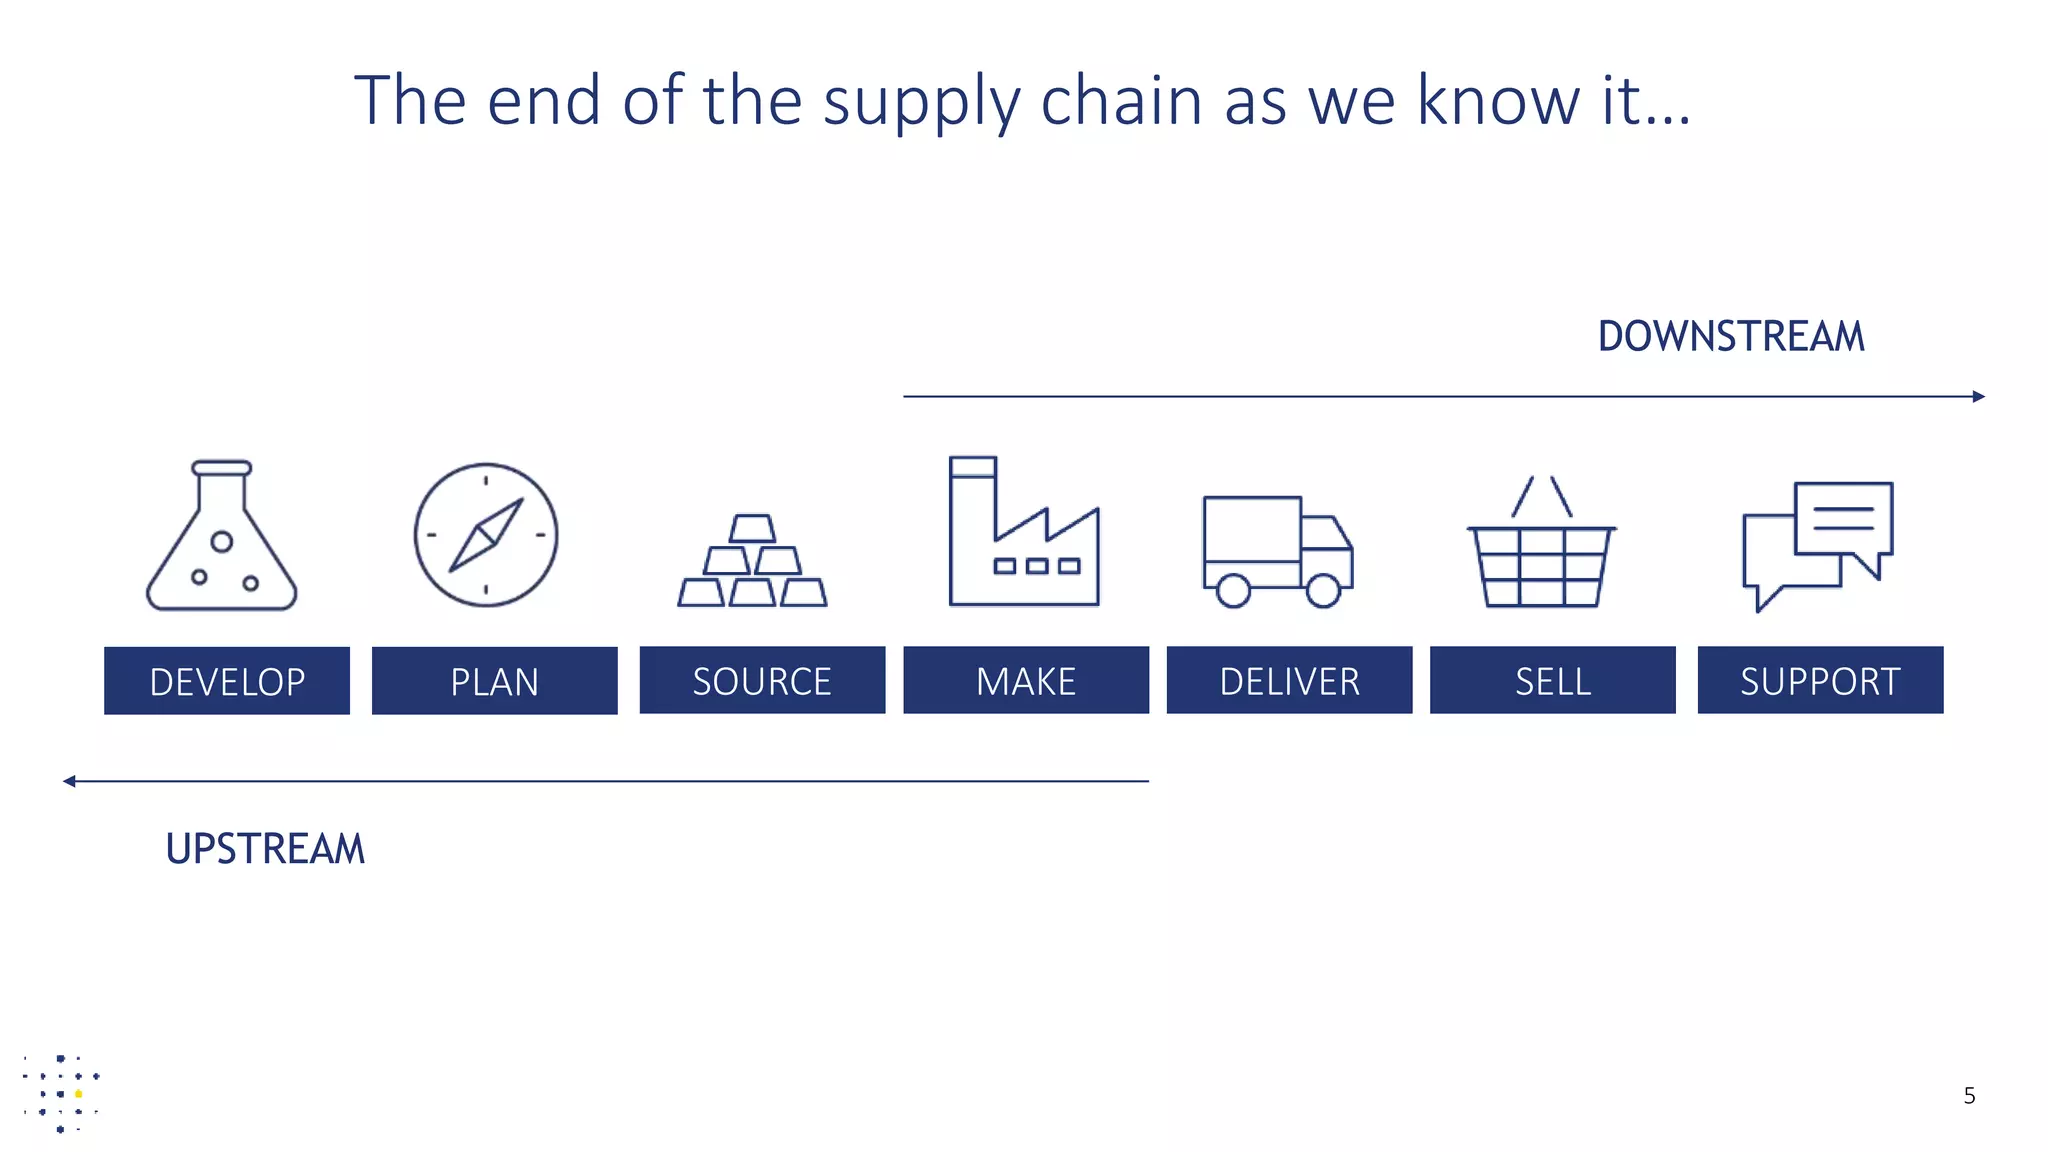
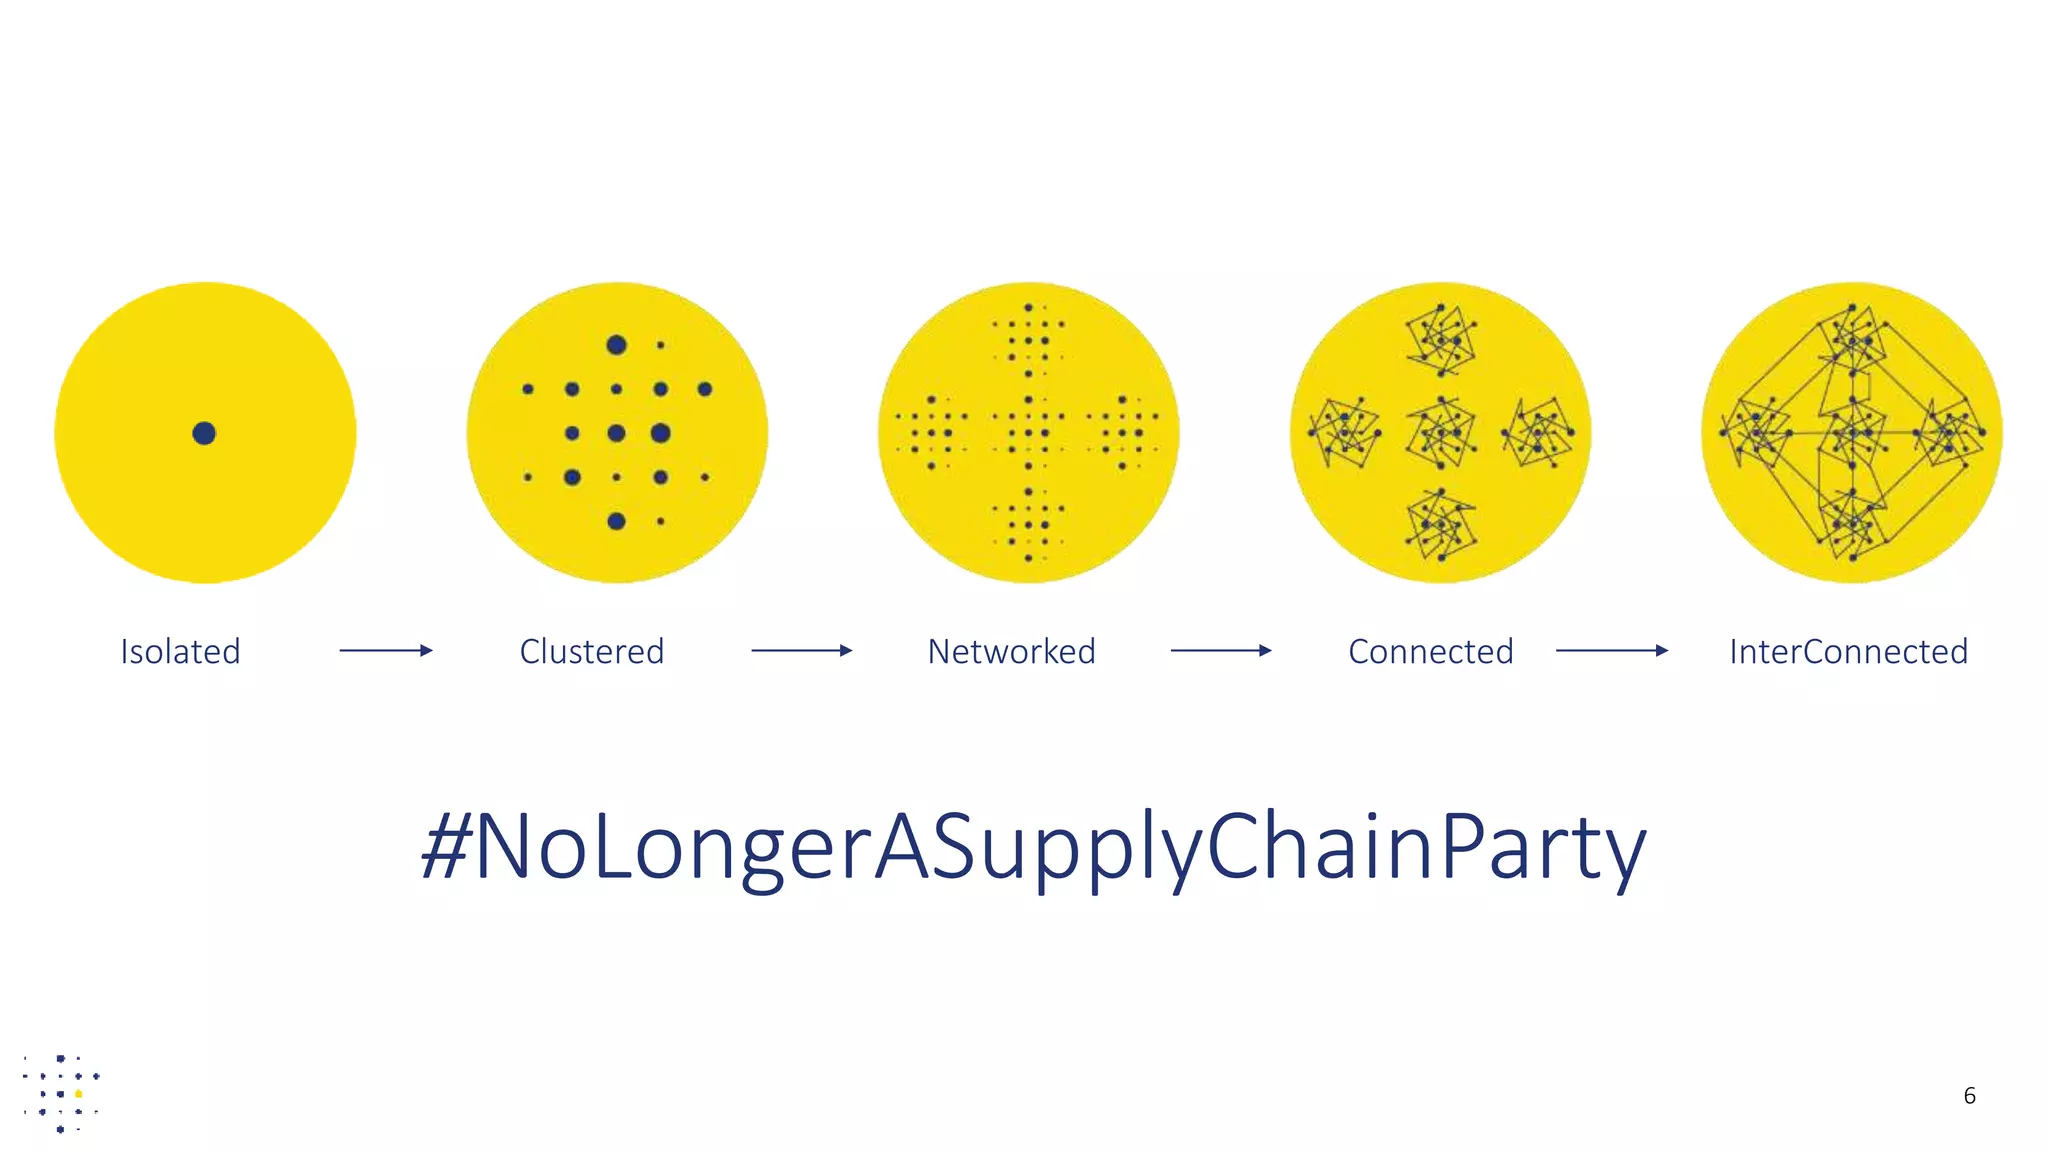
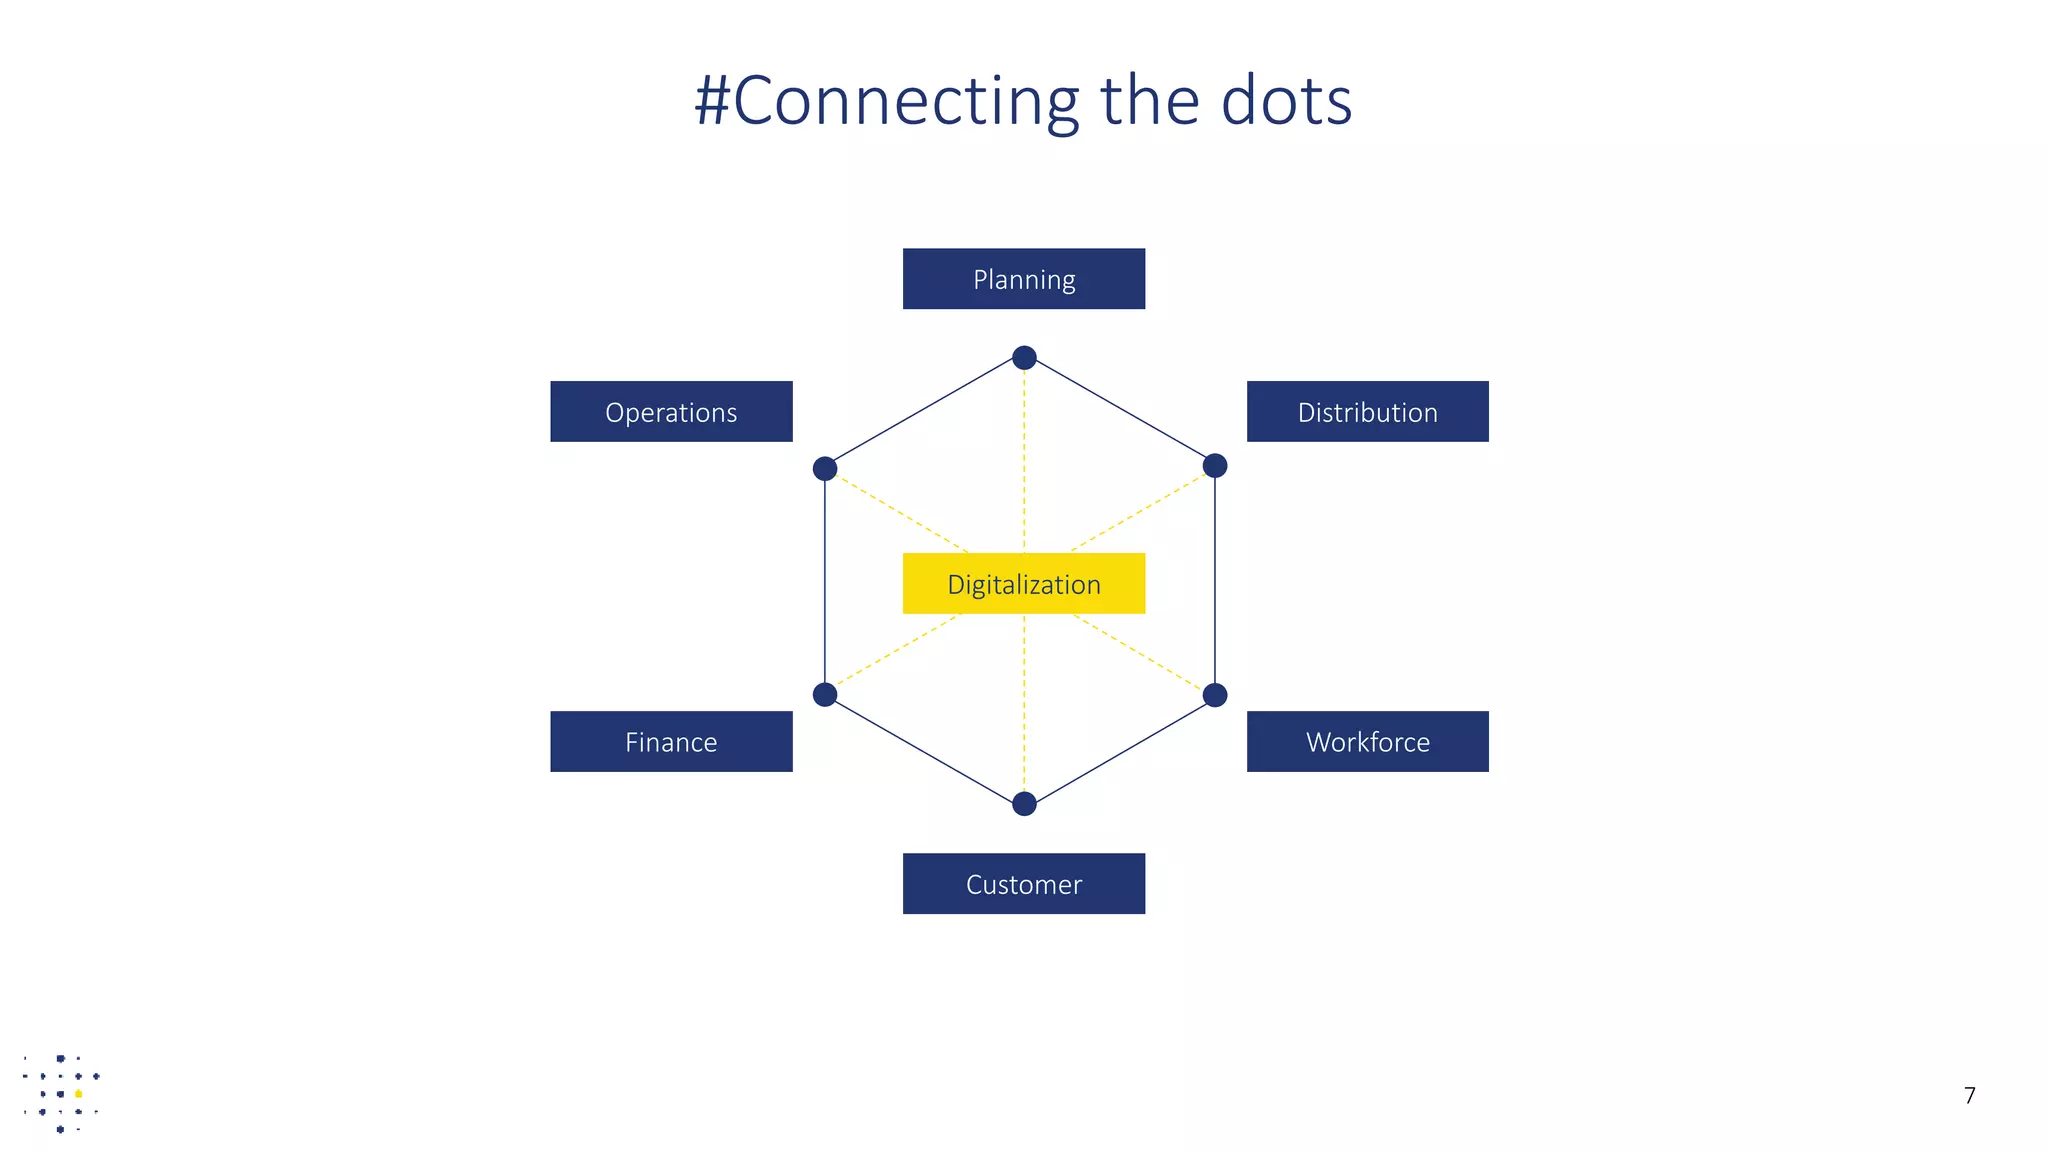
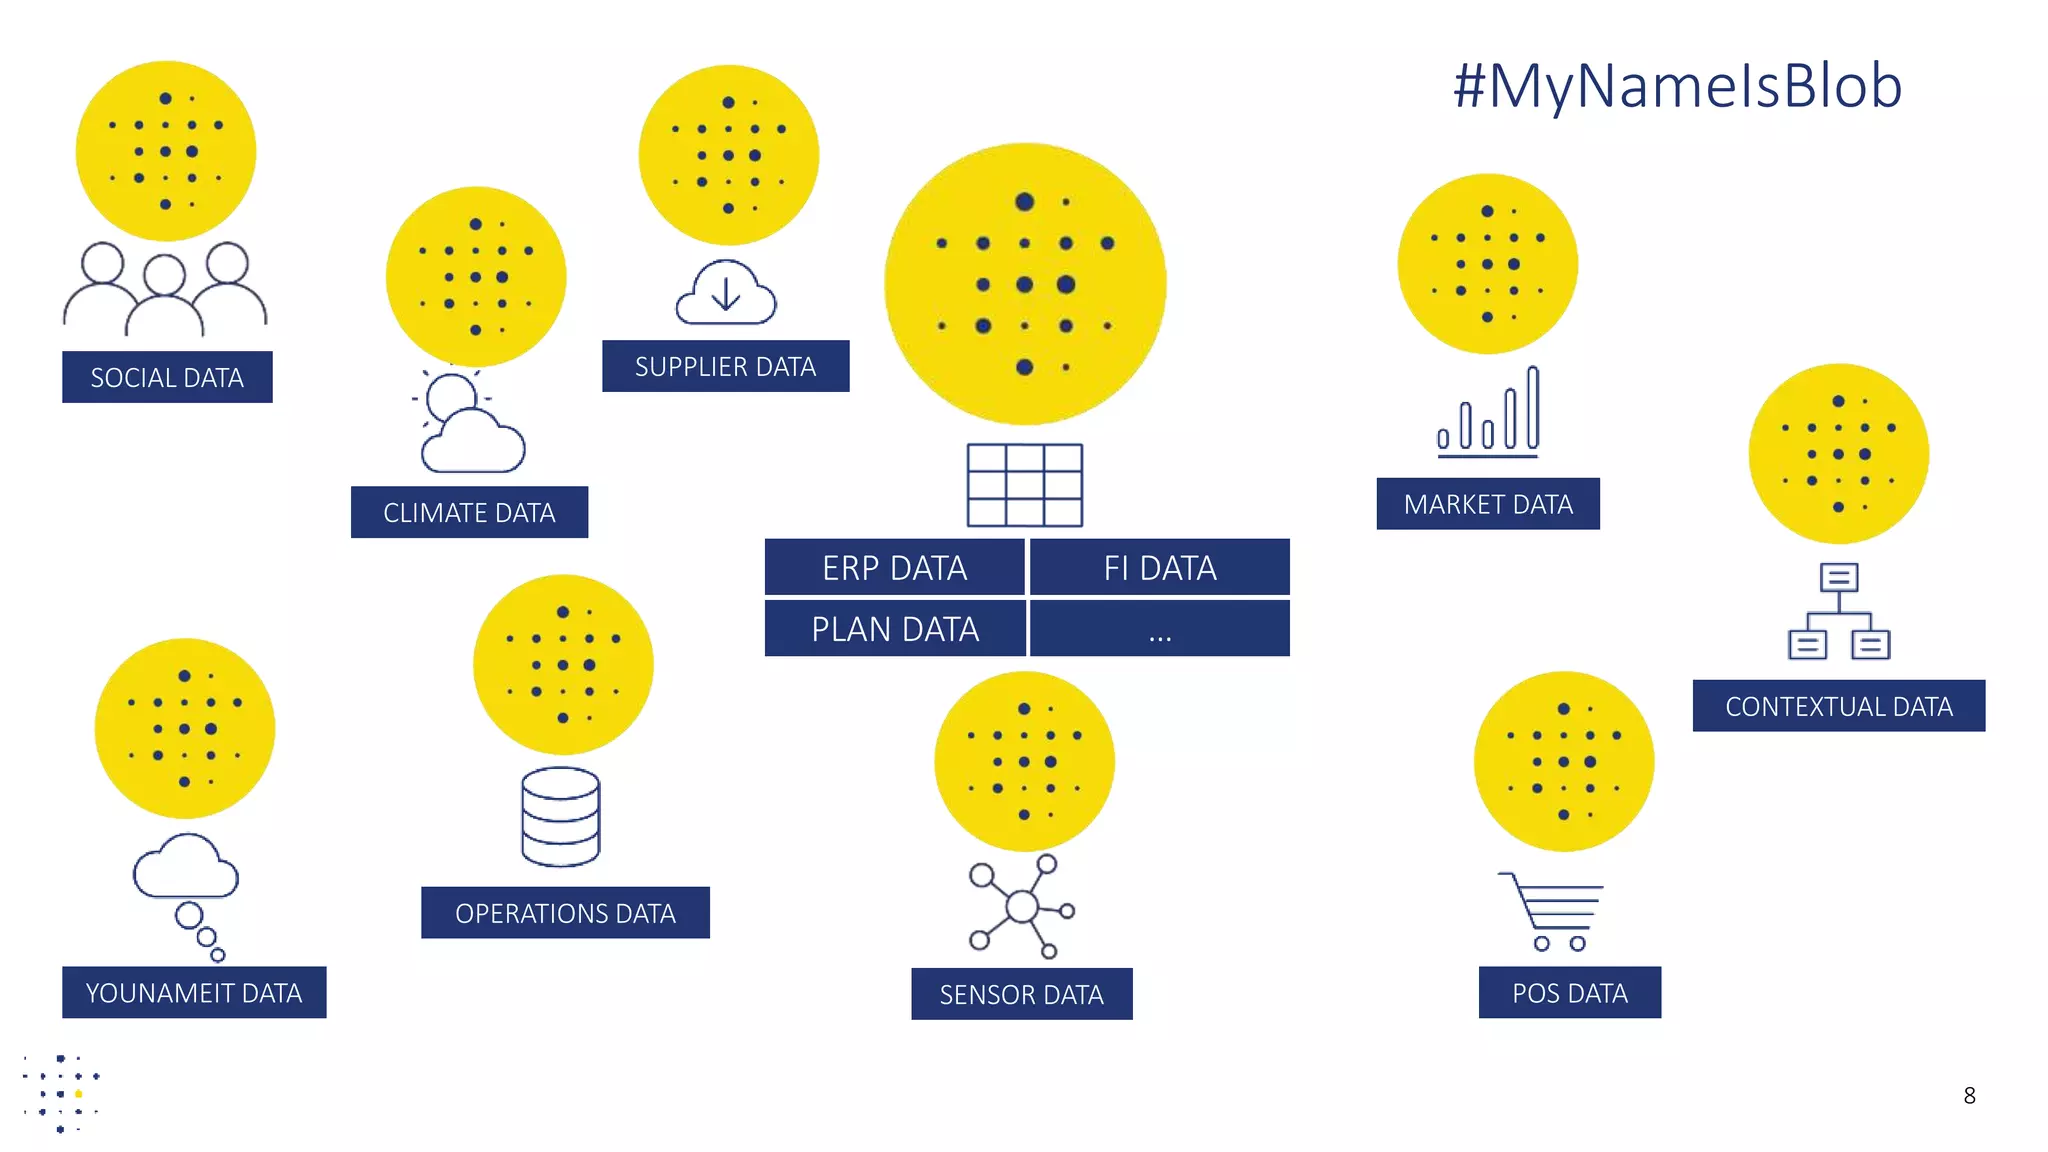

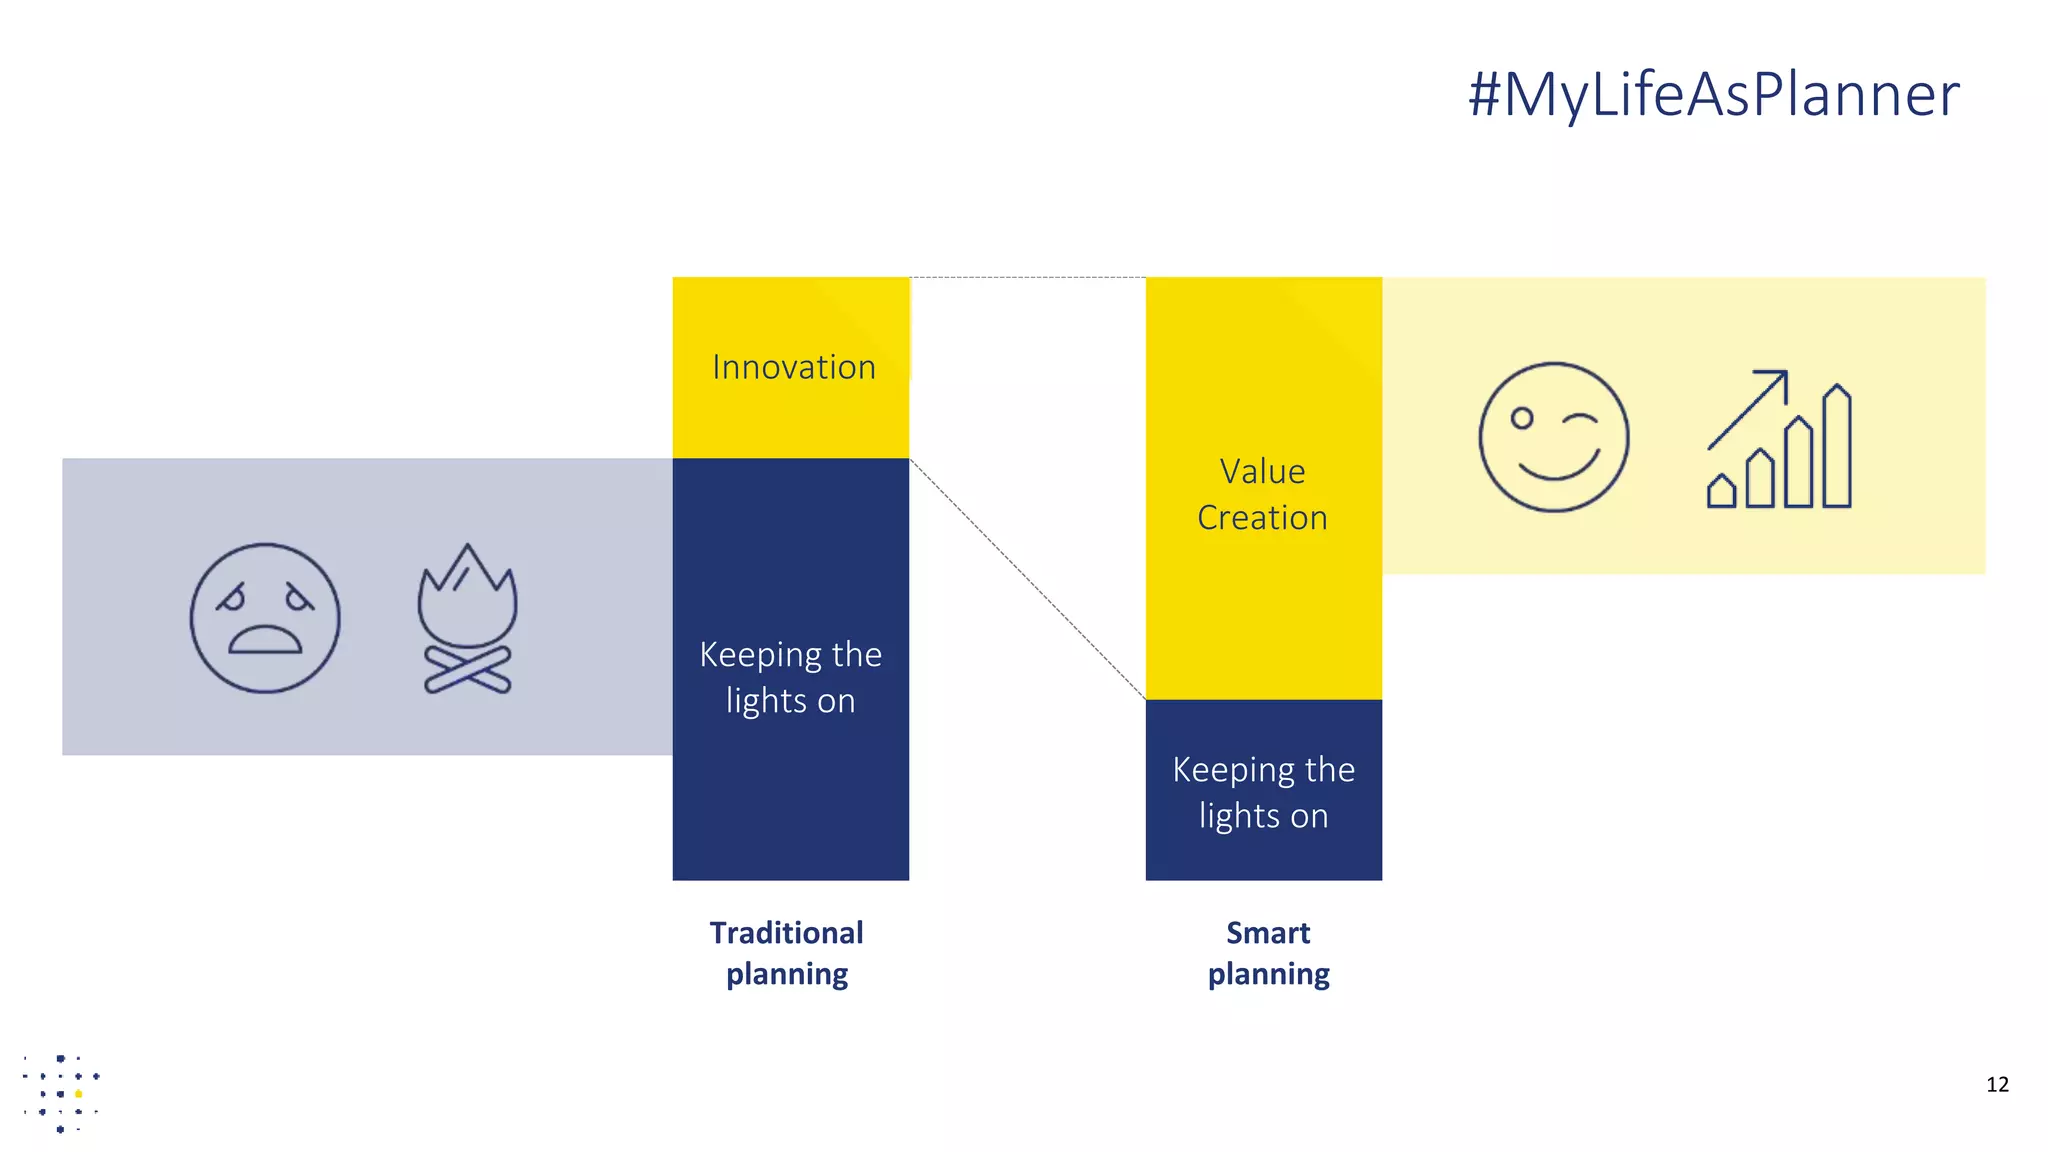


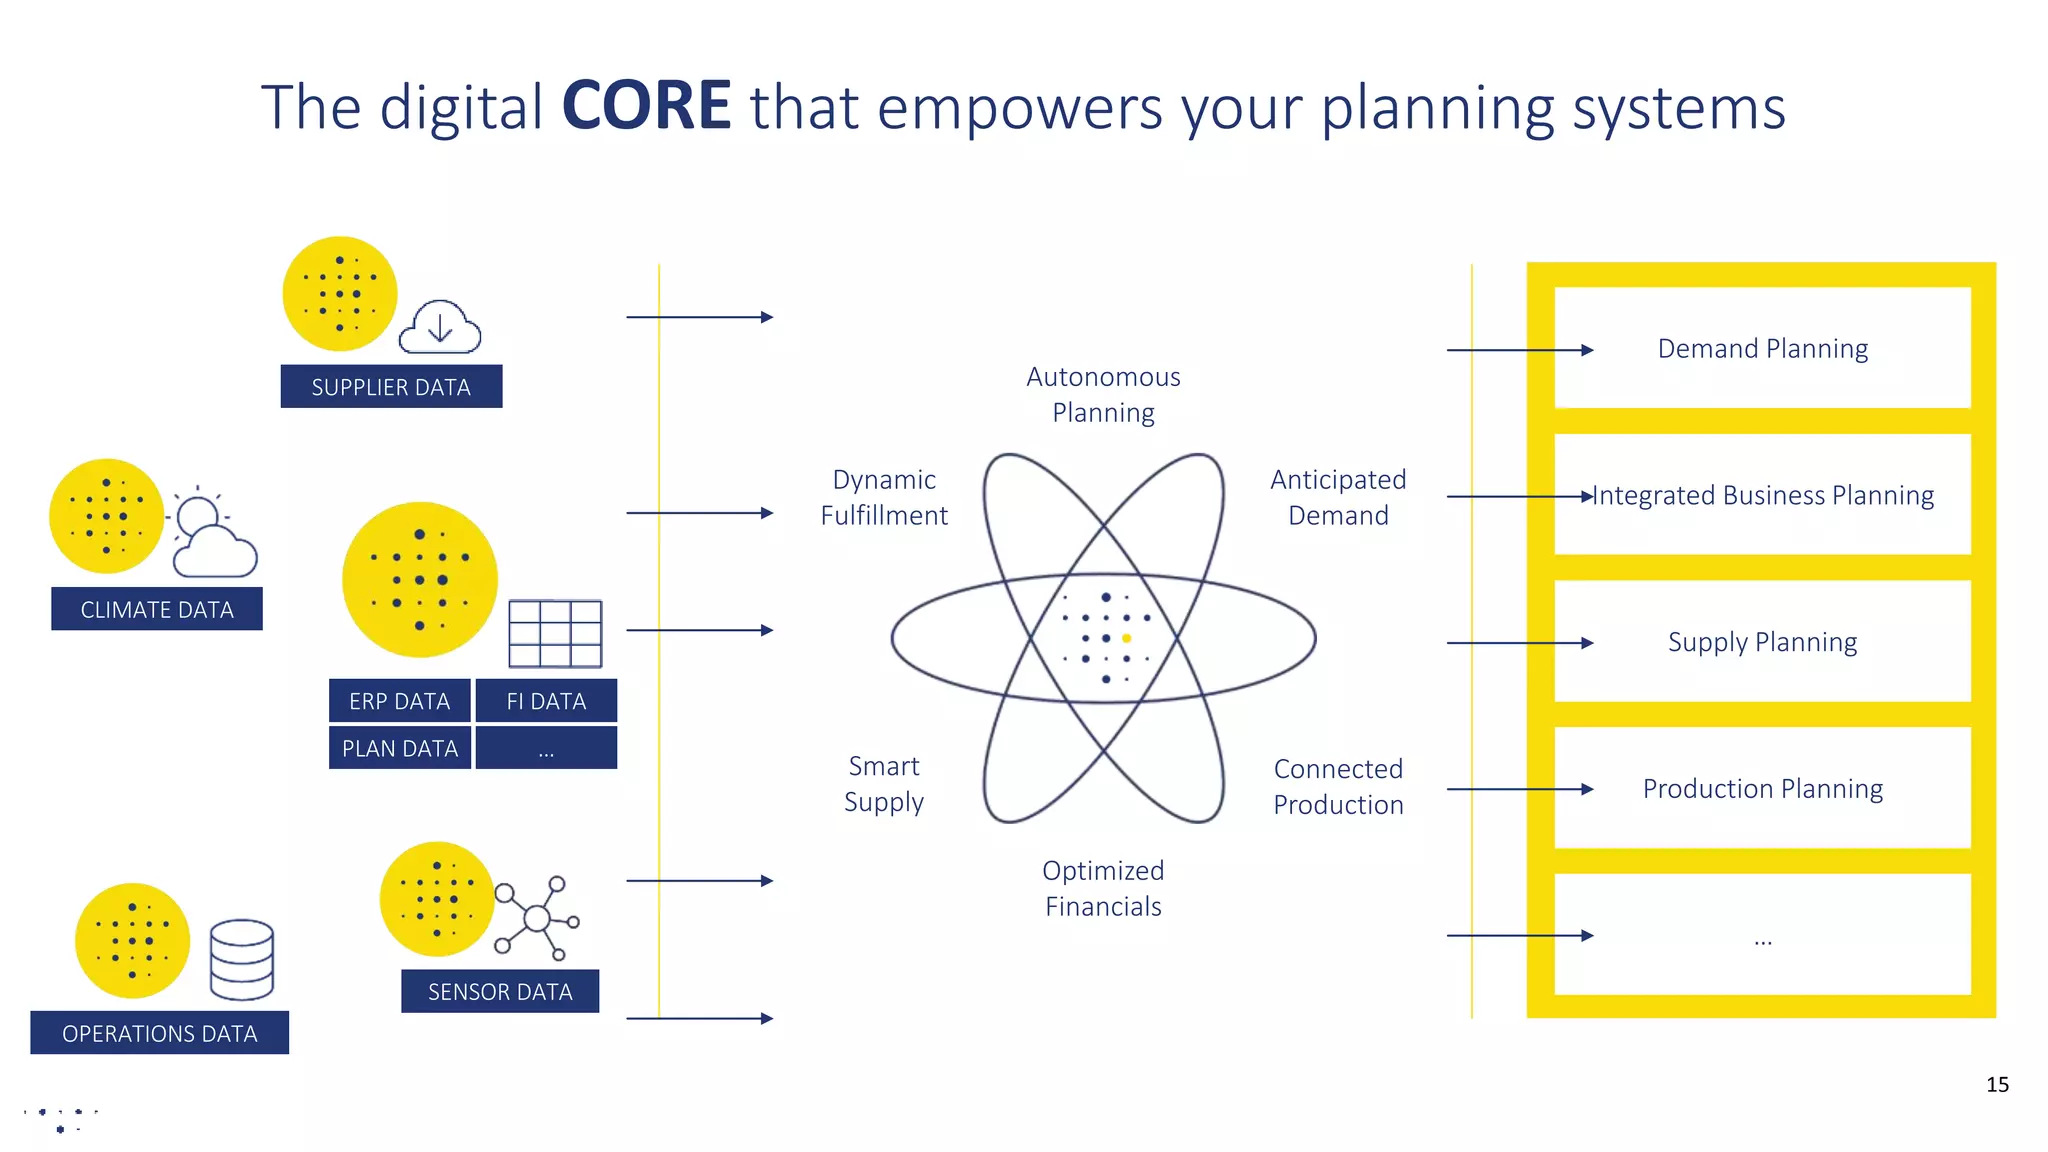
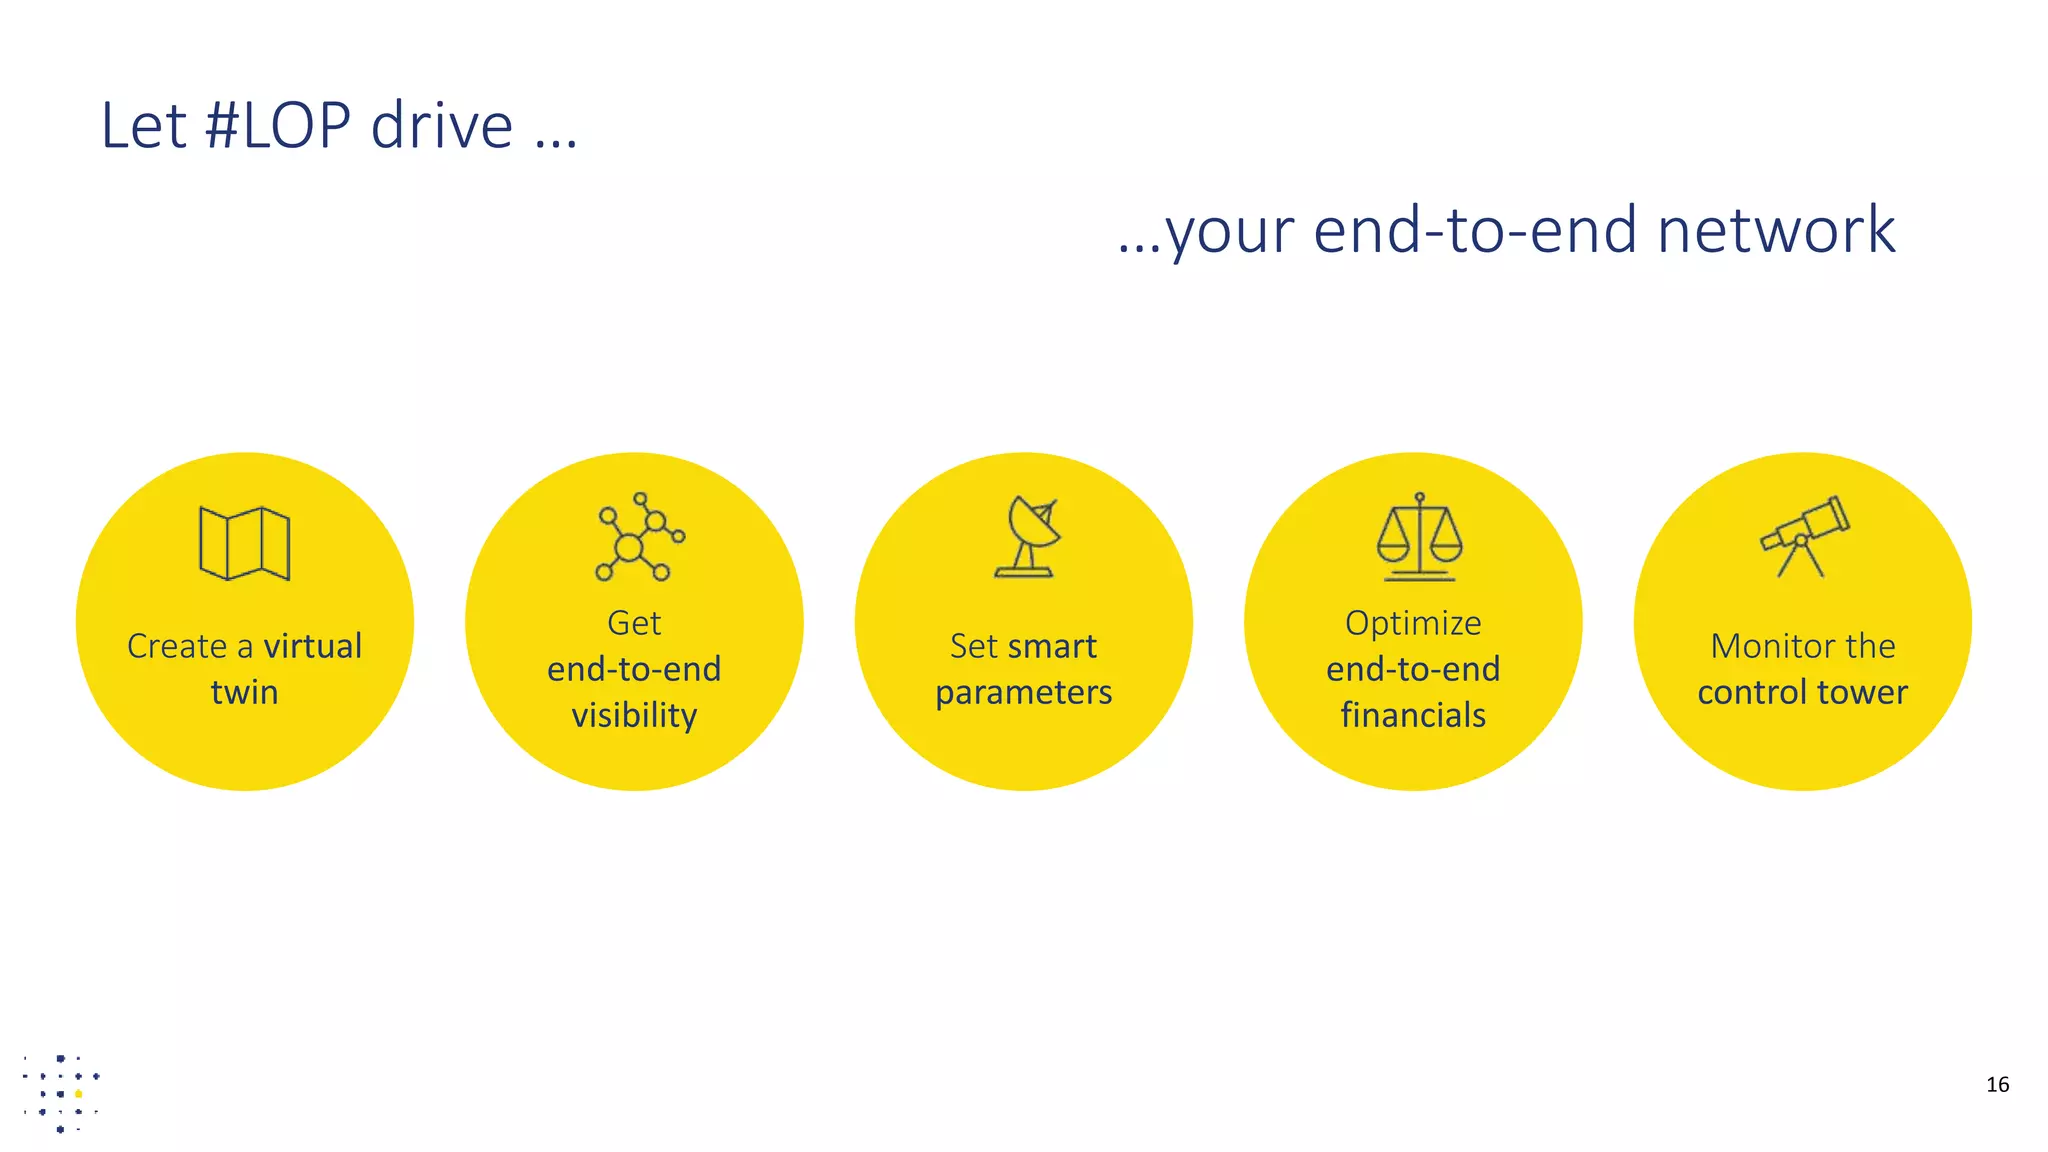

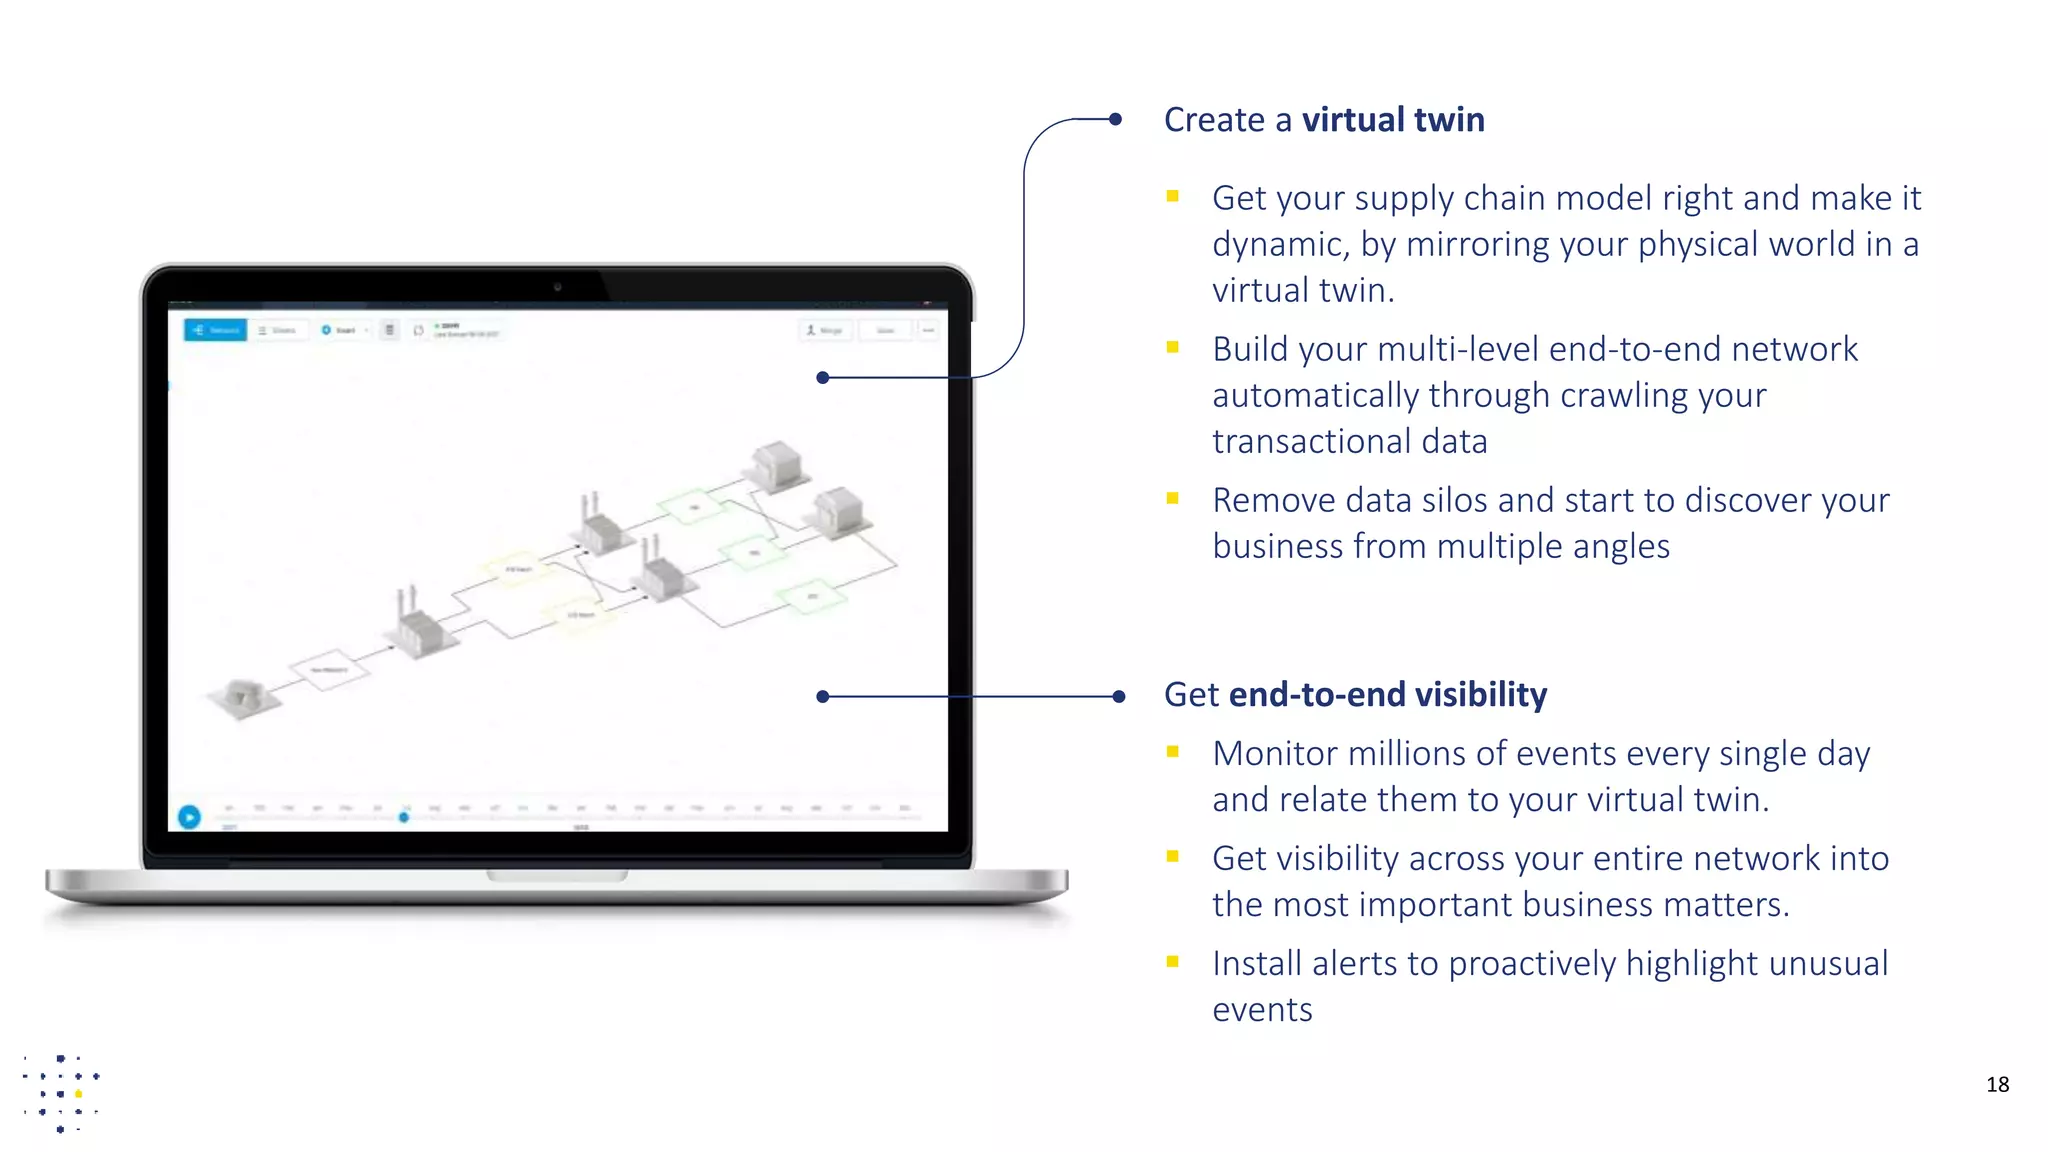


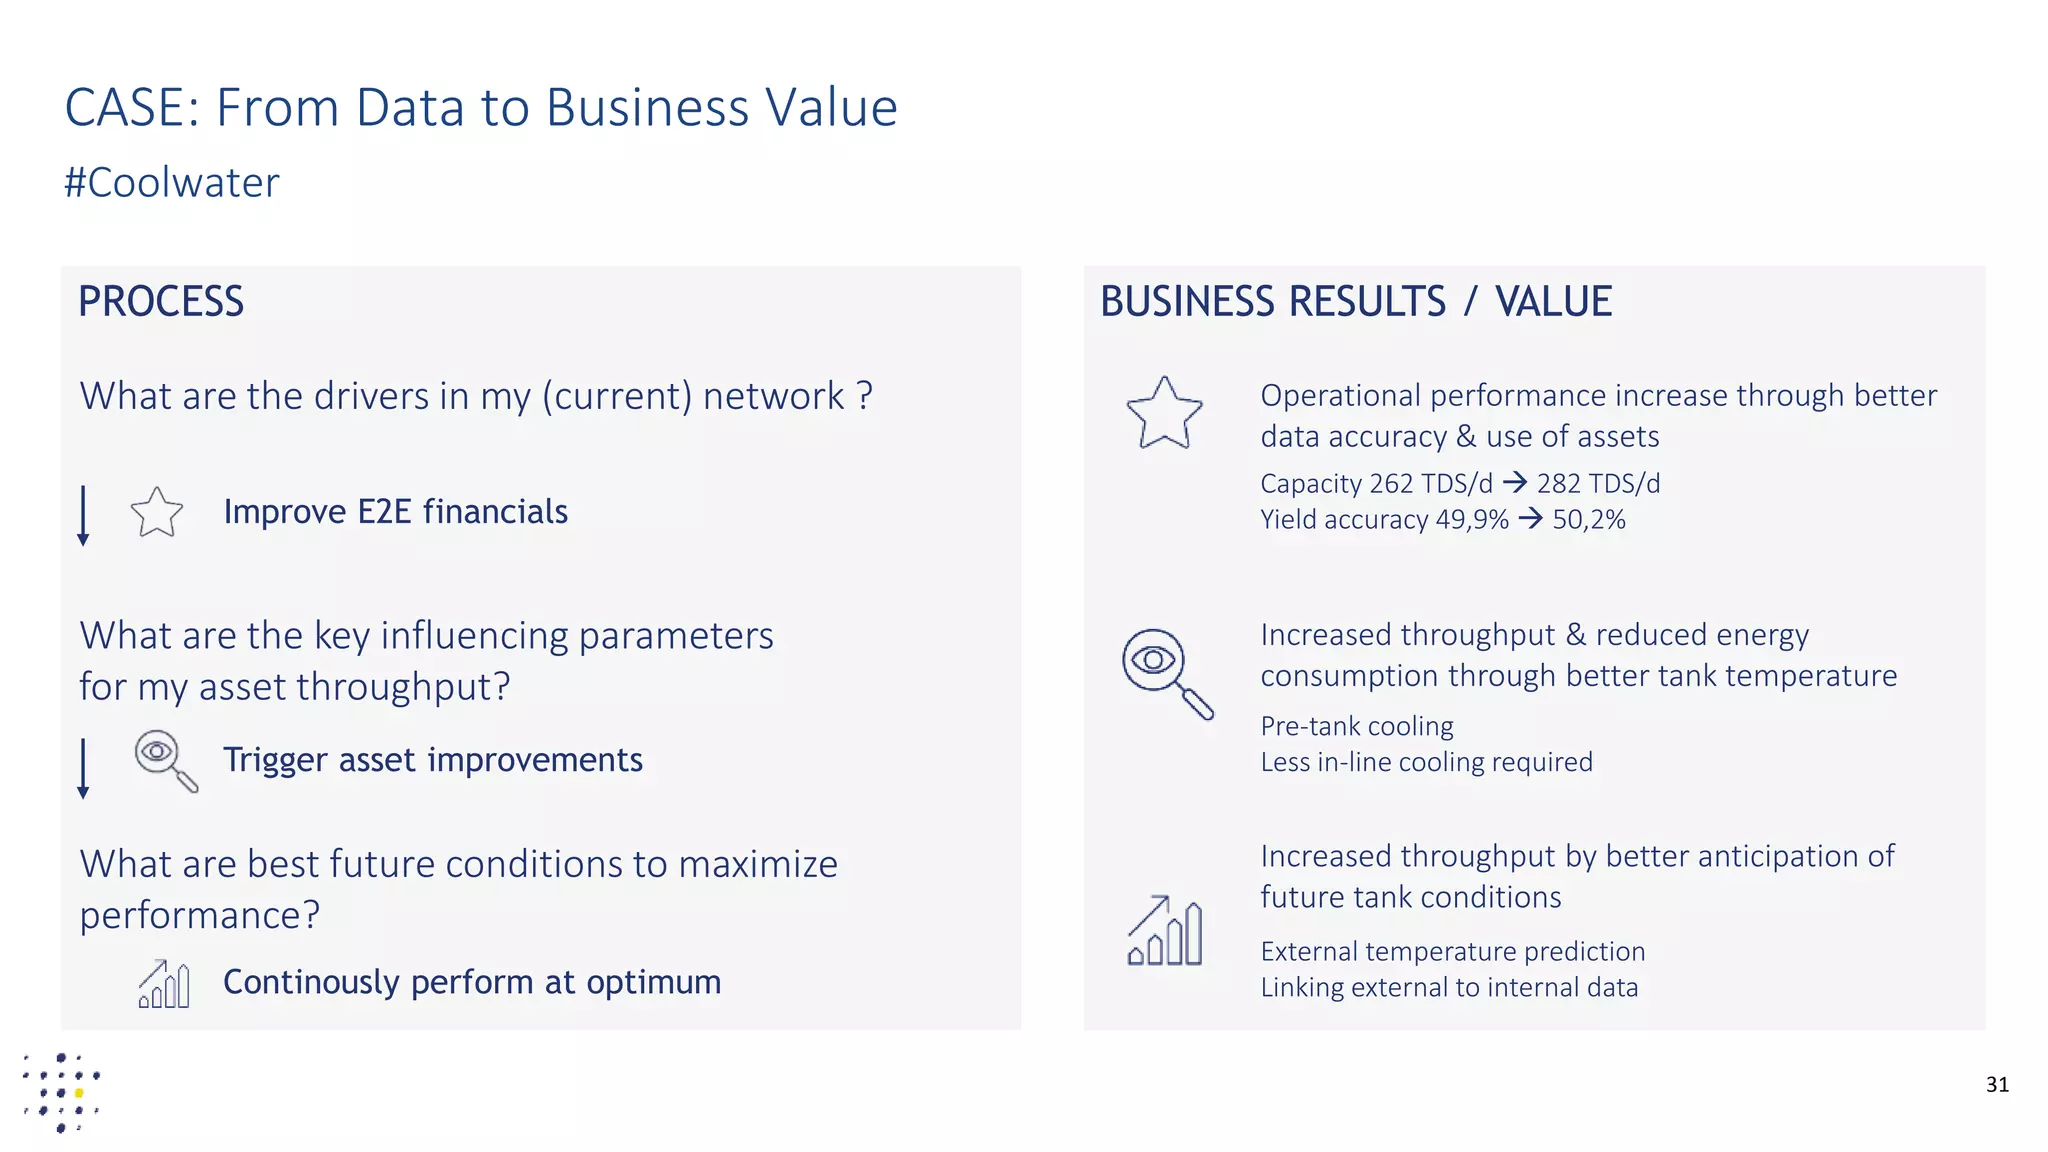


The document discusses the challenges and opportunities in optimizing supply chains, particularly in the chemical industry, through digital transformation and smart planning. It emphasizes the importance of integrating various data sources and creating a virtual twin for end-to-end visibility and decision-making. Finally, it presents use cases demonstrating how data connectivity can enhance operational performance and profitability.


![Vibe Coding vs. Spec-Driven Development [Free Meetup]](https://cdn.slidesharecdn.com/ss_thumbnails/vibecodingvsspecdrivendevelopment-251209105622-43f455e7-thumbnail.jpg?width=640&height=640&fit=bounds)


