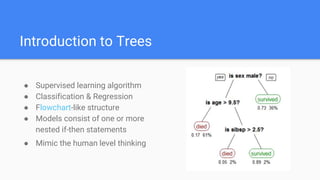
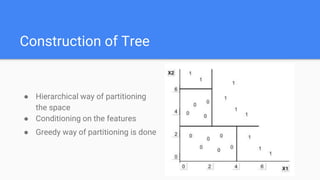
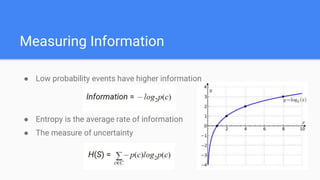
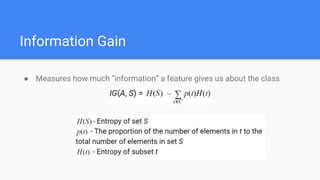
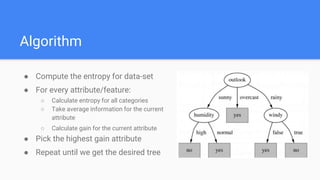
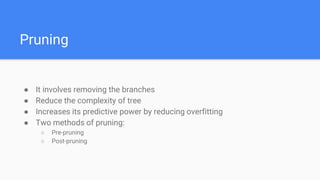
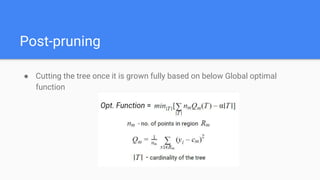
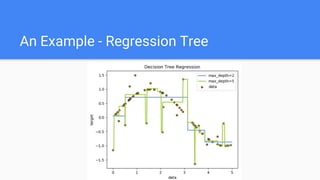
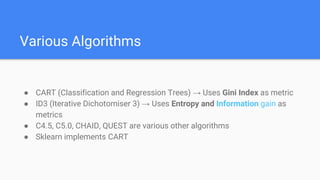
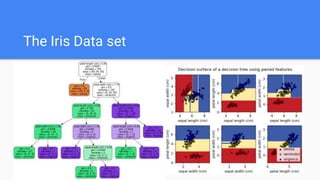
zekeLabs
Decision Trees
“Goal - Become a Data Scientist”
“A Dream becomes a Goal when action is taken towards its achievement” - Bo Bennett
“The Plan”
“A Goal without a Plan is just a wish”
● Introduction to Trees
● Construction of Trees
● Information
● Root-Node Decision
● Classification Tree
● Regression Tree
● Pruning
● Advantages and Disadvantages of Trees
Overview of
Decision Trees
Introduction to Trees
● Supervised learning algorithm
● Classification & Regression
● Flowchart-like structure
● Models consist of one or more
nested if-then statements
● Mimic the human level thinking
Construction of Tree
● Hierarchical way of partitioning
the space
● Conditioning on the features
● Greedy way of partitioning is done
Measuring Information
● Low probability events have higher information
● Entropy is the average rate of information
● The measure of uncertainty
Information Gain
● Measures how much “information” a feature gives us about the class
Classification Tree
● In this problem, we have
four features i.e, X values
and one response i.e, Y
● Need to learn mapping
between X and Y
Outlook Temp. Humidity Wind Play
Sunny Hot High FALSE No
Sunny Hot High TRUE No
Overcast Hot High FALSE Yes
Rainy Mild High FALSE Yes
Rainy Cool Normal FALSE Yes
Rainy Cool Normal TRUE No
Overcast Cool Normal TRUE Yes
Sunny Mild High FALSE No
Sunny Cool Normal FALSE Yes
Rainy Mild Normal FALSE Yes
Sunny Mild Normal TRUE Yes
Overcast Mild High TRUE Yes
Overcast Hot Normal FALSE Yes
Rainy Mild High TRUE No
The Root Node
Entropy:
Pyes = - (9/14)*log2(9/14) = 0.41
Pno = - (5/14)*log2(5/14) = 0.53
H(S) = Pno + Pyes = 0.94
Outlook Temp. Humidity Wind Play
Sunny Hot High FALSE No
Sunny Hot High TRUE No
Overcast Hot High FALSE Yes
Rainy Mild High FALSE Yes
Rainy Cool Normal FALSE Yes
Rainy Cool Normal TRUE No
Overcast Cool Normal TRUE Yes
Sunny Mild High FALSE No
Sunny Cool Normal FALSE Yes
Rainy Mild Normal FALSE Yes
Sunny Mild Normal TRUE Yes
Overcast Mild High TRUE Yes
Overcast Hot Normal FALSE Yes
Rainy Mild High TRUE No
The Root Node
E(Outlook = Sunny) = - (2/5)*log(2/5) - (3/5)*log(3/5) = 0.971
E(Outlook = Overcast) = - (1)*log(1) - (0)*log(0) = 0
E(Outlook = Sunny) = - (3/5)*log(3/5) - (2/5)*log(2/5) = 0.971
Average Entropy information for Outlook:
I(Outlook) = (5/14)*0.971+(4/14)*0+(5/14)*0.971 = 0.693
Gain(Outlook) = 0.94 - 0.693 = 0.247
Outlook Temperature
Info 0.693 Info 0.911
Gain 0.247 Gain 0.029
Humidity Windy
Info 0.788 Info 0.892
Gain 0.152 Gain 0.048
Algorithm
● Compute the entropy for data-set
● For every attribute/feature:
○ Calculate entropy for all categories
○ Take average information for the current
attribute
○ Calculate gain for the current attribute
● Pick the highest gain attribute
● Repeat until we get the desired tree
Other Criteria
● The Gini index is defined as:
where 𝑝(c) denotes the proportion of instances belonging to class c
● The Classification error is defined as:
Regression Tree
● Divide the space into regions and fit a
model to the each region
● Constant can be simple fit to a each
region
● Deciding on which feature to split
could be an optimization problem
Optimization Function
● The optimization function for the regression is
Optimization Function
● The average at each region is the best estimate of the values at particular
region
● s and j values are found by solving the above problem
Pruning
● It involves removing the branches
● Reduce the complexity of tree
● Increases its predictive power by reducing overfitting
● Two methods of pruning:
○ Pre-pruning
○ Post-pruning
Post-pruning
● Cutting the tree once it is grown fully based on below Global optimal
function
Pre-pruning
● Setting the parameters before building the model
○ Set maximum tree depth
○ Set maximum number of terminal nodes
○ Set minimum samples for a node split
○ Set maximum number of features
● Controls the size of a resultant terminal nodes
● Sklearn uses this method
An Example - Regression Tree
Various Algorithms
● CART (Classification and Regression Trees) → Uses Gini Index as metric
● ID3 (Iterative Dichotomiser 3) → Uses Entropy and Information gain as
metrics
● C4.5, C5.0, CHAID, QUEST are various other algorithms
● Sklearn implements CART
The Iris Data set
Advantages of Trees
● Simple to understand, interpret, visualize
● Implicitly perform variable screening or feature selection
● Can handle both numerical and categorical data
● Can also handle multi-output problems
● Decision trees require relatively little effort from users for data preparation
● Nonlinear relationships between parameters do not affect tree
performance
Disadvantages of Trees
● Decision-tree learners can create overfitting
● Decision trees can be unstable due to small variations in the data
● Greedy algorithms cannot guarantee to return the globally optimal tree
● Decision tree can be biased trees if some classes dominate

Decision Trees

  • 1.
  • 2.
    “Goal - Becomea Data Scientist” “A Dream becomes a Goal when action is taken towards its achievement” - Bo Bennett “The Plan” “A Goal without a Plan is just a wish”
  • 3.
    ● Introduction toTrees ● Construction of Trees ● Information ● Root-Node Decision ● Classification Tree ● Regression Tree ● Pruning ● Advantages and Disadvantages of Trees Overview of Decision Trees
  • 4.
    Introduction to Trees ●Supervised learning algorithm ● Classification & Regression ● Flowchart-like structure ● Models consist of one or more nested if-then statements ● Mimic the human level thinking
  • 5.
    Construction of Tree ●Hierarchical way of partitioning the space ● Conditioning on the features ● Greedy way of partitioning is done
  • 6.
    Measuring Information ● Lowprobability events have higher information ● Entropy is the average rate of information ● The measure of uncertainty
  • 7.
    Information Gain ● Measureshow much “information” a feature gives us about the class
  • 8.
    Classification Tree ● Inthis problem, we have four features i.e, X values and one response i.e, Y ● Need to learn mapping between X and Y Outlook Temp. Humidity Wind Play Sunny Hot High FALSE No Sunny Hot High TRUE No Overcast Hot High FALSE Yes Rainy Mild High FALSE Yes Rainy Cool Normal FALSE Yes Rainy Cool Normal TRUE No Overcast Cool Normal TRUE Yes Sunny Mild High FALSE No Sunny Cool Normal FALSE Yes Rainy Mild Normal FALSE Yes Sunny Mild Normal TRUE Yes Overcast Mild High TRUE Yes Overcast Hot Normal FALSE Yes Rainy Mild High TRUE No
  • 9.
    The Root Node Entropy: Pyes= - (9/14)*log2(9/14) = 0.41 Pno = - (5/14)*log2(5/14) = 0.53 H(S) = Pno + Pyes = 0.94 Outlook Temp. Humidity Wind Play Sunny Hot High FALSE No Sunny Hot High TRUE No Overcast Hot High FALSE Yes Rainy Mild High FALSE Yes Rainy Cool Normal FALSE Yes Rainy Cool Normal TRUE No Overcast Cool Normal TRUE Yes Sunny Mild High FALSE No Sunny Cool Normal FALSE Yes Rainy Mild Normal FALSE Yes Sunny Mild Normal TRUE Yes Overcast Mild High TRUE Yes Overcast Hot Normal FALSE Yes Rainy Mild High TRUE No
  • 10.
    The Root Node E(Outlook= Sunny) = - (2/5)*log(2/5) - (3/5)*log(3/5) = 0.971 E(Outlook = Overcast) = - (1)*log(1) - (0)*log(0) = 0 E(Outlook = Sunny) = - (3/5)*log(3/5) - (2/5)*log(2/5) = 0.971 Average Entropy information for Outlook: I(Outlook) = (5/14)*0.971+(4/14)*0+(5/14)*0.971 = 0.693 Gain(Outlook) = 0.94 - 0.693 = 0.247 Outlook Temperature Info 0.693 Info 0.911 Gain 0.247 Gain 0.029 Humidity Windy Info 0.788 Info 0.892 Gain 0.152 Gain 0.048
  • 11.
    Algorithm ● Compute theentropy for data-set ● For every attribute/feature: ○ Calculate entropy for all categories ○ Take average information for the current attribute ○ Calculate gain for the current attribute ● Pick the highest gain attribute ● Repeat until we get the desired tree
  • 12.
    Other Criteria ● TheGini index is defined as: where 𝑝(c) denotes the proportion of instances belonging to class c ● The Classification error is defined as:
  • 13.
    Regression Tree ● Dividethe space into regions and fit a model to the each region ● Constant can be simple fit to a each region ● Deciding on which feature to split could be an optimization problem
  • 14.
    Optimization Function ● Theoptimization function for the regression is
  • 15.
    Optimization Function ● Theaverage at each region is the best estimate of the values at particular region ● s and j values are found by solving the above problem
  • 16.
    Pruning ● It involvesremoving the branches ● Reduce the complexity of tree ● Increases its predictive power by reducing overfitting ● Two methods of pruning: ○ Pre-pruning ○ Post-pruning
  • 17.
    Post-pruning ● Cutting thetree once it is grown fully based on below Global optimal function
  • 18.
    Pre-pruning ● Setting theparameters before building the model ○ Set maximum tree depth ○ Set maximum number of terminal nodes ○ Set minimum samples for a node split ○ Set maximum number of features ● Controls the size of a resultant terminal nodes ● Sklearn uses this method
  • 19.
    An Example -Regression Tree
  • 20.
    Various Algorithms ● CART(Classification and Regression Trees) → Uses Gini Index as metric ● ID3 (Iterative Dichotomiser 3) → Uses Entropy and Information gain as metrics ● C4.5, C5.0, CHAID, QUEST are various other algorithms ● Sklearn implements CART
  • 21.
  • 22.
    Advantages of Trees ●Simple to understand, interpret, visualize ● Implicitly perform variable screening or feature selection ● Can handle both numerical and categorical data ● Can also handle multi-output problems ● Decision trees require relatively little effort from users for data preparation ● Nonlinear relationships between parameters do not affect tree performance
  • 23.
    Disadvantages of Trees ●Decision-tree learners can create overfitting ● Decision trees can be unstable due to small variations in the data ● Greedy algorithms cannot guarantee to return the globally optimal tree ● Decision tree can be biased trees if some classes dominate