Downloaded 29 times

![Crash bt - backtrace
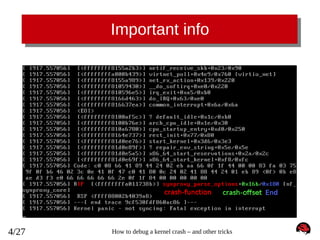
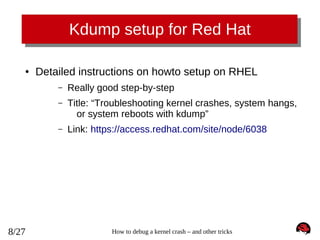
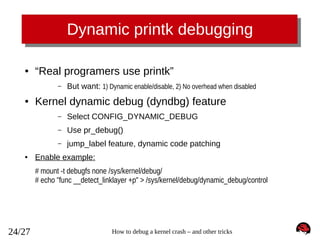
crash> bt
PID: 0
TASK: ffffffff81c10480 CPU: 0
COMMAND: "swapper/0"
#0 [ffff88002b4037c0] die at ffffffff81005c08
#1 [ffff88002b4037f0] do_trap at ffffffff81663deb
#2 [ffff88002b403800] __atomic_notifier_call_chain at ffffffff81667162
#3 [ffff88002b403850] do_invalid_op at ffffffff81002ea5
#4 [ffff88002b403890] dev_queue_xmit at ffffffff8155c59a
#5 [ffff88002b4038f0] invalid_op at ffffffff8166cc48
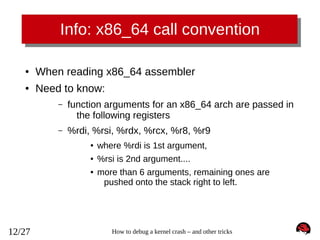
[exception RIP: synproxy_parse_options+363] (<-- notice decimal 363 == 0x16b)
RIP: ffffffffa010b38b RSP: ffff88002b4039a8 RFLAGS: 00010282
RAX: 00000000fffffff2 RBX: 000000000000000c RCX: 000000000000000c
RDX: ffff88002b4039a8 RSI: 0000000000000028 RDI: ffff880029768700
RBP: ffff88002b4039e8
R8: 0000000000000000
R9: 0000000000000000
R10: ffff880029768700 R11: 0000000000000000 R12: ffff88002b403a28
R13: ffff880029be5658 R14: ffff8800260a8630 R15: ffff880029aa6c62
ORIG_RAX: ffffffffffffffff CS: 0010 SS: 0018
#6 [ffff88002b4039a0] synproxy_parse_options at ffffffffa010b32b [nf_synproxy_core]
#7 [ffff88002b4039f0] synproxy_tg4 at ffffffffa0110a9e [ipt_SYNPROXY]
#8 [ffff88002b403a20] __kmalloc at ffffffff8117c4ae
#9 [ffff88002b403a80] ipt_do_table at ffffffffa00a90ee [ip_tables]
#10 [ffff88002b403bb0] iptable_filter_hook at ffffffffa00b20d3 [iptable_filter]
#11 [ffff88002b403bc0] nf_iterate at ffffffff815894b6
#12 [ffff88002b403c20] nf_hook_slow at ffffffff81589574
#13 [ffff88002b403ca0] ip_local_deliver at ffffffff81592a73
#14 [ffff88002b403cd0] ip_rcv_finish at ffffffff815923c1
#15 [ffff88002b403d00] ip_rcv at ffffffff81592d24
#16 [ffff88002b403d40] __netif_receive_skb_core at ffffffff81559f42
#17 [ffff88002b403db0] __netif_receive_skb at ffffffff8155a0d1
#18 [ffff88002b403dd0] netif_receive_skb at ffffffff8155a2b3
#19 [ffff88002b403e00] virtnet_poll at ffffffffa0027439 [virtio_net]
#20 [ffff88002b403ea0] net_rx_action at ffffffff8155a989
#21 [ffff88002b403f00] __do_softirq at ffffffff81059430
#22 [ffff88002b403f70] irq_exit at ffffffff810596e5
#23 [ffff88002b403f80] do_IRQ at ffffffff8166d463
13/27
How to debug a kernel crash – and other tricks](https://image.slidesharecdn.com/jesperbrouer-131029022322-phpapp02/85/Debugging-2013-Jesper-Brouer-13-320.jpg)
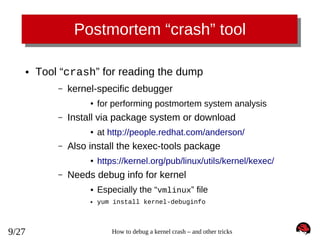
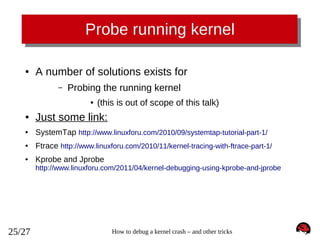
![Crash log – getting full log
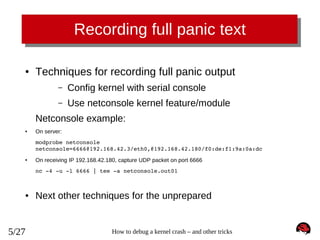
crash> log
[... cut ...]
[
53.644810] ------------[ cut here ]-----------[
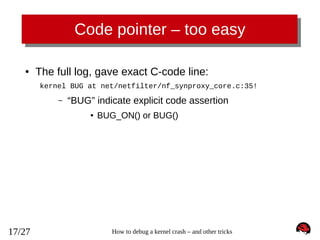
53.645587] kernel BUG at net/netfilter/nf_synproxy_core.c:35!
[
53.645587] invalid opcode: 0000 [#1] SMP
[
53.645587] Modules linked in: xt_conntrack xt_LOG ipt_SYNPROXY nf_synproxy_core xt_CT iptable_raw sunrpc ipt_REJECT nf_conntrack_ipv4
nf_defrag_ipv4 iptable_filter ip_tables ip6t_REJECT nf_conntrack_ipv6 nf_defrag_ipv6 xt_state nf_conntrack ip6table_filter ip6_tables
binfmt_misc floppy joydev microcode pcspkr virtio_balloon virtio_net i2c_piix4 i2c_core virtio_blk
[
53.645587] CPU: 0 PID: 0 Comm: swapper/0 Not tainted 3.12.0-rc3-synproxy04-bug+ #11
[
53.645587] Hardware name: Bochs Bochs, BIOS Bochs 01/01/2011
[
53.645587] task: ffffffff81c10480 ti: ffffffff81c00000 task.ti: ffffffff81c00000
[
53.645587] RIP: 0010:[<ffffffffa010b38b>] [<ffffffffa010b38b>] synproxy_parse_options+0x16b/0x180 [nf_synproxy_core]
[
53.645587] RSP: 0018:ffff88002b4039a8 EFLAGS: 00010282
[
53.645587] RAX: 00000000fffffff2 RBX: 000000000000000c RCX: 000000000000000c
[
53.645587] RDX: ffff88002b4039a8 RSI: 0000000000000028 RDI: ffff880029768700
[
53.645587] RBP: ffff88002b4039e8 R08: 0000000000000000 R09: 0000000000000000
[
53.645587] R10: ffff880029768700 R11: 0000000000000000 R12: ffff88002b403a28
[
53.645587] R13: ffff880029be5658 R14: ffff8800260a8630 R15: ffff880029aa6c62
[
53.645587] FS: 0000000000000000(0000) GS:ffff88002b400000(0000) knlGS:0000000000000000
[
53.645587] CS: 0010 DS: 0000 ES: 0000 CR0: 000000008005003b
[
53.645587] CR2: ffffffffff600400 CR3: 0000000028780000 CR4: 00000000000006f0
[
53.645587] Stack:
[
53.645587] ffff88002b4039d8 ffff8800289d16c0 ffff880029abf4f0 ffff88002b403b48
[
53.645587] ffff88002b4039d8 5daa3322d0120d19 ffff88002b403b48 ffff880029768700
[
53.645587] ffff88002b403a78 ffffffffa0110a9e ffff88002b403a18 ffff880029abf4f0
[
53.645587] Call Trace:
[
53.645587] <IRQ>
[
53.645587]
[
53.645587] [<ffffffffa0110a9e>] synproxy_tg4+0xde/0x2f8 [ipt_SYNPROXY]
[
53.645587] [<ffffffff8117c4ae>] ? __kmalloc+0x2e/0x190
[
53.645587] [<ffffffffa00a90ee>] ipt_do_table+0x2fe/0x745 [ip_tables]
[
53.645587] [<ffffffff813ace70>] ? virtqueue_kick+0x20/0x30
[
53.645587] [<ffffffffa00b20d3>] iptable_filter_hook+0x33/0x64 [iptable_filter]
[
53.645587] [<ffffffff815894b6>] nf_iterate+0x86/0xd0
[
53.645587] [<ffffffff81592680>] ? ip_rcv_finish+0x340/0x340
[
53.645587] [<ffffffff81589574>] nf_hook_slow+0x74/0x130
[
53.645587] [<ffffffff81592680>] ? ip_rcv_finish+0x340/0x340
[
53.645587] [<ffffffff81592a73>] ip_local_deliver+0x73/0x80
[
53.645587] [<ffffffff815923c1>] ip_rcv_finish+0x81/0x340
[
53.645587] [<ffffffff81592d24>] ip_rcv+0x2a4/0x3e0
[
53.645587] [<ffffffff81559f42>] __netif_receive_skb_core+0x672/0x7e0
[
53.645587] [<ffffffff8155a0d1>] __netif_receive_skb+0x21/0x70
[
53.645587] [<ffffffff8155a2b3>] netif_receive_skb+0x23/0x90
[
53.645587] [<ffffffffa0027439>] virtnet_poll+0x4e9/0x760 [virtio_net]
[
53.645587] [<ffffffff8155a989>] net_rx_action+0x139/0x220
[... cut ...]
[
53.645587] Code: c0 08 66 41 89 44 24 02 eb aa 66 0f 1f 44 00 00 83 fa 03 75 9f 0f b6 46 02 3c 0e 41 0f 47 c0 41 80 0c 24 02 41 88 44
24 01 eb 89 <0f> 0b e8 ae 93 f4 e0 66 66 66 66 66 2e 0f 1f 84 00 00 00 00 00
[
53.645587] RIP [<ffffffffa010b38b>] synproxy_parse_options+0x16b/0x180 [nf_synproxy_core]
[
53.645587] RSP <ffff88002b4039a8>
[
53.645587] ---[ end trace f6ddc710ff8b9002 ]--[
53.645587] Kernel panic - not syncing: Fatal exception in interrupt
15/27
How to debug a kernel crash – and other tricks](https://image.slidesharecdn.com/jesperbrouer-131029022322-phpapp02/85/Debugging-2013-Jesper-Brouer-15-320.jpg)
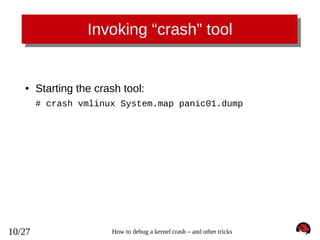
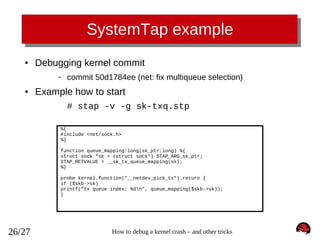
![Extra "ps" and "files" crash tricks
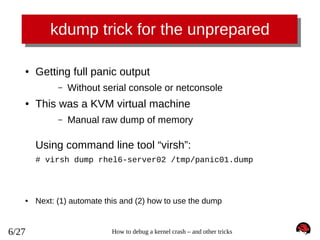
crash> ps
PID
PPID
[...cut...]
1512
1295
1515
1512
1563
1515
CPU
TASK
ST
%MEM
VSZ
RSS
COMM
0
0
0
ffff88002992c5f0
ffff88002992aea0
ffff880027a1c5f0
IN
IN
IN
0.5
0.3
0.1
100044
108344
105492
3892
1796
848
sshd
bash
less
crash> files 1563
PID: 1563
TASK: ffff880027a1c5f0 CPU: 0
COMMAND: "less"
ROOT: /
CWD: /root
FD
FILE
DENTRY
INODE
TYPE PATH
0 ffff8800297cef00 ffff880028d64240 ffff8800290e2fc0 CHR /dev/pts/0
1 ffff8800297cef00 ffff880028d64240 ffff8800290e2fc0 CHR /dev/pts/0
2 ffff8800297cef00 ffff880028d64240 ffff8800290e2fc0 CHR /dev/pts/0
3 ffff880029471100 ffff880029f813c0 ffff88002b28fce0 CHR /tty
4 ffff880029768800 ffff880028d44000 ffff880028d76480 REG /root/iptables_synproxy.sh
crash> set 1563
PID: 1563
COMMAND: "less"
TASK: ffff880027a1c5f0 [THREAD_INFO: ffff880028286000]
CPU: 0
STATE: TASK_INTERRUPTIBLE
16/27
How to debug a kernel crash – and other tricks](https://image.slidesharecdn.com/jesperbrouer-131029022322-phpapp02/85/Debugging-2013-Jesper-Brouer-16-320.jpg)
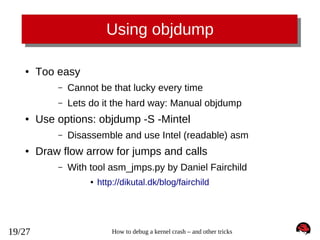


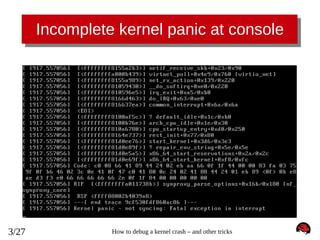
The document describes how to debug a kernel crash by recording the full kernel panic text using techniques like configuring a serial console, using the netconsole kernel feature, or manually dumping memory on a virtual machine. It also explains how to use the crash analysis tool to examine the crash dump, including getting a backtrace, disassembling instructions, and viewing the kernel log.