Download as PDF, PPTX

![OpenOCD telnet interface
Halt CPU, examine CPU state – halt
Single step, resume execution – step, resume
Read/Write memory – mdb/mdh/mdw, mwb/mwh/mww
(Be careful of cache memory, JTAG vs. CPU view)
Upload or download memory – load, dump
1 $ telnet localhost 4444
2 Trying 127.0.0.1...
3 Connected to localhost.
4 Escape character is '^]'.
5 Open On-Chip Debugger
6
7 > halt
8 am335x.cpu rev 2, partnum c08, arch f, variant 3, implementor 41
9 MPIDR not in multiprocessor format
10 target halted in Thumb state due to debug-request, current mode: Supervisor
11 cpsr: 0x800001b3 pc: 0x402fc892
12 MMU: disabled, D-Cache: disabled, I-Cache: enabled](https://image.slidesharecdn.com/er-2019-190929211233/85/Embedded-Recipes-2019-Introduction-to-JTAG-debugging-20-320.jpg)
![OpenOCD telnet interface (2)
Read first few instructions of U-Boot SPL in SRAM
1 > mdw 0x402f0400 0x4
2 0x402f0400: ea00000f e59ff014 e59ff014 e59ff014
3 ...
4 $ arm-linux-gnueabi-objdump -d spl/u-boot-spl
5 Disassembly of section .text:
6 402f0400 <__start>:
7 402f0400: ea00000f b 402f0444 <reset>
8 402f0404: e59ff014 ldr pc, [pc, #20]
9 402f0408: e59ff014 ldr pc, [pc, #20]
10 402f040c: e59ff014 ldr pc, [pc, #20]
1 > step
2 am335x.cpu rev 2, partnum c08, arch f, variant 3, implementor 41
3 target halted in Thumb state due to breakpoint, current mode: Supervisor
4 cpsr: 0x600001b3 pc: 0x402fc896
5 MMU: disabled, D-Cache: disabled, I-Cache: enabled
6 > step
7 am335x.cpu rev 2, partnum c08, arch f, variant 3, implementor 41
8 target halted in Thumb state due to breakpoint, current mode: Supervisor
9 cpsr: 0x600001b3 pc: 0x402fc89a
10 MMU: disabled, D-Cache: disabled, I-Cache: enabled](https://image.slidesharecdn.com/er-2019-190929211233/85/Embedded-Recipes-2019-Introduction-to-JTAG-debugging-21-320.jpg)

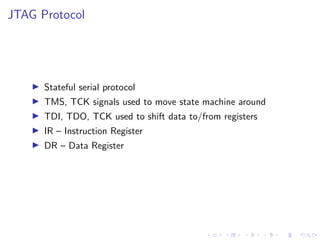
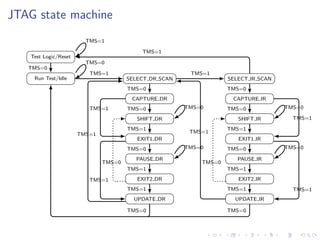
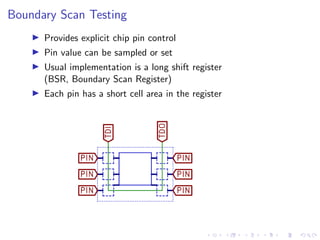
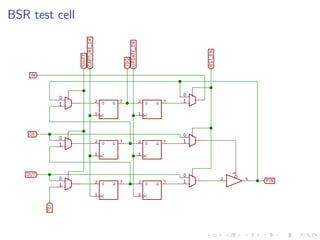
The document provides a comprehensive introduction to JTAG (Joint Test Action Group), detailing its history, hardware, protocols, and applications in debugging and testing PCBs. It discusses the electrical interface, instructions, state machine operations, and the crucial role of boundary scan testing for controlling pin values. Additionally, the document covers JTAG debugging using software tools like OpenOCD and provides examples of GDB commands for debugging U-Boot, concluding that JTAG interfaces offer powerful debugging functionalities but require further development of existing free and open-source tools.