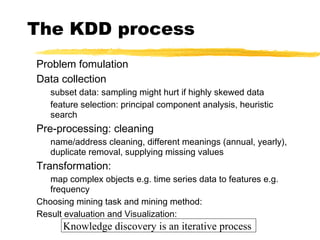
This document provides an introduction to data mining. It discusses why organizations use data mining, such as for credit ratings, fraud detection, and customer relationship management. It describes the data mining process of problem formulation, data collection/preprocessing, mining methods, and result evaluation. Specific mining methods covered include classification, clustering, association rule mining, and neural networks. It also discusses applications of data mining across various industries and gives some examples of successful real-world data mining implementations.


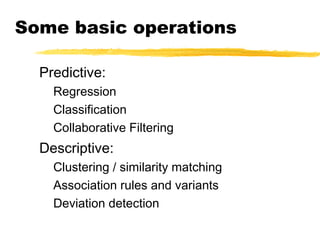


![Collaborative
recommendation
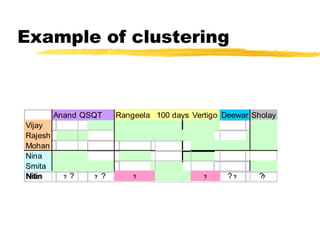
RangeelaQSQT 100 daysAnand Sholay Deewar Vertigo
Smita
Vijay
Mohan
Rajesh
Nina
Nitin ? ? ? ? ? ?
•Possible approaches:
• Average vote along columns [Same prediction for all]
• Weight vote based on similarity of likings [GroupLens]
RangeelaQSQT 100 daysAnand Sholay Deewar Vertigo
Smita
Vijay
Mohan
Rajesh
Nina
Nitin ? ? ? ? ? ?](https://image.slidesharecdn.com/datamining-intro-iep-150306122041-conversion-gate01/85/Datamining-intro-iep-27-320.jpg)
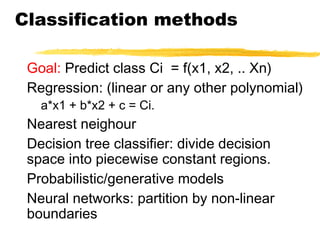
![Cluster-based approaches
External attributes of people and movies to
cluster
age, gender of people
actors and directors of movies.
[ May not be available]
Cluster people based on movie preferences
misses information about similarity of movies
Repeated clustering:
cluster movies based on people, then people based
on movies, and repeat
ad hoc, might smear out groups](https://image.slidesharecdn.com/datamining-intro-iep-150306122041-conversion-gate01/85/Datamining-intro-iep-28-320.jpg)


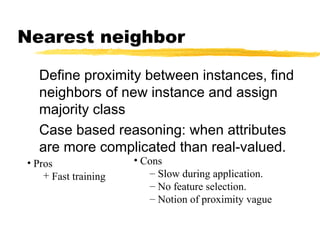
![Applications of fast
itemset counting
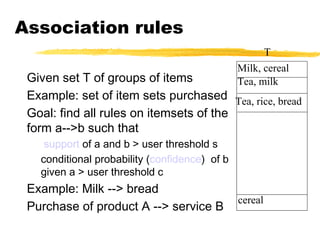
Find correlated events:
Applications in medicine: find redundant
tests
Cross selling in retail, banking
Improve predictive capability of classifiers
that assume attribute independence
New similarity measures of categorical
attributes [Mannila et al, KDD 98]](https://image.slidesharecdn.com/datamining-intro-iep-150306122041-conversion-gate01/85/Datamining-intro-iep-36-320.jpg)


![State of art in mining OLAP
integration
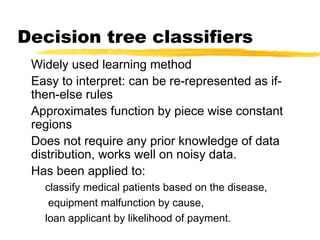
Decision trees [Information discovery, Cognos]
find factors influencing high profits
Clustering [Pilot software]
segment customers to define hierarchy on that dimension
Time series analysis: [Seagate’s Holos]
Query for various shapes along time: eg. spikes, outliers
Multi-level Associations [Han et al.]
find association between members of dimensions
Sarawagi [VLDB2000]](https://image.slidesharecdn.com/datamining-intro-iep-150306122041-conversion-gate01/85/Datamining-intro-iep-45-320.jpg)