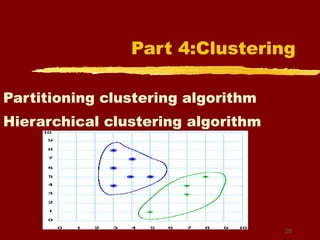
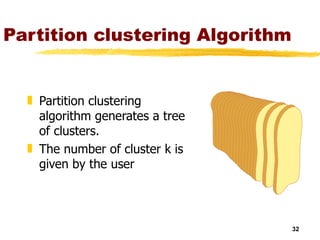
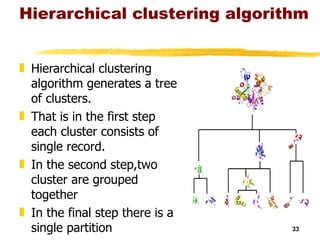
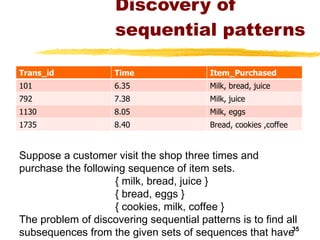
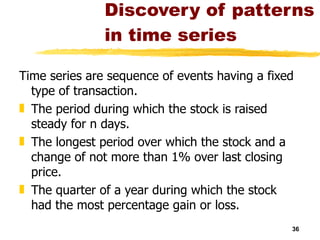
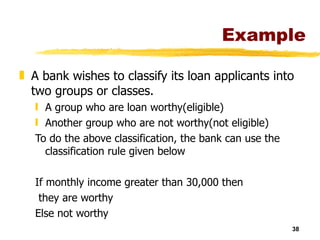
Clustering in Data Warehouse Department of CE MSPVL Polytechnic College Pavoorchatram 1
Overview Part 1: what is Data mining  Part 2:Association Rules Part 3:Classification Part 4: clustering Part 5: Approaches to data mining  Problems Part 6: Application of Data Mining Part7:commercial tools for data mining
Part 1: Data Mining
Relationship to data warehouse Data mining uses data warehouse to take decisions. Data warehouse is to support decision making. Data mining can be applied to operational database with individual transaction. Data mining helps in extracting meaningful new patterns. Data mining applications should be considered during the design of a data warehouse. The successful use of database mining applications depends on the construction of data warehouse.
Define Data Mining Data mining is sorting through data to identify patterns and establish relationships. Data mining parameters include:  Association  - looking for patterns where one event is connected to another event  Sequence or path analysis  - looking for patterns where one event leads to another later event  Classification  - looking for new patterns (May result in a change in the way the data is organized but that's ok)  Clustering  - finding and visually documenting groups of facts not previously known
Part 2: Association Rules
Association Rules Association rules between Set of items in large database
Why Association Rules? Bread ,milk Milk ,sugar Pen ,ink
The general form of association rule is X  Y x     set of items {x1,x2,….xn} y    Set of items {y1,y2,y3…yn} The above rule can be stated as database tuples that satisfy the condition in x are also likely to satisfy the condition in y.
Consider the Purchase Table Retail shops are often interested in association between different items that people buy. If we refer the table given above it is clear that People who buy pen also buys ink People who buys bread also milk.
Association rules measures Support Confidence
Support This is the measure of percentage of transaction that contains the union all the items in the LHS and RHS. Consider the rule  PEN    INK has a support of 75%. That is the items in LHS U RHS occur in 75% of transactions and a higher support.
Confidence Confidence is the measure of percentage of transactions that include the items in RHS. Confidence is a measure of how often the rule is true. bread    Milk Confidence of 80% of the purchases that include bread also milk.
Part 3:  classification Classification rules Decision trees Mathematical formula Neural network
Some basic operations Predictive: Regression Classification Descriptive: Clustering / similarity matching Association rules and variants Deviation detection
Classification Given old data about customers and payments, predict new applicant’s loan eligibility. Age Salary Profession Location Customer type Previous customers Classifier Decision rules Salary > 5 L Prof. =  Exec New applicant’s data Good/ bad
Classification Classification is a data mining (machine learning) technique used to predict group membership for data instances.
Why Data Mining Credit ratings/targeted marketing : Given a database of 100,000 names, which persons are the least likely to default on their credit cards?  Identify likely responders to sales promotions Fraud detection Which types of transactions are likely to be fraudulent, given the demographics and transactional history of a particular customer?  Customer relationship management : Which of my customers are likely to be the most loyal, and which are most likely to leave for a competitor?  :
Classification Classification is defined as a process of finding a set of functions that describe and distinguish data classes. Training Data Classification algorithm  Classification Rules If age=“31 …. 40” And income=high Then rating = good. Name Age Income Rating abc 20 low fair xyz 31…40 Medium Good mny 40…50 High Excellent
classification This function we can find out the classes of the objects whose class labels are not known based on a set of training data. A training data is a data whose class label is known. The following are the different forms of classification  Classification Rules Decision trees Mathematical formula Neural network
Classification methods Goal:  Predict class Ci  = f(x1, x2, .. Xn) Regression: (linear or any other polynomial)  a*x1 + b*x2 + c = Ci.  Decision tree classifier: divide decision space into piecewise constant regions. Neural networks: partition by non-linear boundaries
Tree where internal nodes are simple decision rules on one or more attributes and leaf nodes are predicted class labels.  Decision trees Salary < 1 M Prof = teacher Age < 30 Good Bad Bad Good
Pros and Cons of decision trees Cons Cannot handle complicated relationship between features simple decision boundaries problems with lots of missing data Pros Reasonable training  time Fast application Easy to interpret Easy to implement Can handle large number of features
Neural network Set of nodes connected by directed weighted edges Hidden nodes Output nodes x1 x2 x3 x1 x2 x3 w1 w2 w3 Basic NN unit A more typical NN
Pros and Cons of Neural Network Cons Slow training time Hard to interpret  Hard to implement: trial and error for choosing number of nodes Pros Can learn more complicated class boundaries Fast application Can handle large number of features Conclusion: Use neural nets only if decision trees/NN fail. classification
Part 4:Clustering Partitioning clustering algorithm Hierarchical clustering algorithm
Clustering Unsupervised learning when old data with class labels not available e.g. when introducing a new product. Group/cluster existing customers based on time series of payment history such that similar customers in same cluster. Key requirement: Need a good measure of similarity between instances.
clustering
Similarity
Prevalent    Interesting Analysts already know about prevalent rules Interesting rules are those that  deviate  from prior expectation Mining’s payoff is in finding  surprising  phenomenon 1995 Milk and cereal sell together! Milk and cereal sell together! 1998 Zzzz...
Clustering Algorithm Partition clustering Algorithm Hierarchical clustering algorithm
Partition clustering Algorithm Partition clustering algorithm generates a tree of clusters. The number of cluster k is given by the user
Hierarchical clustering algorithm Hierarchical clustering algorithm generates a tree of clusters. That is in the first step each cluster consists of single record. In the second step,two cluster are grouped together In the final step there is a  single partition
Part 6:  Approaches to data mining problems Discovery of sequential Discovery of patterns in time series Discovery of classification rules Regression
Discovery of sequential patterns Suppose a customer visit the shop three times and purchase the following sequence of item sets. { milk, bread, juice } { bread, eggs } { cookies, milk, coffee } The problem of discovering sequential patterns is to find all subsequences from the given sets of sequences that have a user defined minimum support. Trans_id Time Item_Purchased 101 6.35 Milk, bread, juice 792 7.38 Milk, juice 1130 8.05 Milk, eggs 1735 8.40 Bread, cookies ,coffee
Discovery of patterns in time series Time series are sequence of events having a fixed type of transaction. The period during which the stock is raised steady for n days. The longest period over which the stock and a change of not more than 1% over last closing price. The quarter of a year during which the stock had the most percentage gain or loss.
Discovery of classification rules Classification is a process of defining a function that classifies a given object into many possible classes.
Example A bank wishes to classify its loan applicants into two groups or classes. A group who are loan worthy(eligible) Another group who are not worthy(not eligible) To do the above classification, the bank can use the classification rule given below If monthly income greater than 30,000 then they are worthy Else not worthy
Regression Regression is defined as a function over variables which gives a target class variable.
Example Labtest(Patient id,test1,test2,….testn) This contain values of n test for one patient The target variable that wish to predict is p, the probability of survival of the patient. p=f{test1,test2,test3…testn} This function is called regression function.
MSPVL Polytechnic college

Cluster2

  • 1.
    Clustering in DataWarehouse Department of CE MSPVL Polytechnic College Pavoorchatram 1
  • 2.
    Overview Part 1:what is Data mining Part 2:Association Rules Part 3:Classification Part 4: clustering Part 5: Approaches to data mining Problems Part 6: Application of Data Mining Part7:commercial tools for data mining
  • 3.
  • 4.
    Relationship to datawarehouse Data mining uses data warehouse to take decisions. Data warehouse is to support decision making. Data mining can be applied to operational database with individual transaction. Data mining helps in extracting meaningful new patterns. Data mining applications should be considered during the design of a data warehouse. The successful use of database mining applications depends on the construction of data warehouse.
  • 5.
    Define Data MiningData mining is sorting through data to identify patterns and establish relationships. Data mining parameters include: Association - looking for patterns where one event is connected to another event Sequence or path analysis - looking for patterns where one event leads to another later event Classification - looking for new patterns (May result in a change in the way the data is organized but that's ok) Clustering - finding and visually documenting groups of facts not previously known
  • 6.
  • 7.
    Association Rules Associationrules between Set of items in large database
  • 8.
    Why Association Rules?Bread ,milk Milk ,sugar Pen ,ink
  • 9.
    The general formof association rule is X  Y x  set of items {x1,x2,….xn} y  Set of items {y1,y2,y3…yn} The above rule can be stated as database tuples that satisfy the condition in x are also likely to satisfy the condition in y.
  • 10.
    Consider the PurchaseTable Retail shops are often interested in association between different items that people buy. If we refer the table given above it is clear that People who buy pen also buys ink People who buys bread also milk.
  • 11.
    Association rules measuresSupport Confidence
  • 12.
    Support This isthe measure of percentage of transaction that contains the union all the items in the LHS and RHS. Consider the rule PEN  INK has a support of 75%. That is the items in LHS U RHS occur in 75% of transactions and a higher support.
  • 13.
    Confidence Confidence isthe measure of percentage of transactions that include the items in RHS. Confidence is a measure of how often the rule is true. bread  Milk Confidence of 80% of the purchases that include bread also milk.
  • 14.
    Part 3: classification Classification rules Decision trees Mathematical formula Neural network
  • 15.
    Some basic operationsPredictive: Regression Classification Descriptive: Clustering / similarity matching Association rules and variants Deviation detection
  • 16.
    Classification Given olddata about customers and payments, predict new applicant’s loan eligibility. Age Salary Profession Location Customer type Previous customers Classifier Decision rules Salary > 5 L Prof. = Exec New applicant’s data Good/ bad
  • 17.
    Classification Classification isa data mining (machine learning) technique used to predict group membership for data instances.
  • 18.
    Why Data MiningCredit ratings/targeted marketing : Given a database of 100,000 names, which persons are the least likely to default on their credit cards? Identify likely responders to sales promotions Fraud detection Which types of transactions are likely to be fraudulent, given the demographics and transactional history of a particular customer? Customer relationship management : Which of my customers are likely to be the most loyal, and which are most likely to leave for a competitor? :
  • 19.
    Classification Classification isdefined as a process of finding a set of functions that describe and distinguish data classes. Training Data Classification algorithm Classification Rules If age=“31 …. 40” And income=high Then rating = good. Name Age Income Rating abc 20 low fair xyz 31…40 Medium Good mny 40…50 High Excellent
  • 20.
    classification This functionwe can find out the classes of the objects whose class labels are not known based on a set of training data. A training data is a data whose class label is known. The following are the different forms of classification Classification Rules Decision trees Mathematical formula Neural network
  • 21.
    Classification methods Goal: Predict class Ci = f(x1, x2, .. Xn) Regression: (linear or any other polynomial) a*x1 + b*x2 + c = Ci. Decision tree classifier: divide decision space into piecewise constant regions. Neural networks: partition by non-linear boundaries
  • 22.
    Tree where internalnodes are simple decision rules on one or more attributes and leaf nodes are predicted class labels. Decision trees Salary < 1 M Prof = teacher Age < 30 Good Bad Bad Good
  • 23.
    Pros and Consof decision trees Cons Cannot handle complicated relationship between features simple decision boundaries problems with lots of missing data Pros Reasonable training time Fast application Easy to interpret Easy to implement Can handle large number of features
  • 24.
    Neural network Setof nodes connected by directed weighted edges Hidden nodes Output nodes x1 x2 x3 x1 x2 x3 w1 w2 w3 Basic NN unit A more typical NN
  • 25.
    Pros and Consof Neural Network Cons Slow training time Hard to interpret Hard to implement: trial and error for choosing number of nodes Pros Can learn more complicated class boundaries Fast application Can handle large number of features Conclusion: Use neural nets only if decision trees/NN fail. classification
  • 26.
    Part 4:Clustering Partitioningclustering algorithm Hierarchical clustering algorithm
  • 27.
    Clustering Unsupervised learningwhen old data with class labels not available e.g. when introducing a new product. Group/cluster existing customers based on time series of payment history such that similar customers in same cluster. Key requirement: Need a good measure of similarity between instances.
  • 28.
  • 29.
  • 30.
    Prevalent  Interesting Analysts already know about prevalent rules Interesting rules are those that deviate from prior expectation Mining’s payoff is in finding surprising phenomenon 1995 Milk and cereal sell together! Milk and cereal sell together! 1998 Zzzz...
  • 31.
    Clustering Algorithm Partitionclustering Algorithm Hierarchical clustering algorithm
  • 32.
    Partition clustering AlgorithmPartition clustering algorithm generates a tree of clusters. The number of cluster k is given by the user
  • 33.
    Hierarchical clustering algorithmHierarchical clustering algorithm generates a tree of clusters. That is in the first step each cluster consists of single record. In the second step,two cluster are grouped together In the final step there is a single partition
  • 34.
    Part 6: Approaches to data mining problems Discovery of sequential Discovery of patterns in time series Discovery of classification rules Regression
  • 35.
    Discovery of sequentialpatterns Suppose a customer visit the shop three times and purchase the following sequence of item sets. { milk, bread, juice } { bread, eggs } { cookies, milk, coffee } The problem of discovering sequential patterns is to find all subsequences from the given sets of sequences that have a user defined minimum support. Trans_id Time Item_Purchased 101 6.35 Milk, bread, juice 792 7.38 Milk, juice 1130 8.05 Milk, eggs 1735 8.40 Bread, cookies ,coffee
  • 36.
    Discovery of patternsin time series Time series are sequence of events having a fixed type of transaction. The period during which the stock is raised steady for n days. The longest period over which the stock and a change of not more than 1% over last closing price. The quarter of a year during which the stock had the most percentage gain or loss.
  • 37.
    Discovery of classificationrules Classification is a process of defining a function that classifies a given object into many possible classes.
  • 38.
    Example A bankwishes to classify its loan applicants into two groups or classes. A group who are loan worthy(eligible) Another group who are not worthy(not eligible) To do the above classification, the bank can use the classification rule given below If monthly income greater than 30,000 then they are worthy Else not worthy
  • 39.
    Regression Regression isdefined as a function over variables which gives a target class variable.
  • 40.
    Example Labtest(Patient id,test1,test2,….testn)This contain values of n test for one patient The target variable that wish to predict is p, the probability of survival of the patient. p=f{test1,test2,test3…testn} This function is called regression function.
  • 41.

Editor's Notes

  • #16 Each topic is a talk..