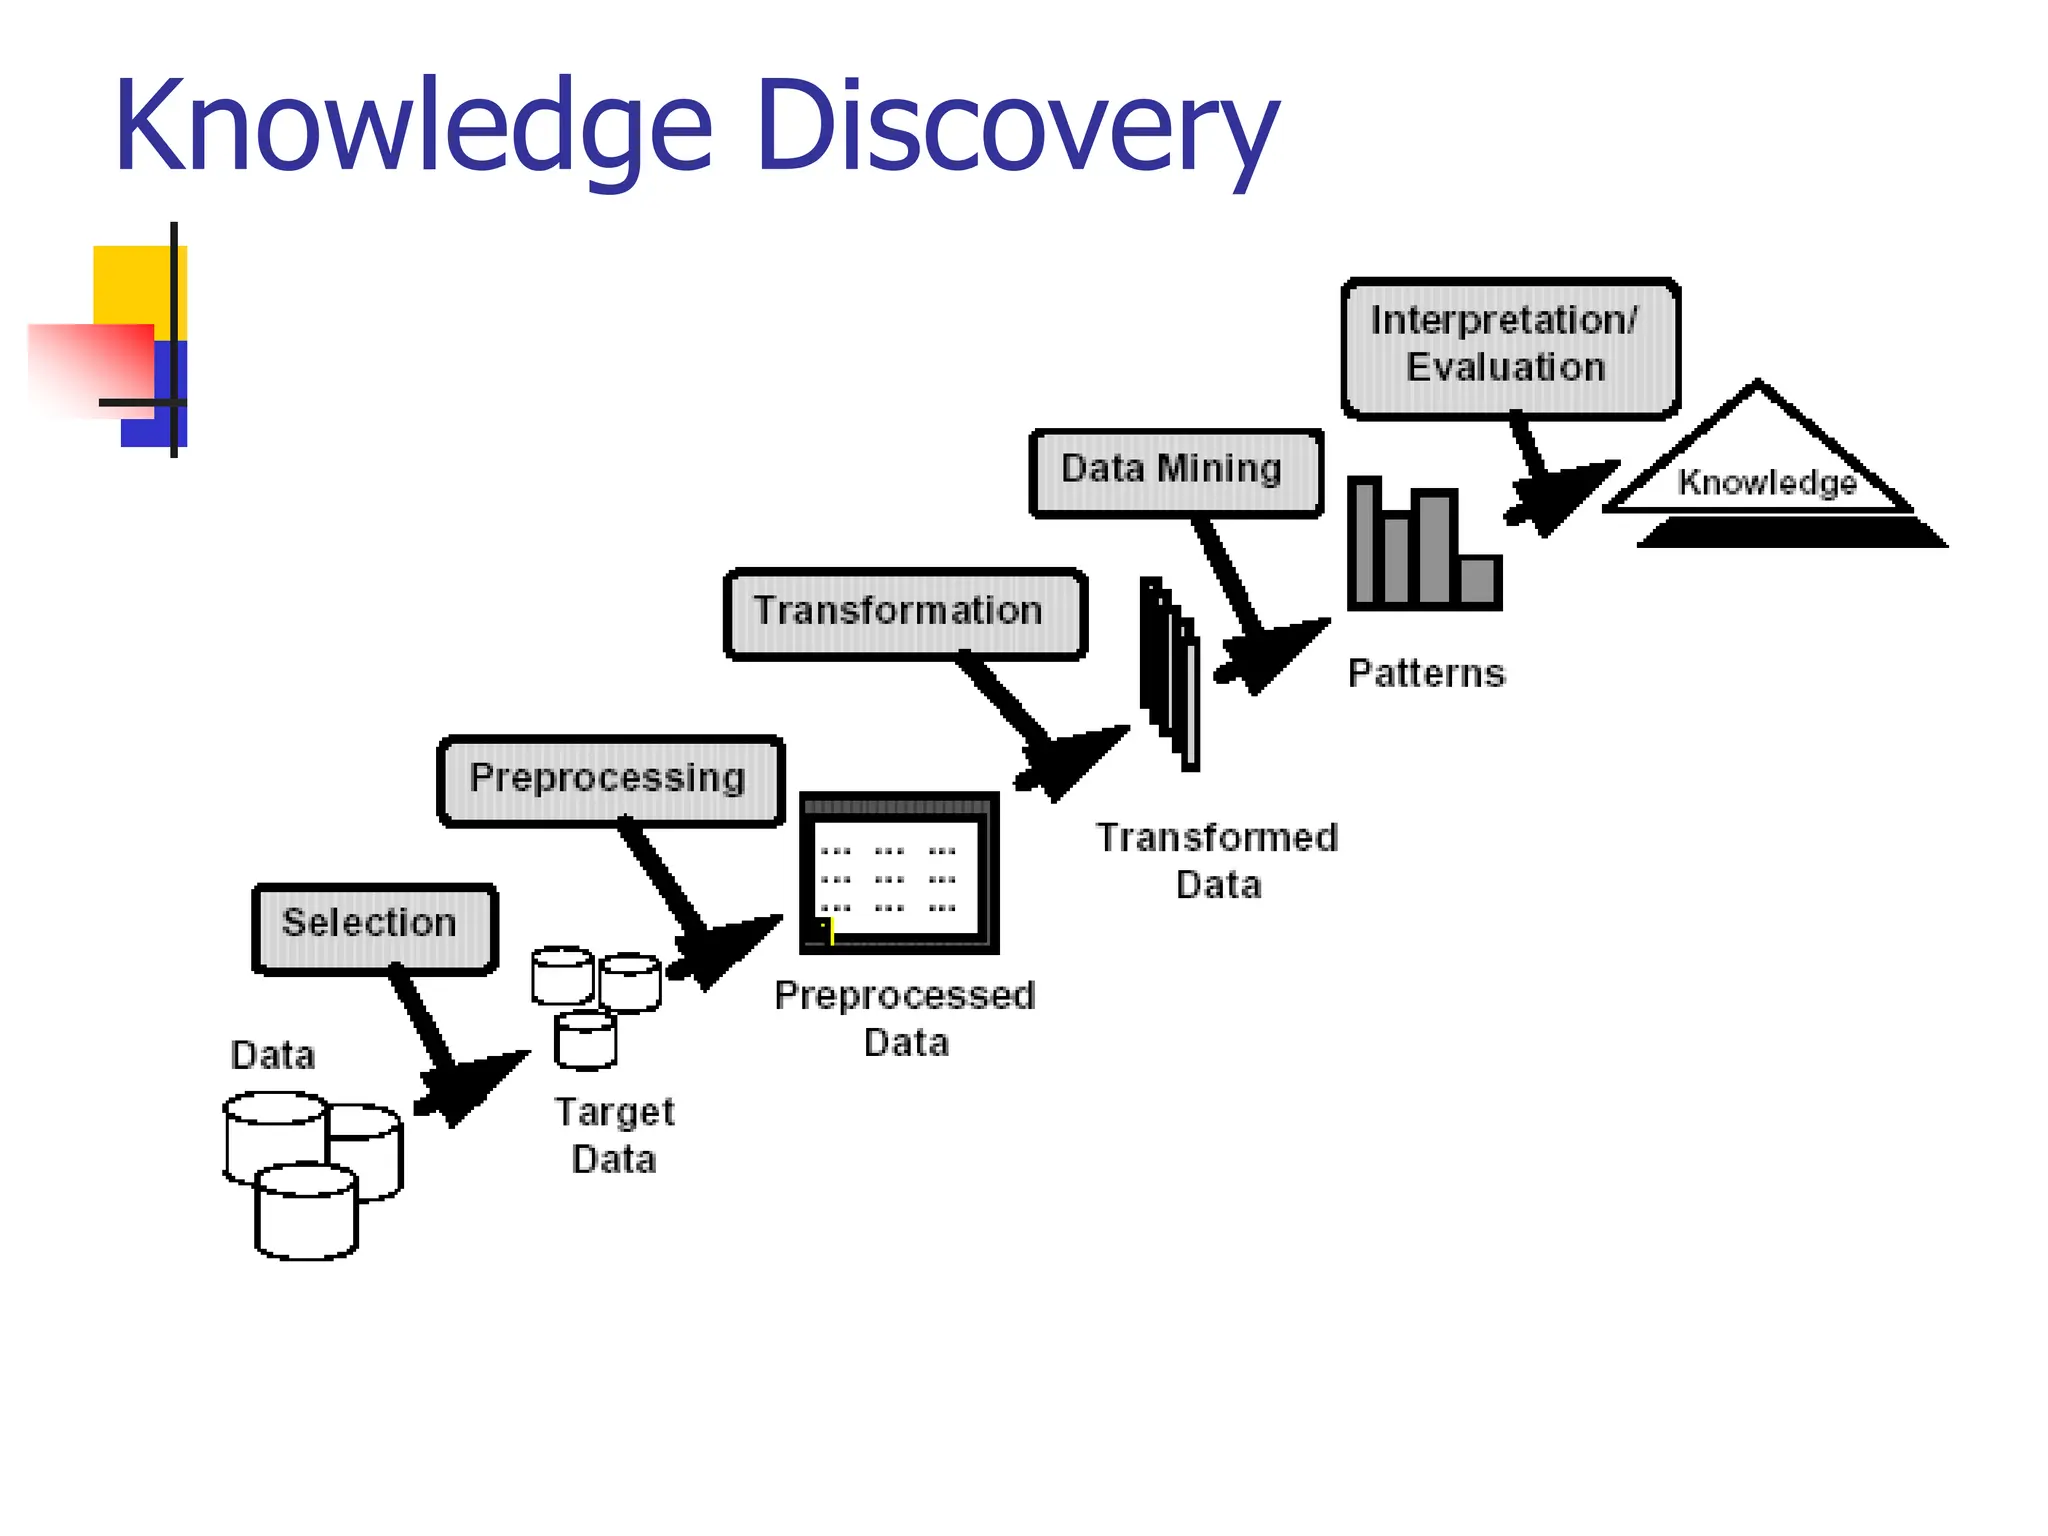
4. Data Mining Overview
Data warehouses and OLAP (On Line Analytical
Processing.)
Association Rules Mining
Clustering: Hierarchical and Partition approaches
Classification: Decision Trees and Bayesian classifiers
Sequential Pattern Mining
Advanced topics: graph mining, privacy preserving data
mining, outlier detection, spatial data mining
5. What is Data Mining?
Data Mining is:
(1) The efficient discovery of previously unknown,
valid, potentially useful, understandable patterns in
large datasets
(2) The analysis of (often large) observational data
sets to find unsuspected relationships and to
summarize the data in novel ways that are both
understandable and useful to the data owner
6. Overview of terms
Data: a set of facts (items) D, usually stored in a
database
Pattern: an expression E in a language L, that
describes a subset of facts
Attribute: a field in an item i in D.
Interestingness: a function ID,L that maps an
expression E in L into a measure space M
7. Overview of terms
The Data Mining Task:
For a given dataset D, language of facts L,
interestingness function ID,L and threshold c, find
the expression E such that ID,L(E) > c efficiently.
9. Examples of Large Datasets
Government: IRS, NGA, …
Large corporations
WALMART: 20M transactions per day
MOBIL: 100 TB geological databases
AT&T 300 M calls per day
Credit card companies
Scientific
NASA, EOS project: 50 GB per hour
Environmental datasets
10. Examples of Data mining Applications
1. Fraud detection: credit cards, phone cards
2. Marketing: customer targeting
3. Data Warehousing: Walmart
4. Astronomy
5. Molecular biology
11. How Data Mining is used
1. Identify the problem
2. Use data mining techniques to transform the
data into information
3. Act on the information
4. Measure the results
12. The Data Mining Process
1. Understand the domain
2. Create a dataset:
Select the interesting attributes
Data cleaning and preprocessing
3. Choose the data mining task and the specific
algorithm
4. Interpret the results, and possibly return to 2
13. Draws ideas from machine learning/AI,
pattern recognition, statistics, and database
systems
Must address:
Enormity of data
High dimensionality
of data
Heterogeneous,
distributed nature
of data
Origins of Data Mining
AI /
Machine Learning
Statistics
Data Mining
Database
systems
14. Data Mining Tasks
1. Classification: learning a function that maps an
item into one of a set of predefined classes
2. Regression: learning a function that maps an
item to a real value
3. Clustering: identify a set of groups of similar
items
15. Data Mining Tasks
4. Dependencies and associations:
identify significant dependencies between data
attributes
5. Summarization: find a compact description of
the dataset or a subset of the dataset
16. Data Mining Methods
1. Decision Tree Classifiers:
Used for modeling, classification
2. Association Rules:
Used to find associations between sets of attributes
3. Sequential patterns:
Used to find temporal associations in time series
4. Hierarchical clustering:
used to group customers, web users, etc
17. Why Data Preprocessing?
Data in the real world is dirty
incomplete: lacking attribute values, lacking certain attributes of
interest, or containing only aggregate data
noisy: containing errors or outliers
inconsistent: containing discrepancies in codes or names
No quality data, no quality mining results!
Quality decisions must be based on quality data
Data warehouse needs consistent integration of quality data
Required for both OLAP and Data Mining!
18. Why can Data be Incomplete?
Attributes of interest are not available (e.g., customer
information for sales transaction data)
Data were not considered important at the time of
transactions, so they were not recorded!
Data not recorder because of misunderstanding or
malfunctions
Data may have been recorded and later deleted!
Missing/unknown values for some data
19. Data Cleaning
Data cleaning tasks
Fill in missing values
Identify outliers and smooth out noisy data
Correct inconsistent data
20. Classification: Definition
Given a collection of records (training set )
Each record contains a set of attributes, one of the attributes
is the class.
Find a model for class attribute as a function
of the values of other attributes.
Goal: previously unseen records should be
assigned a class as accurately as possible.
A test set is used to determine the accuracy of the model.
Usually, the given data set is divided into training and test
sets, with training set used to build the model and test set
used to validate it.
21. Classification Example
Tid Home
Owner
Marital
Status
Taxable
Income Default
1 Yes Single 125K No
2 No Married 100K No
3 No Single 70K No
4 Yes Married 120K No
5 No Divorced 95K Yes
6 No Married 60K No
7 Yes Divorced 220K No
8 No Single 85K Yes
9 No Married 75K No
10 No Single 90K Yes
10
Home
Owner
Marital
Status
Taxable
Income Default
No Single 75K ?
Yes Married 50K ?
No Married 150K ?
Yes Divorced 90K ?
No Single 40K ?
No Married 80K ?
10
Test
Set
Training
Set
Model
Learn
Classifier
22. Example of a Decision Tree
Tid Home
Owner
Marital
Status
Taxable
Income Default
1 Yes Single 125K No
2 No Married 100K No
3 No Single 70K No
4 Yes Married 120K No
5 No Divorced 95K Yes
6 No Married 60K No
7 Yes Divorced 220K No
8 No Single 85K Yes
9 No Married 75K No
10 No Single 90K Yes
10
HO
MarSt
TaxInc
YES
NO
NO
NO
Yes No
Married
Single, Divorced
< 80K > 80K
Splitting Attributes
Training Data Model: Decision Tree
23. Another Example of Decision Tree
Tid Home
Owner
Marital
Status
Taxable
Income Default
1 Yes Single 125K No
2 No Married 100K No
3 No Single 70K No
4 Yes Married 120K No
5 No Divorced 95K Yes
6 No Married 60K No
7 Yes Divorced 220K No
8 No Single 85K Yes
9 No Married 75K No
10 No Single 90K Yes
10
MarSt
HO
TaxInc
YES
NO
NO
NO
Yes No
Married
Single,
Divorced
< 80K > 80K
There could be more than one tree that
fits the same data!
24. Classification: Application 1
Direct Marketing
Goal: Reduce cost of mailing by targeting a set of consumers
likely to buy a new cell-phone product.
Approach:
Use the data for a similar product introduced before.
We know which customers decided to buy and which decided
otherwise. This {buy, don’t buy} decision forms the class attribute.
Collect various demographic, lifestyle, and company-interaction
related information about all such customers.
Type of business, where they stay, how much they earn, etc.
Use this information as input attributes to learn a classifier model.
From [Berry & Linoff] Data Mining Techniques, 1997
25. Classification: Application 2
Fraud Detection
Goal: Predict fraudulent cases in credit card transactions.
Approach:
Use credit card transactions and the information on its account-
holder as attributes.
When does a customer buy, what does he buy, how often he
pays on time, etc
Label past transactions as fraud or fair transactions. This forms the
class attribute.
Learn a model for the class of the transactions.
Use this model to detect fraud by observing credit card
transactions on an account.
26. Clustering Definition
Given a set of data points, each having a set of
attributes, and a similarity measure among
them, find clusters such that
Data points in one cluster are more similar to one
another.
Data points in separate clusters are less similar to one
another.
Similarity Measures:
Euclidean Distance if attributes are continuous.
Other Problem-specific Measures.
28. Clustering: Application 1
Market Segmentation:
Goal: subdivide a market into distinct subsets of customers
where any subset may conceivably be selected as a market
target to be reached with a distinct marketing mix.
Approach:
Collect different attributes of customers based on their
geographical and lifestyle related information.
Find clusters of similar customers.
Measure the clustering quality by observing buying patterns of
customers in same cluster vs. those from different clusters.
29. Clustering: Application 2
Document Clustering:
Goal: To find groups of documents that are similar to
each other based on the important terms appearing in
them.
Approach: To identify frequently occurring terms in
each document. Form a similarity measure based on
the frequencies of different terms. Use it to cluster.
Gain: Information Retrieval can utilize the clusters to
relate a new document or search term to clustered
documents.
30. Illustrating Document
Clustering
Clustering Points: 3204 Articles of Los Angeles Times.
Similarity Measure: How many words are common in
these documents (after some word filtering).
Category Total
Articles
Correctly
Placed
Financial 555 364
Foreign 341 260
National 273 36
Metro 943 746
Sports 738 573
Entertainment 354 278
31. Association Rule Discovery:
Definition
Given a set of records each of which contain some
number of items from a given collection;
Produce dependency rules which will predict occurrence of an
item based on occurrences of other items.
TID Items
1 Bread, Coke, Milk
2 Beer, Bread
3 Beer, Coke, Diaper, Milk
4 Beer, Bread, Diaper, Milk
5 Coke, Diaper, Milk
Rules Discovered:
{Milk} --> {Coke}
{Diaper, Milk} --> {Beer}
32. Association Rule Discovery:
Application 1
Marketing and Sales Promotion:
Let the rule discovered be
{Bagels, … } --> {Potato Chips}
Potato Chips as consequent => Can be used to determine what
should be done to boost its sales.
Bagels in the antecedent => Can be used to see which products
would be affected if the store discontinues selling bagels.
Bagels in antecedent and Potato chips in consequent => Can be
used to see what products should be sold with Bagels to
promote sale of Potato chips!
34. Numerosity Reduction:
Reduce the volume of data
Parametric methods
Assume the data fits some model, estimate model parameters,
store only the parameters, and discard the data (except
possible outliers)
Non-parametric methods
Do not assume models
Major families: histograms, clustering, sampling
35. Clustering
Partitions data set into clusters, and models it by one
representative from each cluster
Can be very effective if data is clustered but not if data
is “smeared”
There are many choices of clustering definitions and
clustering algorithms, more later!
36. Sampling
Allow a mining algorithm to run in complexity that is
potentially sub-linear to the size of the data
Choose a representative subset of the data
Simple random sampling may have very poor performance in the
presence of skew
Develop adaptive sampling methods
Stratified sampling:
Approximate the percentage of each class (or subpopulation of
interest) in the overall database
Used in conjunction with skewed data
Sampling may not reduce database I/Os (page at a time).
38. Sampling
Raw Data Cluster/Stratified Sample
•The number of samples drawn from each
cluster/stratum is analogous to its size
•Thus, the samples represent better the data and
outliers are avoided