2
Stages of knowledgeextraction
Preprocessed
data
Raw data Target
data
Selectio
n
Knowledge
Transformed
data
Patterns
Machine learning
Interpretation
/
evaluation
Preprocessin
g
Transformatio
n
3.
3
KDD Process: ATypical View from ML and Statistics
Input Data Data
Mining
Data Pre-
Processing
Post-
Processing
• This is a view from typical machine learning and statistics communities
Data integration
Normalization
Feature selection
Dimension reduction
Pattern discovery
Association &
correlation
Classification
Clustering
Outlier analysis
… … … …
Pattern evaluation
Pattern selection
Pattern interpretation
Pattern visualization
4.
4
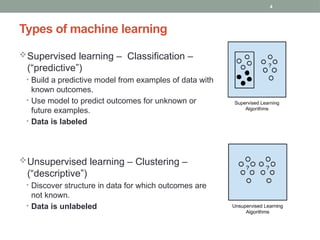
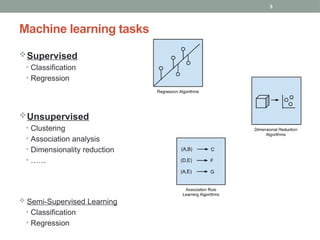
Types of machinelearning
Supervised learning – Classification –
(“predictive”)
• Build a predictive model from examples of data with
known outcomes.
• Use model to predict outcomes for unknown or
future examples.
• Data is labeled
Unsupervised learning – Clustering –
(“descriptive”)
• Discover structure in data for which outcomes are
not known.
• Data is unlabeled
7
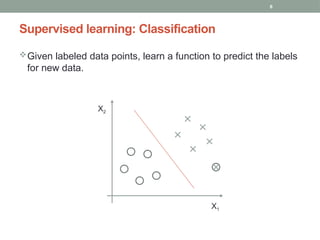
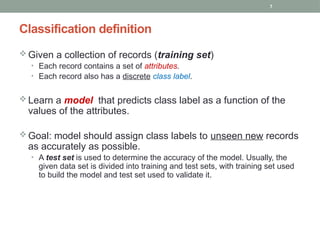
Classification definition
Givena collection of records (training set)
• Each record contains a set of attributes.
• Each record also has a discrete class label.
Learn a model that predicts class label as a function of the
values of the attributes.
Goal: model should assign class labels to unseen new records
as accurately as possible.
• A test set is used to determine the accuracy of the model. Usually, the
given data set is divided into training and test sets, with training set used
to build the model and test set used to validate it.
8.
8
Classification illustrated
Tid RefundMarital
Status
Taxable
Income Cheat
1 Yes Single 125K No
2 No Married 100K No
3 No Single 70K No
4 Yes Married 120K No
5 No Divorced 95K Yes
6 No Married 60K No
7 Yes Divorced 220K No
8 No Single 85K Yes
9 No Married 75K No
10 No Single 90K Yes
10
categorical
categorical
continuous
class
Refund Marital
Status
Taxable
Income Cheat
No Single 75K ?
Yes Married 50K ?
No Married 150K ?
Yes Divorced 90K ?
No Single 40K ?
No Married 80K ?
10
Test
set
Training
set
Model
Learn
classifier
Predicted
classes
9.
9
Classification application 1
Directmarketing
• Goal: Reduce cost of mailing by targeting a set of customers likely to buy
a new cell-phone product.
• Approach:
• Use the data for a similar product introduced before.
• We know which customers decided to buy and which decided otherwise. This {buy,
don’t buy} decision forms the class label.
• Collect various demographic, lifestyle, and company-interaction related information
about all such customers.
- Type of business, where they stay, how much they earn, etc.
• Use this information as input attributes to learn a classifier model.
10.
10
Sky surveycataloging
• Goal: To predict whether a sky object is a star or a galaxy (class),
especially visually faint ones, based on telescopic survey images from
Palomar Observatory.
• 3000 images with 23,040 x 23,040 pixels per image.
• Approach:
Segment the image.
Measure image attributes (features) - 40 of them per object.
Model the class based on these features.
Success story: Found 16 new high red-shift quasars – very distant objects, very
difficult to identify.
Classification application 2
From [Fayyad, et.al.] Advances in Knowledge Discovery and Data Mining, 1996
11.
11
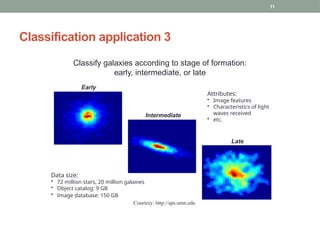
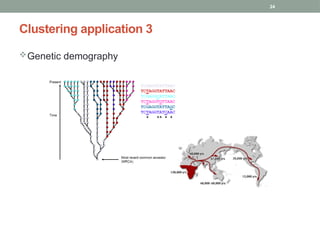
Classification application 3
Early
Intermediate
Late
Datasize:
• 72 million stars, 20 million galaxies
• Object catalog: 9 GB
• Image database: 150 GB
Attributes:
• Image features
• Characteristics of light
waves received
• etc.
Courtesy: http://aps.umn.edu
Classify galaxies according to stage of formation:
early, intermediate, or late
12.
12
C-Path: automated pathologic
gradingof breast cancer specimens
Started with 6642 high-level features
per image
Features characterized both malignant
epithelium and surrounding stroma
Algorithm simultaneously selected
small subset of features and learned to
discriminate 5-year survivors from non-
survivors
Final model: 11 features, 89%
accuracy on predicting 5-year survival
Science Translational Medicine, 3, 108ra113, 2011
Classification application 4
14
Regression definition
Given acollection of records (training set)
• Each record contains a set of attributes.
• Each record also has a continuous response variable.
Learn a model that predicts response variable as a function of
the values of the attributes.
• Model can be linear or nonlinear.
Goal: model should predict value of response variable on
unseen new records as accurately as possible.
• A test set is used to determine the accuracy of the model. Usually, the
given data set is divided into training and test sets, with training set used
to build the model and test set used to test its accuracy.
15.
15
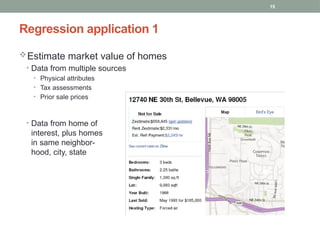
Estimate market valueof homes
• Data from multiple sources
• Physical attributes
• Tax assessments
• Prior sale prices
• Data from home of
interest, plus homes
in same neighbor-
hood, city, state
Regression application 1
16.
16
Predict voting patternsin
elections.
Predict sales volume
of new product based
on advertising
expenditure.
Predict weather patterns
as a function of
temperature, humidity,
air pressure, etc.
Time series
prediction of stock
market indices.
Regression applications 2
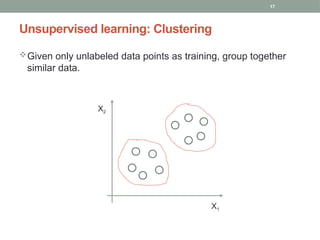
18
Given:
• Set ofdata points
• Set of attributes on each data point
• A measure of similarity between data points
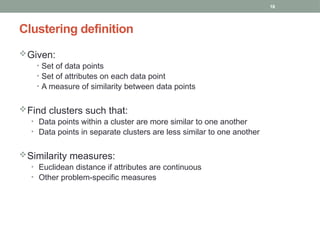
Find clusters such that:
• Data points within a cluster are more similar to one another
• Data points in separate clusters are less similar to one another
Similarity measures:
• Euclidean distance if attributes are continuous
• Other problem-specific measures
Clustering definition
19.
19
Partitional
• Data pointsdivided into finite number of partitions (non-overlapping subsets)
Hierarchical
• Data points arranged in tree structure that expresses a continuum of
similarities and clustering
Types of clustering
22
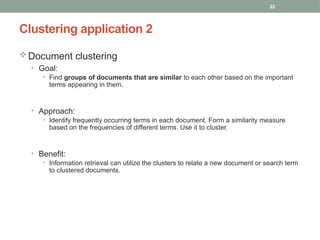
Document clustering
•Goal:
• Find groups of documents that are similar to each other based on the important
terms appearing in them.
• Approach:
• Identify frequently occurring terms in each document. Form a similarity measure
based on the frequencies of different terms. Use it to cluster.
• Benefit:
• Information retrieval can utilize the clusters to relate a new document or search term
to clustered documents.
Clustering application 2
23.
23
Items tocluster: 3204 articles of Los Angeles Times.
Similarity measure: Number of words in common
between a pair of documents (after some word filtering).
Document clustering example
Category Total
Articles
Correctly
Placed
Financial 555 364
Foreign 341 260
National 273 36
Metro 943 746
Sports 738 573
Entertainment 354 278
25
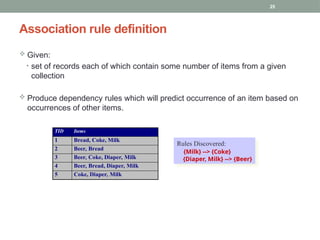
Given:
• setof records each of which contain some number of items from a given
collection
Produce dependency rules which will predict occurrence of an item based on
occurrences of other items.
Association rule definition
TID Items
1 Bread, Coke, Milk
2 Beer, Bread
3 Beer, Coke, Diaper, Milk
4 Beer, Bread, Diaper, Milk
5 Coke, Diaper, Milk
Rules Discovered:
{Milk} --> {Coke}
{Diaper, Milk} --> {Beer}
26.
26
Supermarket shelfmanagement
• Goal:
• Identify items that are bought together by sufficiently many customers.
• Approach:
• Process the point-of-sale data collected with barcode scanners to find dependencies
among items.
• A classic rule …
• If a customer buys diaper and milk, then he is very likely to buy beer.
• So don’t be surprised if you find six-packs stacked next to diapers!
Association rule application
27.
27
Challenges of machinelearning
Data often has poorly understood structure
• Best modeling approach rarely obvious at start
Heterogeneous data types
• e.g. combination of text, images, and numeric data
Frequent class imbalance
Noisy or corrupted data
Missing or incomplete data
High dimensionality
Scaling of algorithms to massive data sets
Streaming (real-time) data
29
Classification application
Customer attrition:
•Goal: To predict whether a customer is likely to be lost to a competitor.
• Approach:
• Use detailed record of transactions with each of the past and present customers, to
find attributes.
- How often the customer calls, where he calls, what time-of-the day he calls most,
his financial status, marital status, etc.
• Label the customers as loyal or disloyal.
• Find a model for loyalty.
30.
30
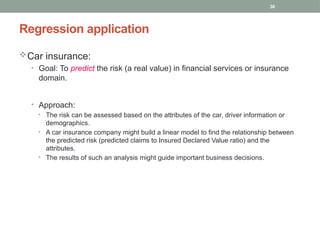
Regression application
Car insurance:
•Goal: To predict the risk (a real value) in financial services or insurance
domain.
• Approach:
• The risk can be assessed based on the attributes of the car, driver information or
demographics.
• A car insurance company might build a linear model to find the relationship between
the predicted risk (predicted claims to Insured Declared Value ratio) and the
attributes.
• The results of such an analysis might guide important business decisions.
31.
31
Clustering application
Marketsegmentation
• Goal:
• subdivide a market into distinct subsets of customers, such that each subset is
conceivably a submarket which can be reached with a customized marketing mix.
• Approach:
• Collect different attributes of customers based on their geographical and lifestyle
related information.
• Find clusters of similar customers.
• Measure the clustering quality by observing buying patterns of customers in same
cluster vs. those from different clusters.
32.
32
Review linear algebraand probability & statistics
• “Linear Algebra Review and Reference”, All, especially 3.12, 3.13
• “Probability Theory Review”, All, especially 3.4 – 2.6
• “stat-cookbook”, 1- 5
For this & coming week
#12 Example of ‘sparse’ learning: reduction in dimensionality of input while training model.
#16 Obama campaign in 2012 invested $100 million in data analytics. Several hundred staffers for 18 months plus lots of digital technology, new data gathering tools.


![10
Sky survey cataloging
• Goal: To predict whether a sky object is a star or a galaxy (class),
especially visually faint ones, based on telescopic survey images from
Palomar Observatory.
• 3000 images with 23,040 x 23,040 pixels per image.
• Approach:
Segment the image.
Measure image attributes (features) - 40 of them per object.
Model the class based on these features.
Success story: Found 16 new high red-shift quasars – very distant objects, very
difficult to identify.
Classification application 2
From [Fayyad, et.al.] Advances in Knowledge Discovery and Data Mining, 1996](https://image.slidesharecdn.com/2mldmintro-260106024345-851e880a/85/Intro-to-Machine-Learning-and-Data-Mining-10-320.jpg)