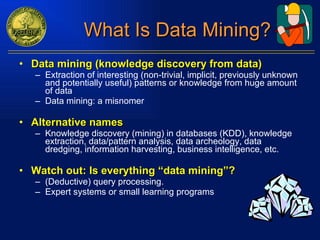
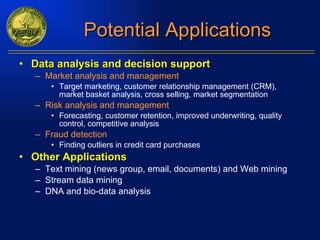
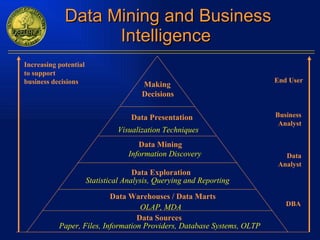
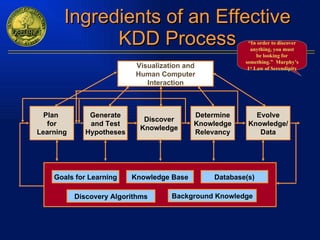
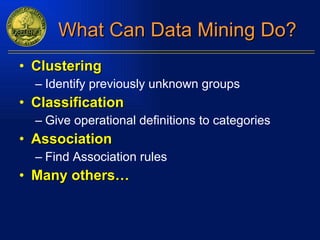
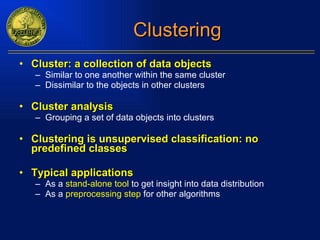
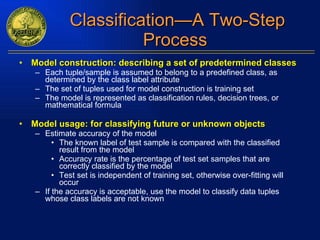
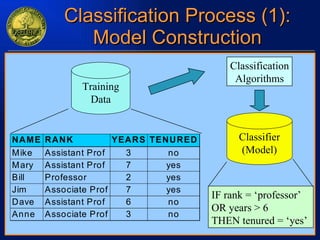
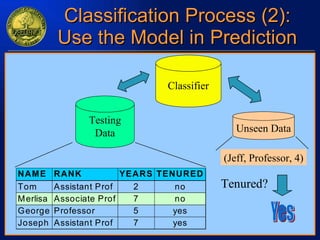
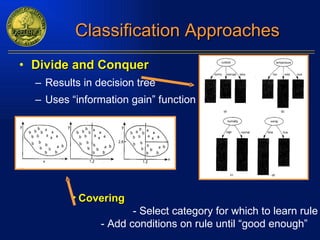
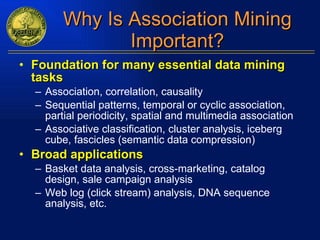
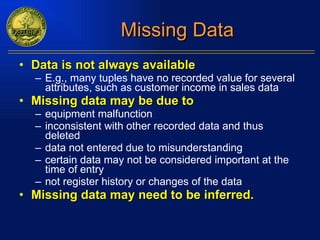
The document discusses data mining and knowledge discovery in databases. It defines data mining as extracting patterns from large amounts of data. The key steps in the knowledge discovery process are presented as data selection, preprocessing, data mining, and interpretation. Common data mining techniques include clustering, classification, and association rule mining. Clustering groups similar data objects, classification predicts categorical labels, and association rules find relationships between variables. Data mining has applications in many domains like market analysis, fraud detection, and bioinformatics.
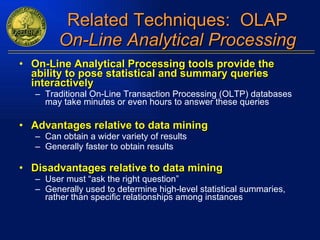
![Department of Computer Science University of Wisconsin – Eau Claire Eau Claire, WI 54701 [email_address] 715-836-2526 Introduction to Data Mining Michael R. Wick Professor and Chair](https://image.slidesharecdn.com/talk-110203063504-phpapp02/85/Talk-1-320.jpg)
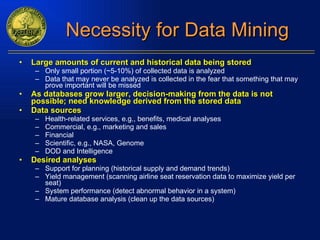
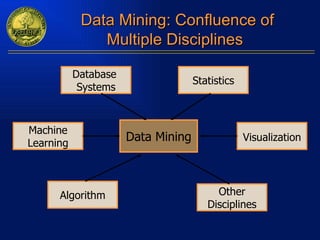

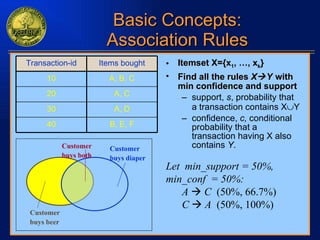
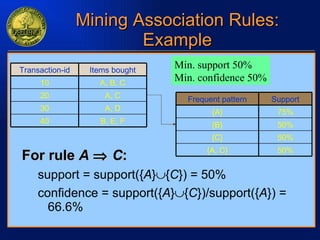
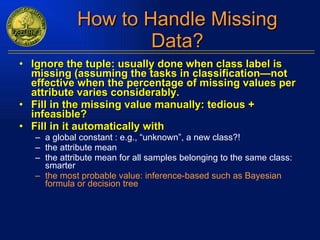
![Association Association rule mining: Finding frequent patterns, associations, correlations, or causal structures among sets of items or objects in transaction databases, relational databases, and other information repositories. Frequent pattern: pattern (set of items, sequence, etc.) that occurs frequently in a database [AIS93] Motivation: finding regularities in data What products were often purchased together? — Beer and diapers?! What are the subsequent purchases after buying a PC? What kinds of DNA are sensitive to this new drug? Can we automatically classify web documents?](https://image.slidesharecdn.com/talk-110203063504-phpapp02/85/Talk-25-320.jpg)
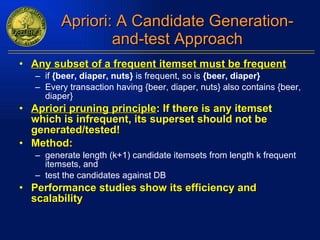
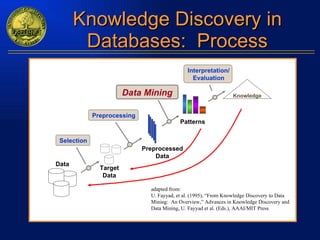
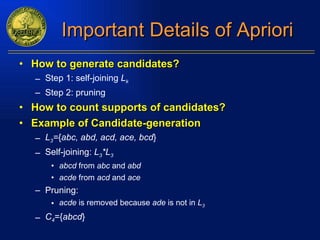
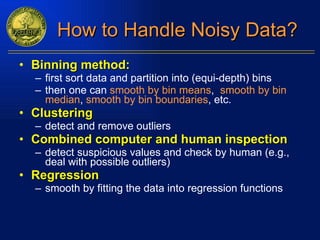
![The Apriori Algorithm—A Mathematical Definition Let I = {a,b,c,…} be a set of all items in the domain Let T = { S | S I } be a set of all transaction records of item sets Let support( S ) = { A | A T S A } | Let L 1 = { { a } | a I support({ a }) minSupport } k ( k > 1 L k -1 ) Let L k = { S i S j | ( S i L k -1 ) ( S j L k -1 ) ( | S i – S j | = 1 ) ( | S j – S i | = 1) ( S [ (( S S i S j ) (| S | = k -1)) S L k -1 ] ) ( support( S i S j ) minSupport ) Then, the set of all frequent item sets is given by L = L k and the set of all association rules is given by R = { A C | A (L k ) ( C = L k – A) ( A ) ( C ) support(L k ) / support( A ) minConfidence }](https://image.slidesharecdn.com/talk-110203063504-phpapp02/85/Talk-30-320.jpg)

![Thank you! Department of Computer Science University of Wisconsin – Eau Claire Eau Claire, WI 54701 [email_address] 715-836-2526 Michael R. Wick Professor and Chair](https://image.slidesharecdn.com/talk-110203063504-phpapp02/85/Talk-48-320.jpg)