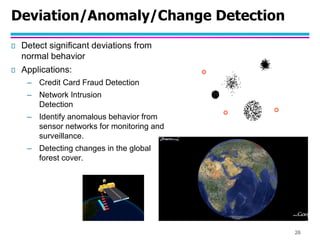
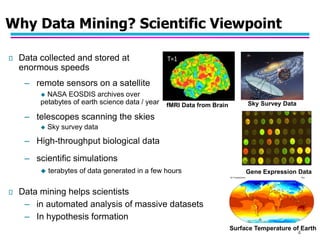
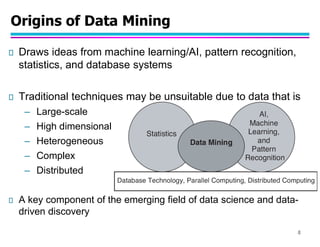
This document provides an introduction to data mining. It discusses the growth of large datasets in commercial and scientific domains. Data mining aims to extract useful knowledge from these large datasets. It can help improve productivity, solve societal problems, and assist scientists with data analysis. The document outlines common data mining tasks like classification, regression, clustering, association rule mining, and anomaly detection. Examples of applications are discussed for tasks like fraud detection, document clustering, and market basket analysis. Overall, the summary introduces the key concepts, goals, techniques and applications of data mining.
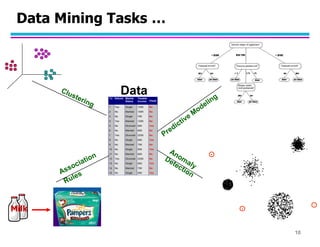
![Data Mining Tasks
Prediction Methods
– Use some variables to predict unknown or
future values of other variables.
Description Methods
– Find human-interpretable patterns that
describe the data.
From [Fayyad, et.al.] Advances in Knowledge Discovery and Data Mining, 1996
9](https://image.slidesharecdn.com/chapter1introduction-240219145402-5ddbe578/85/chapter1_Introduction-pdf-data-mining-ppt-9-320.jpg)
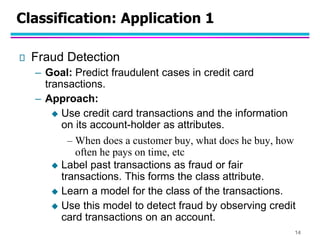
![Classification: Application 2
Churn prediction for telephone customers
– Goal: To predict whether a customer is likely
to be lost to a competitor.
– Approach:
Use detailed record of transactions with each of the
past and present customers, to find attributes.
– How often the customer calls, where he calls, what time-
of-the day he calls most, his financial status, marital
status, etc.
Label the customers as loyal or disloyal.
Find a model for loyalty.
From [Berry & Linoff] Data Mining Techniques, 1997
15](https://image.slidesharecdn.com/chapter1introduction-240219145402-5ddbe578/85/chapter1_Introduction-pdf-data-mining-ppt-15-320.jpg)
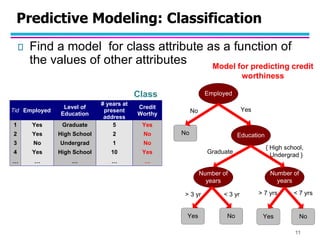
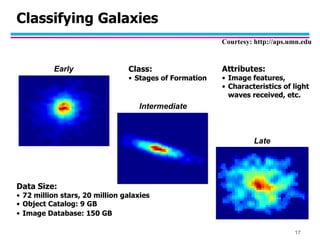
![Classification: Application 3
Sky Survey Cataloging
– Goal: To predict class (star or galaxy) of sky objects,
especially visually faint ones, based on the telescopic
survey images (from Palomar Observatory).
– 3000 images with 23,040 x 23,040 pixels per image.
– Approach:
Segment the image.
Measure image attributes (features) - 40 of them per
object.
Model the class based on these features.
Success Story: Could find 16 new high red-shift
quasars, some of the farthest objects that are difficult
to find! From [Fayyad, et.al.] Advances in Knowledge Discovery and Data Mining, 1996
16](https://image.slidesharecdn.com/chapter1introduction-240219145402-5ddbe578/85/chapter1_Introduction-pdf-data-mining-ppt-16-320.jpg)
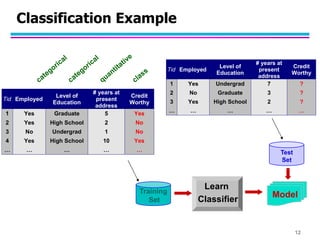
![ An Example Subspace Differential Coexpression Pattern
from lung cancer dataset
Enriched with the TNF/NFB signaling pathway
which is well-known to be related to lung cancer
P-value: 1.4*10-5 (6/10 overlap with the pathway)
[Fang et al PSB 2010]
Three lung cancer datasets [Bhattacharjee et a
2001], [Stearman et al. 2005], [Su et al. 2007]
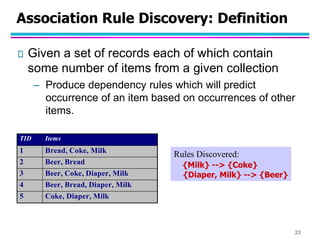
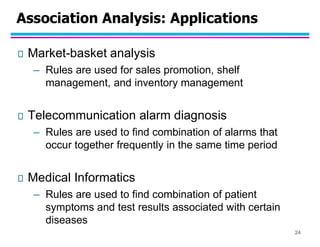
Association Analysis: Applications
25](https://image.slidesharecdn.com/chapter1introduction-240219145402-5ddbe578/85/chapter1_Introduction-pdf-data-mining-ppt-25-320.jpg)