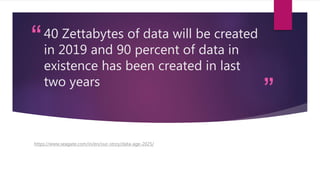
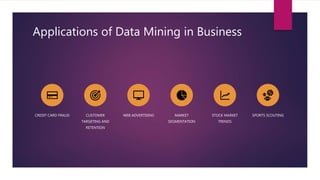
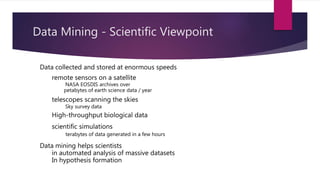
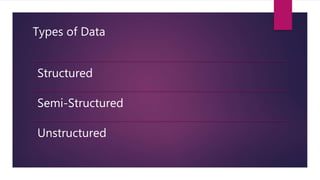
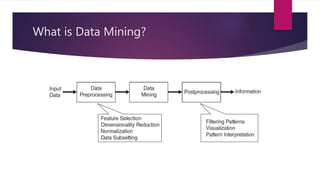
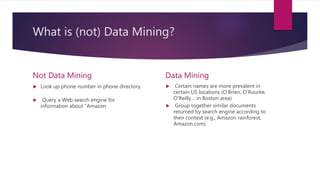
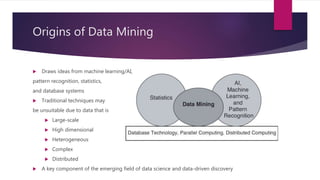
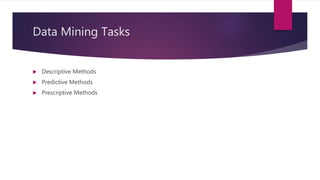
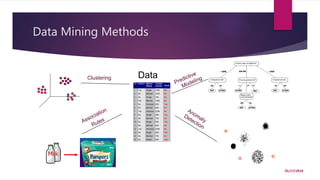
The document provides an introduction to data mining. It states that 40 zettabytes of data will be created in 2019 and 90% of existing data has been created in the last two years. It defines data, information, and knowledge and explains what data mining is and some of its applications. The document discusses different types of data and data analysis techniques like classification, clustering, regression, and association rule mining. It provides examples of how these techniques can be applied to problems in business, science, and other domains.
3. “
”
40 Zettabytes of data will be created
in 2019 and 90 percent of data in
existence has been created in last
two years
https://www.seagate.com/in/en/our-story/data-age-2025/
4. Data
Data is a set of facts,observations, measurements about objects, events or processes
of interest
• There has been enormous data growth in both commercial and scientific databases due to
advances in data generation and collection technologies
• New mantra
• Expectations
5. Information
When data is processed , organized or structured to present it in a certain context it is
called ‘Information’
7. What is Data Mining
Data mining is extracting of useful information from large databases.
It also goes by other names as KDD, pattern/data analysis, business intelligence etc.
8. Why Data
Mining
Data Growth in past few years
Average Fortune 500 company manages a
TB of data everyday
Competitive Edge , Remember Moneyball?
Future is of data based products
9. Applications of Data Mining in Business
CREDIT CARD FRAUD CUSTOMER
TARGETING AND
RETENTION
WEB ADVERTISING MARKET
SEGMENTATION
STOCK MARKET
TRENDS
SPORTS SCOUTING
10. Data collected and stored at enormous speeds
remote sensors on a satellite
NASA EOSDIS archives over
petabytes of earth science data / year
telescopes scanning the skies
Sky survey data
High-throughput biological data
scientific simulations
terabytes of data generated in a few hours
Data mining helps scientists
in automated analysis of massive datasets
In hypothesis formation
Data Mining - Scientific Viewpoint
14. What is (not) Data Mining?
Not Data Mining
Look up phone number in phone directory
Query a Web search engine for
information about “Amazon
Data Mining
Certain names are more prevalent in
certain US locations (O’Brien, O’Rourke,
O’Reilly… in Boston area)
Group together similar documents
returned by search engine according to
their context (e.g., Amazon rainforest,
Amazon.com)
15. Origins of Data Mining
Draws ideas from machine learning/AI,
pattern recognition, statistics,
and database systems
Traditional techniques may
be unsuitable due to data that is
Large-scale
High dimensional
Heterogeneous
Complex
Distributed
A key component of the emerging field of data science and data-driven discovery
17. Tid Refund Marital
Status
Taxable
Income Cheat
1 Yes Single 125K No
2 No Married 100K No
3 No Single 70K No
4 Yes Married 120K No
5 No Divorced 95K Yes
6 No Married 60K No
7 Yes Divorced 220K No
8 No Single 85K Yes
9 No Married 75K No
10 No Single 90K Yes
11 No Married 60K No
12 Yes Divorced 220K No
13 No Single 85K Yes
14 No Married 75K No
15 No Single 90K Yes
10
Clustering
Milk
Data
Data Mining Methods
01/17/2018
18. Predictive Analytics : Classification
Find a model for class attribute as a
function of the values of other attributes
Tid Employed
Level of
Education
# years at
present
address
Credit
Worthy
1 Yes Graduate 5 Yes
2 Yes High School 2 No
3 No Undergrad 1 No
4 Yes High School 10 Yes
… … … … …10
Model for predicting credit
worthiness
Class
Employed
No Education
Number of
years
No Yes
Graduate
{ High school,
Undergrad }
Yes No
> 7 yrs < 7 yrs
Yes
Number of
years
No
> 3 yr < 3 yr
19. Examples of Classification Task
Classifying credit card transactions
as legitimate or fraudulent
Classifying land covers (water bodies, urban areas, forests, etc.) using
satellite data
Categorizing news stories as finance,
weather, entertainment, sports, etc
Identifying intruders in the cyberspace
Predicting tumor cells as benign or malignant
Classifying secondary structures of protein
as alpha-helix, beta-sheet, or random coil
20. Classification: Application 1
Fraud Detection
Goal: Predict fraudulent cases in credit card transactions.
Approach:
Use credit card transactions and the information on its account-holder as attributes.
When does a customer buy, what does he buy, how often he pays on time, etc
Label past transactions as fraud or fair transactions. This forms the class attribute.
Learn a model for the class of the transactions.
Use this model to detect fraud by observing credit card transactions on an account.
21. Classification: Application 2
Churn prediction for telephone customers
Goal: To predict whether a customer is likely to be lost to a competitor.
Approach:
Use detailed record of transactions with each of the past and present customers, to find
attributes.
How often the customer calls, where he calls, what time-of-the day he calls most, his
financial status, marital status, etc.
Label the customers as loyal or disloyal.
Find a model for loyalty.
22. Classification: Application 3
Sky Survey Cataloging
Goal: To predict class (star or galaxy) of sky objects, especially visually faint ones, based
on the telescopic survey images (from Palomar Observatory).
3000 images with 23,040 x 23,040 pixels per image.
Approach:
Segment the image.
Measure image attributes (features) - 40 of them per object.
Model the class based on these features.
Success Story: Could find 16 new high red-shift quasars, some of the farthest objects that are
difficult to find!
23. Regression
Predict a value of a given continuous valued variable based on the values of other
variables, assuming a linear or nonlinear model of dependency.
Extensively studied in statistics, neural network fields.
Examples:
Predicting sales amounts of new product based on advetising expenditure.
Predicting wind velocities as a function of temperature, humidity, air pressure, etc.
Time series prediction of stock market indices.
01/17/2018
24. Clustering
Finding groups of objects such that the objects in a group will be similar (or
related) to one another and different from (or unrelated to) the objects in other
groups
Inter-cluster
distances are
maximizedIntra-cluster
distances are
minimized
25. Applications of Cluster Analysis
Understanding
Custom profiling for targeted marketing
Group related documents for browsing
Group genes and proteins that have similar
functionality
Group stocks with similar price fluctuations
Summarization
Reduce the size of large data sets
Clusters for Raw SST and Raw NPP
longitude
latitude
-180 -150 -120 -90 -60 -30 0 30 60 90 120 150 180
90
60
30
0
-30
-60
-90
Cluster
Sea Cluster 1
Sea Cluster 2
Ice or No NPP
Land Cluster 1
Land Cluster 2
Use of K-means to
partition Sea Surface
Temperature (SST) and
Net Primary Production
(NPP) into clusters that
reflect the Northern and
Southern Hemispheres.
26. Clustering: Application 1
Market Segmentation:
Goal: subdivide a market into distinct subsets of customers where any subset may conceivably be
selected as a market target to be reached with a distinct marketing mix.
Approach:
Collect different attributes of customers based on their geographical and lifestyle related
information.
Find clusters of similar customers.
Measure the clustering quality by observing buying patterns of customers in same cluster vs.
those from different clusters.
26
27. Clustering: Application 2
Document Clustering:
Goal: To find groups of documents that are similar to each other based on the important terms
appearing in them.
Approach: To identify frequently occurring terms in each document. Form a similarity measure based
on the frequencies of different terms. Use it to cluster.
Enron email dataset
28. Association Rule Discovery
Given a set of records each of which contain some number of items from a given collection
Produce dependency rules which will predict occurrence of an item based on
occurrences of other items.
TID Items
1 Bread, Coke, Milk
2 Beer, Bread
3 Beer, Coke, Diaper, Milk
4 Beer, Bread, Diaper, Milk
5 Coke, Diaper, Milk
Rules Discovered:
{Milk} --> {Coke}
{Diaper, Milk} --> {Beer}
29. Association Analysis: Applications
Market-basket analysis
• Rules are used for sales
promotion, shelf
management, and
inventory management
Telecommunication
alarm diagnosis
• Rules are used to find
combination of alarms
that occur together
frequently in the same
time period
Medical Informatics
• Rules are used to find
combination of patient
symptoms and test
results associated with
certain diseases
30. Deviation/Anomaly/Change Detection
Detect significant deviations from normal
behavior
Applications:
Credit Card Fraud Detection
Network Intrusion
Detection
Identify anomalous behavior from sensor
networks for monitoring and surveillance.
Detecting changes in the global forest
cover.
31. Making Sense of Data in Business
Online Analytical Processing (OLAP) based Reporting & Query Tools
”Find all credit card customers who live in Midwest , drive a luxury car , and hold a
balance payment of $500 or more”
32. Making Sense of Data in Business
Data Mining Tools
To extract the ‘not so obvious’ information , for example “ find all
customers who are likely to switch their telecommunication services.
34. Data Mining Process
Understanding the Domain
Getting All The Data
Data cleaning & preprocessing
Discovery Model?
Interpreting Data
Value of Mined Information
Reporting and transforming to new actions and products
35. Motivating Challenges
Scalability
High Dimensionality
Heterogeneous and Complex Data
Data Ownership and Distribution
Non-traditional Analysis
Gather whatever data you can whenever and wherever possible.
Gathered data will have value either for the purpose collected or for a purpose not envisioned.
Use some variables to predict unknown or future values of other variables.
Find human-interpretable patterns that describe the data.
which use optimization and simulation algorithms to advice on possible outcomes and answer: “What should we do?”
Also Called Techninques
Sequential Modelling
From Berry & Linoff] Data Mining Techniques, 1997[
From [Fayyad, et.al.] Advances in Knowledge Discovery and Data Mining, 1996