Downloaded 76 times
![REASONING AND QUANTITATIVE APTITUDE DATA INTERPRETATION
18
C.Z only D.X and
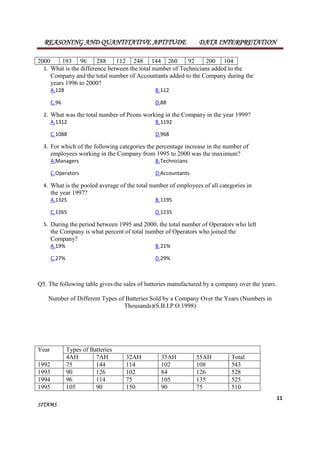
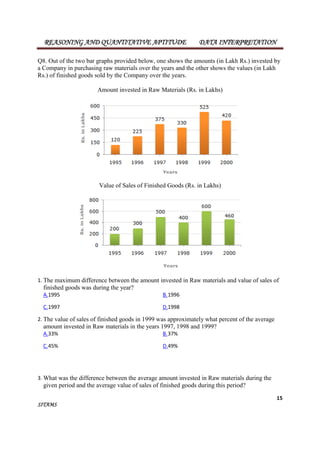
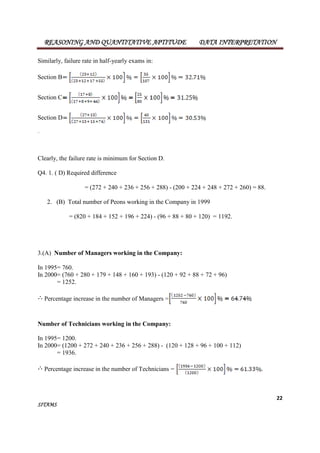
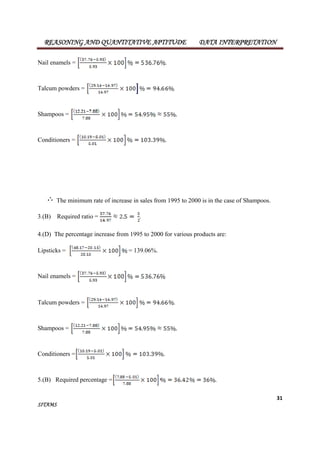
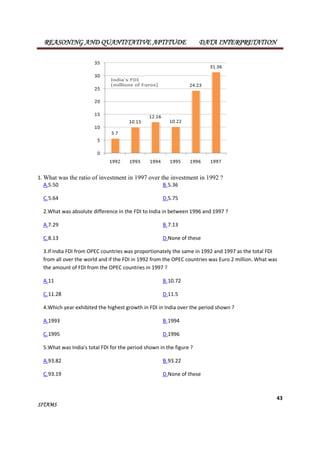
3.What is the difference between the average production of flavour X in 1995, 1996 and 1997
and the average production of flavour Y in 1998, 1999 and 2000?
A.50,000 bottles B.80,000 bottles
C.2,40,000 bottles D.5,00,000 bottles
4.What was the approximate decline in the production of flavour Z in 2000 as compared to the
production in 1998?
A.50% B.42%
C.33% D.25%
5. For which of the following years the percentage of rise/fall in production from the previous
year is the maximum for the flavour Y?
A.1996 B.1997
C.1998 D.1999
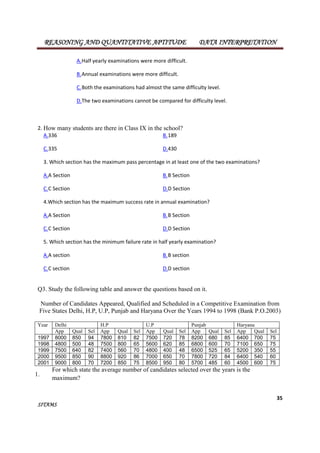
SOLUTIONS: Q1.
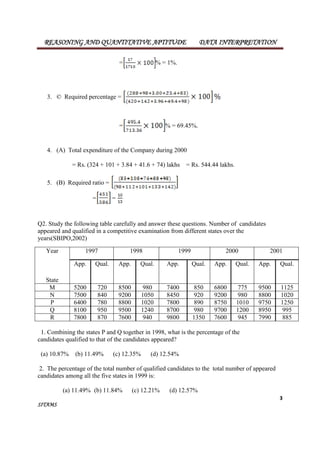
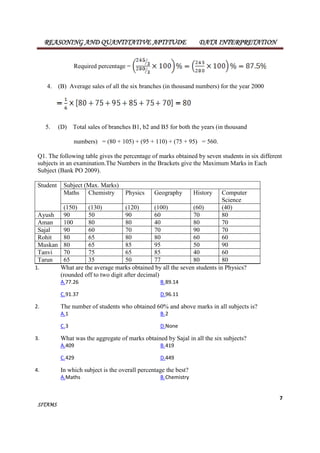
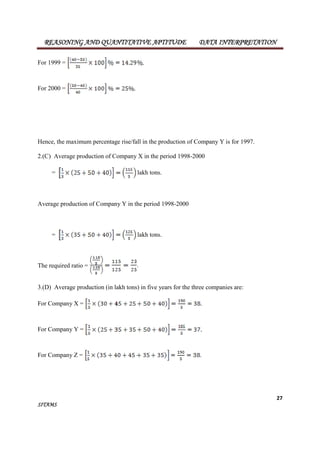
1. (B) Average marks obtained in Physics by all the seven students
SITAMS
x [ (90% of 120) + (80% of 120) + (70% of 120) + (80% of 120) + (85% of 120) +
(65% of 120) + (50% of 120) ] x [ (90 + 80 + 70 + 80 + 85 + 65 + 50)% of 120
x [ 520% of 120 ] = 89.14.
2. (B) From the table it is clear that Sajal and Rohit have 60% or more marks in each of the
six subjects.
3. (D) Aggregate marks obtained by Saja = [ (90% of 150) + (60% of 130) + (70% of 120)
+ (70% of 100) + (90% of 60) + (70% of 40) ] = [ 135 + 78 + 84 + 70 + 54 + 28 ] = 449.
4. (A) We shall find the overall percentage (for all the seven students) with respect to each
subject.The overall percentage for any subject is equal to the average of percentages
obtained by all the seven students since the maximum marks for any subject is the same for
all the students.
Therefore, overall percentage for:](https://image.slidesharecdn.com/datainterpretationtabulationandbargraph-141130082848-conversion-gate01/85/Datainterpretation-tabulation-and-bar-graph-18-320.jpg)
![REASONING AND QUANTITATIVE APTITUDE DATA INTERPRETATION
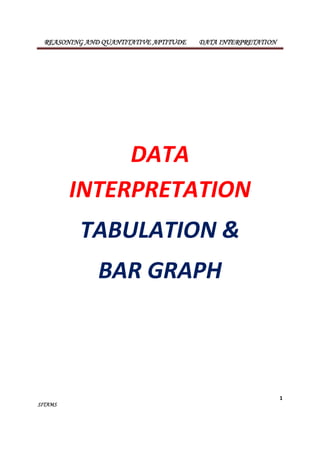
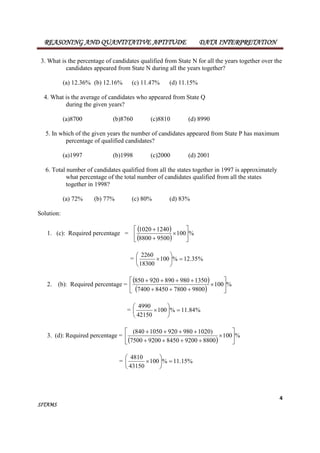
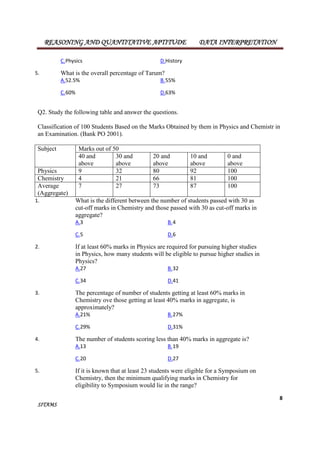
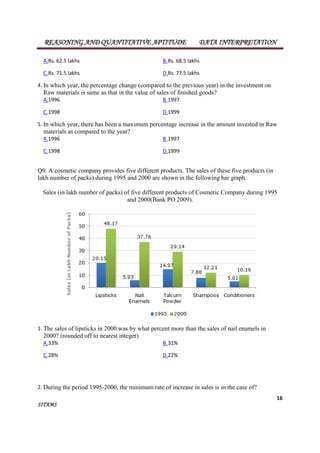
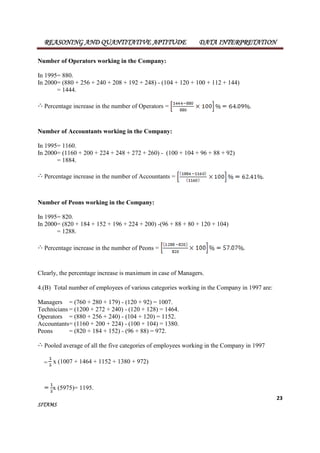
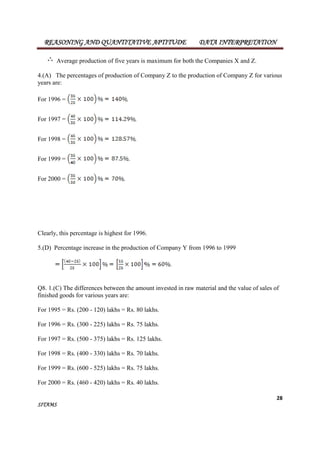
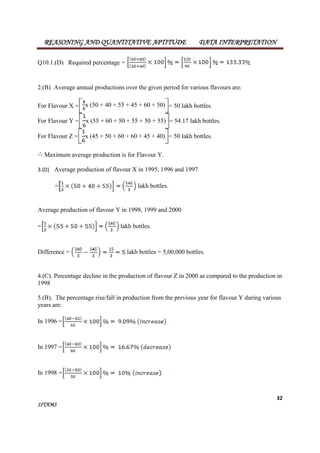
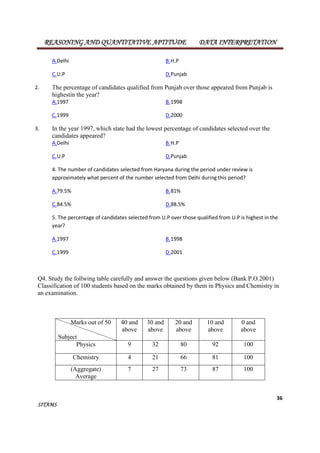
5. (C) Aggregate marks obtained by Tarun = [ (65% of 150) + (35% of 130) + (50% of 120)
19
Maths = 82.14%
+ ((77% of 100) + (80% of 60) + (80% of 40) ] = [ 97.5 + 45.5 + 60 + 77 + 48 + 32 ]
SITAMS
= 360.
The maximum marks (of all the six subjects) = (150 + 130 + 120 + 100 + 60 + 40) = 600.
Therefore Overall percentage of Tarun
Q2. 1.(D)
Required difference = (No. of students scoring 30 and above marks in Chemistry) - (Number of
students scoring 30 and above marks in aggregate) = 27 - 21 = 6.
2.(B) We have 60% of 50 =30.
Required number = No. of students scoring 30 and above marks in Physics = 32
3.(C) Number of students getting at least 60% marks in Chemistry = Number of students getting
30 and above marks in Chemistry = 21.
Number of students getting at least 40% marks in aggregate = Number of students getting 20 and
above marks in aggregate = 73.
Required percentage =
4.(D) We have 40% of 50% =
Required number = Number of students scoring less than 20 marks in aggregate
= 100 - Number of students scoring 20 and above marks in aggregate
= 100 - 73 = 27.](https://image.slidesharecdn.com/datainterpretationtabulationandbargraph-141130082848-conversion-gate01/85/Datainterpretation-tabulation-and-bar-graph-19-320.jpg)
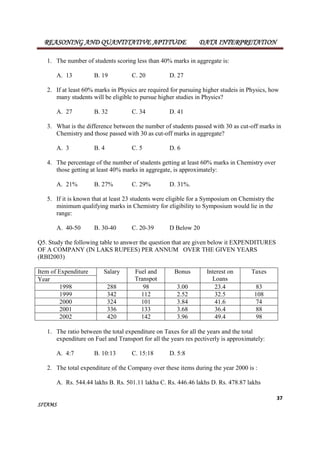
![REASONING AND QUANTITATIVE APTITUDE DATA INTERPRETATION
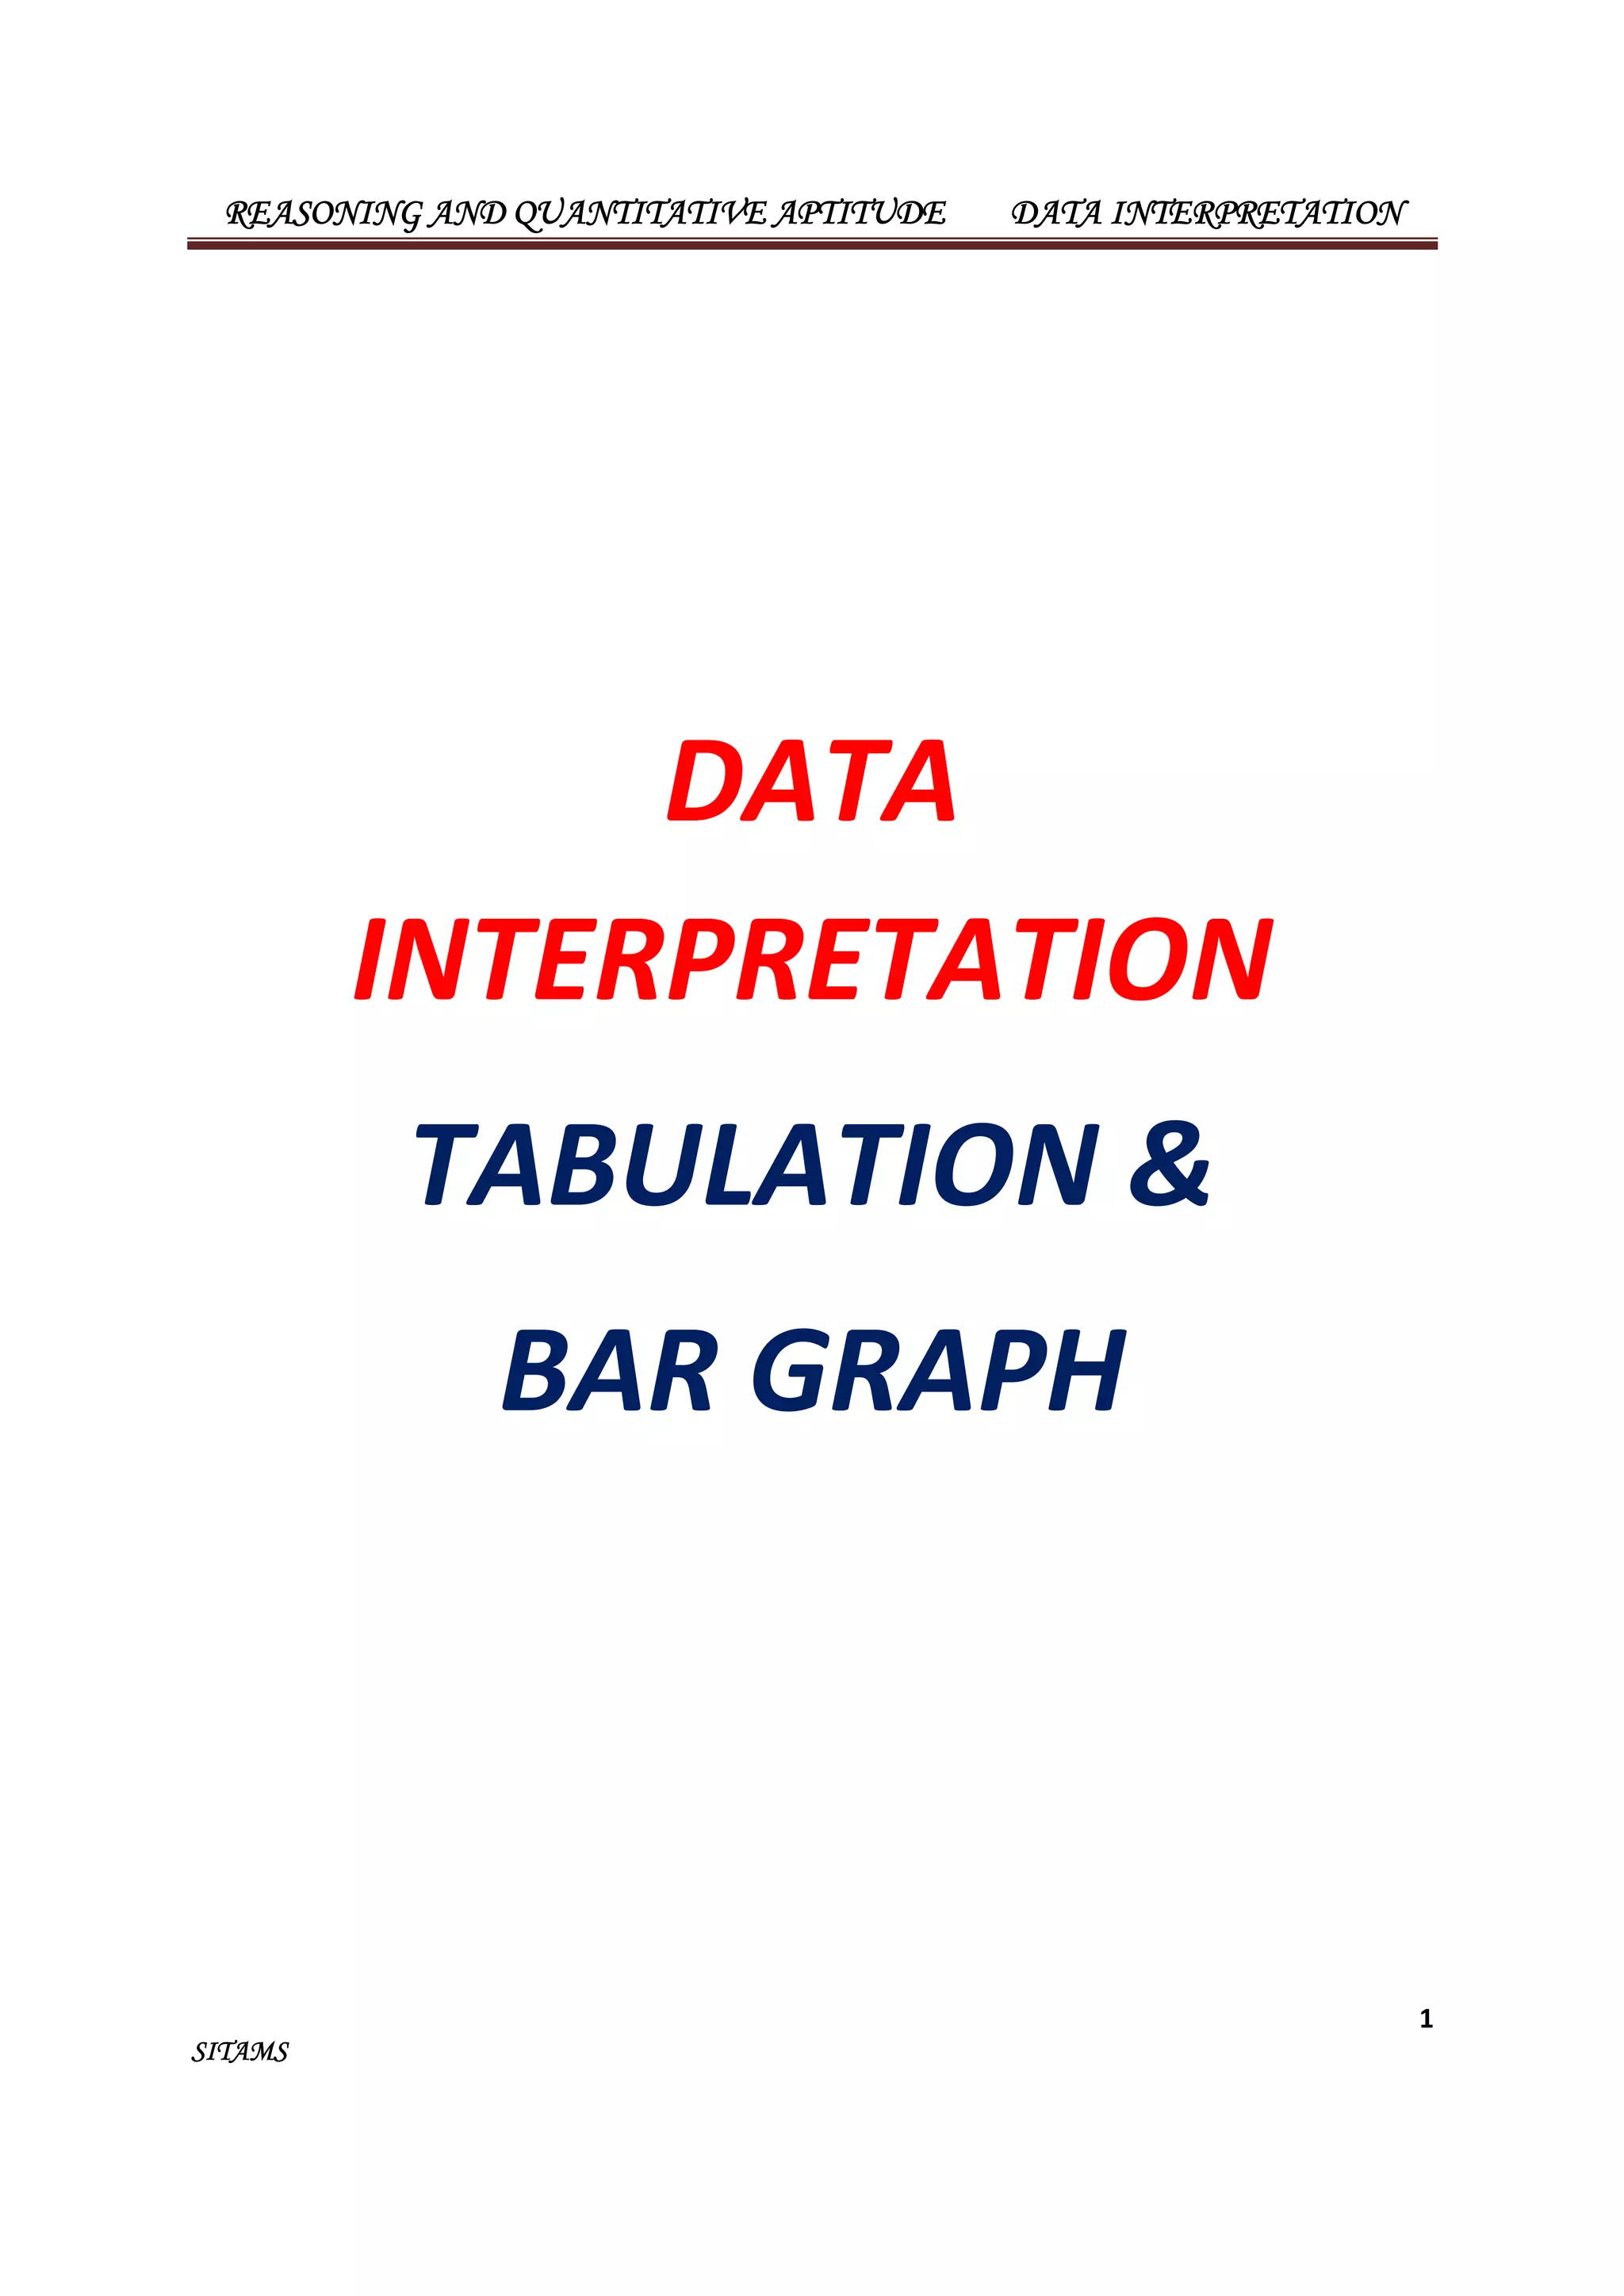
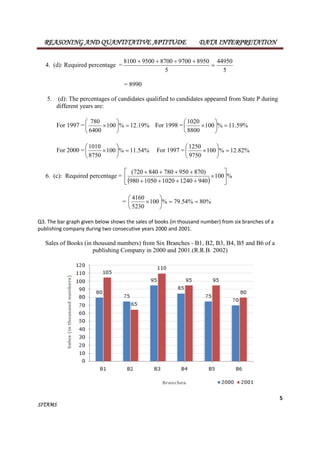
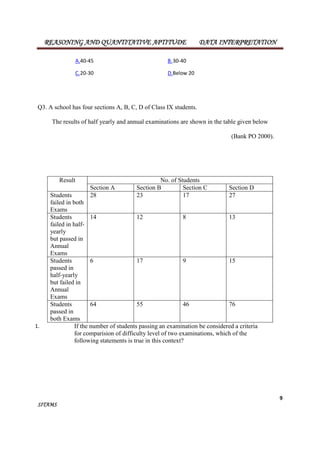
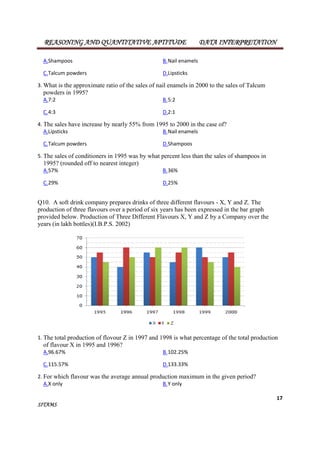
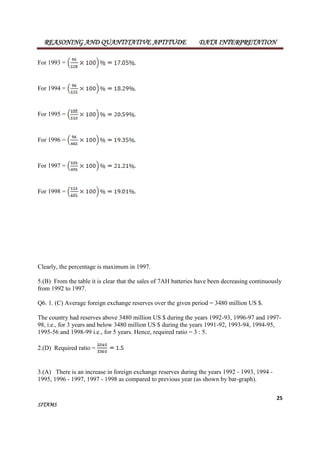
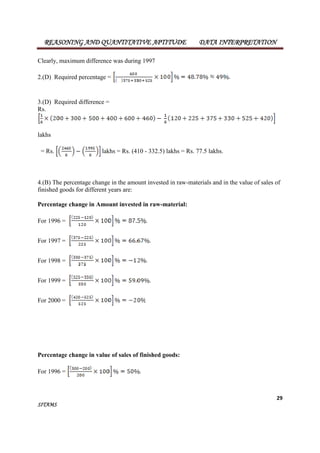
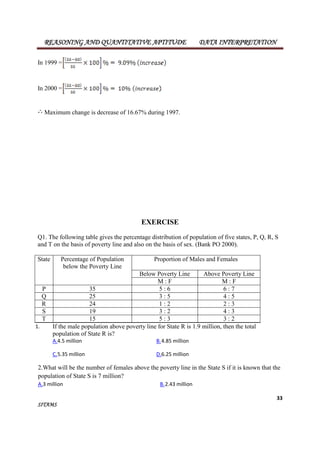
4.(A) Total number of students passed in annual exams in a section= [ (No. of students failed in
half-yearly but passed in annual exams) + (No. of students passed in both exams)] in that section
21
For Section D
Clearly, the pass percentage is maximum for Section D.
SITAMS
Success rate in annual exams in Section A
= 69.64%.
Similarly, success rate in annual exams in:
Section B
Section C
Section D
5.(D) Total number of failures in half-yearly exams in a section = [ (Number of students failed in
both exams) + (Number of students failed in half-yearly but passed in Annual exams)] in that
section
Failure rate in half-yearly exams in Section A](https://image.slidesharecdn.com/datainterpretationtabulationandbargraph-141130082848-conversion-gate01/85/Datainterpretation-tabulation-and-bar-graph-21-320.jpg)
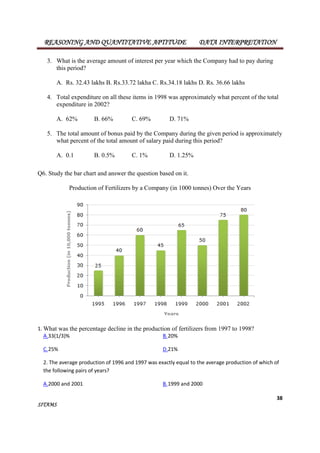
![REASONING AND QUANTITATIVE APTITUDE DATA INTERPRETATION
24
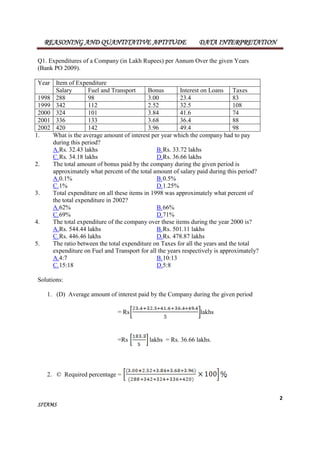
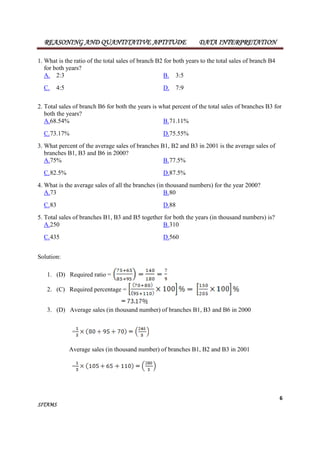
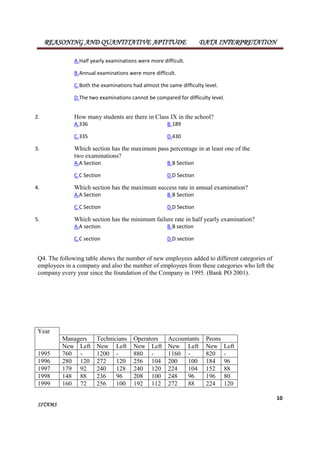
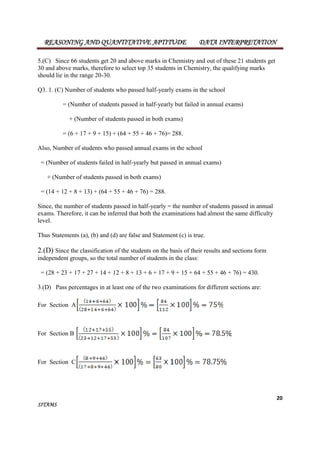
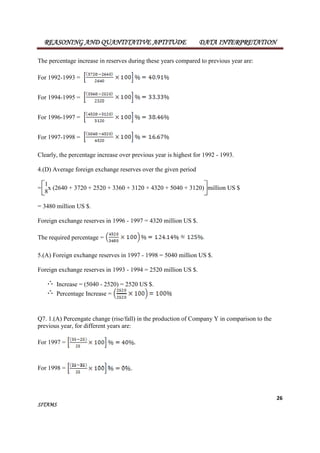
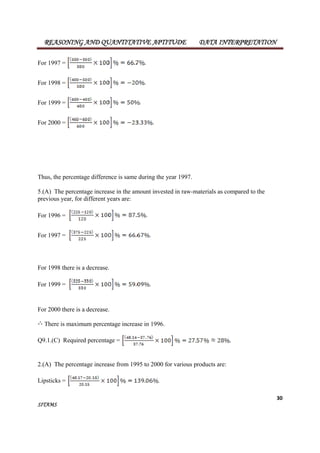
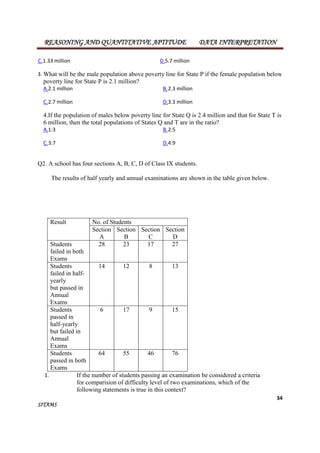
5.(D) Total number of Operators who left the Company during 1995 - 2000
= (104 + 120 + 100 + 112 + 144) = 580.
Total number of Operators who joined the Company during 1995 - 2000
= (880 + 256 + 240 + 208 + 192 + 248) = 2024.
SITAMS
Required Percentage = .
Q5. 1.(D) Required percentage
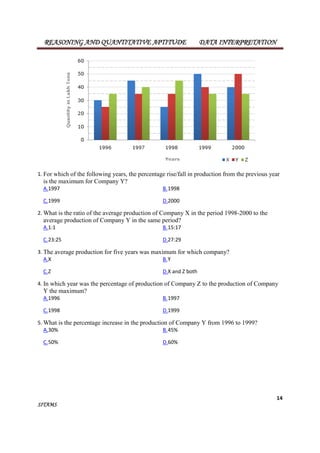
2.(C) The total sales (in thousands) of all the seven years for various batteries are:
For 4AH = 75 + 90 + 96 + 105 + 90 + 105 + 115 = 676
For 7AH = 144 + 126 + 114 + 90 + 75 + 60 + 85 = 694
For 32AH = 114 + 102 + 75 + 150 + 135 + 165 + 160 = 901
For 35AH = 102 + 84 + 105 + 90 + 75 + 45 + 100 = 601
For 55AH = 108 + 126 + 135 + 75 + 90 + 120 + 145 = 799.
Clearly, sales are maximum in case of 32AH batteries.
3.(D) Required difference = [(84 - 45) x 1000] = 39000.
4.(D) The percentages of sales of 4AH batteries to the total sales in different years are:
For 1992 =](https://image.slidesharecdn.com/datainterpretationtabulationandbargraph-141130082848-conversion-gate01/85/Datainterpretation-tabulation-and-bar-graph-24-320.jpg)

The document contains a series of quantitative aptitude questions related to various topics such as data interpretation, bar graphs, and candidates' performance in examinations across different variables. It provides expenditure data of a company, the performance of students in competitive exams, and sales data from a publishing company, among other statistics. Solutions and options for each question are also provided, enabling readers to practice their reasoning and analytical skills.