Downloaded 71 times
![eG
K
2. What are the average marks obtained by the student in all the periodical exams of
during the session.
(a) 373
(b) 379
(c) 381
(d) 385
(e) 389
3. what is the percentage of marks obtained by the student in the periodical exams of
Aug. 01 and Oct. 01 taken together?
(a) 73.25% (b) 75.5%
(c) 77% (d) 78.75% (e) 79.5%
4. In which periodical exams there is a fall in percentage of marks as compared to the
previous periodical exams?
(a) None
(b) Jun. 01
(c) Oct. 01 (d) Feb. 01 (e) None of these
5. In which periodical exams did the student obtain the highest percentage increase in
marks over the previous periodical exams?
(a) Jun. 01 (b) Aug. 01 (c) Oct. 01 (d) Dec. 01 (e) Feb. 02
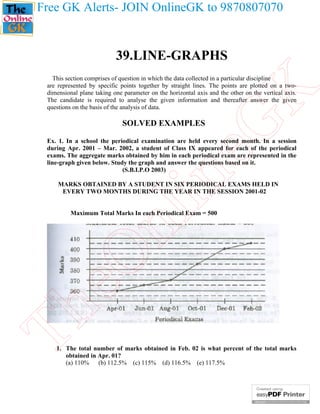
Sol. Here it is clear from the graph that the student obtained 360, 365, 370, 385, 400 and 405
marks in periodical exams held in Apr. 01, Jun. 01, Aug. 01, Oct. 01, Dec. 01 and Feb. 02
respectively.
eO
nl
in
1. (b) : Required percentage = [(405/360)*100] % = 112.5 %
2. (c) : Average marks obtained in all the periodical exams.
= (1/6)*[360+370+385+400+404] = 380.83 381.
3. (d) : Required percentage = [(370+385)/(500+500) * 100] % = [(755/1000)*100]% =75.5%
4. (a) : As is clear from graph, the total marks obtained in periodical exams, go on increasing.
Since, the maximum marks for all the periodical exams are same , it implies that the
percentage of marks also goes on increasing. Thus, in none of the periodical exams, there is
a fall in percentage of marks compared to the previous exam.
5. (c) : Percentage increases in marks in various periodical exams compared to the previous
exams are:
For Jun. 01 = [(365-360)/360 * 100 ] % = 1.39 %
For Aug. 01 = [(370-365)/365 * 100 ] % = 1.37 %
For Oct. 01 = [(385-370)/370 * 100 ] % = 4.05%
For Dec. 01 = [(400-385)/385 * 100 ] % = 3.90 %
For Feb. 02 = [(405-400)/400 * 100 ] % = 1.25 %
Th
Ex. 2. The following line- graph the ratio of the amounts of imports by a Company to the
amount of exports from that Company over the period from 1995 to 2001. The questions
given below are based on this graph.
(S.B.I.P.O 2001)
Ratio of value of Import to Export by a Company over the Years](https://image.slidesharecdn.com/38-131220001756-phpapp02/85/38-line-graphs-2-320.jpg)


![respectively and those of Company Y are 139000,120000,100000,128000,107000 and 148000
respectively.
eG
K
1. (c) : Total production of Company X from 1997 to 2002
= 119000+99000+141000+78000+120000+159000 = 716000
and total production of Company Y from 1997 to 2002
=139000+120000+100000+128000+107000+148000=742000
Difference=742000-716000=26000.
2. (d) : Require difference = 128000-107000 = 21000.
3. (a) : Average number of vehicles manufactured by Company X
= (91/6)* (119000 + 99000 + 141000 + 78000 + 120000 + 159000) = 119333.
nl
in
4. (d) : The difference between the production of Companies X and Y in various years are.
For 1997 = (139000 – 119000) = 20000;
For 1998 = (120000 – 99000) = 21000;
For 1999 = (141000 – 100000) = 41000;
For 2000 = (128000 – 78000) = 50000;
For 2001 = (120000 – 107000) = 13000;
For 2003 = (159000 – 148000) = 11000;
Clearly, maximum difference was in 2000.
5. (b) : Required percentage = [( 128000/78000)* 100] % = 164 %.
eO
Ex. 4. The following line-graph gives the percent profit earned by two Companies X and Y
during the period 1996 – 2001. Study the line – graph and answer the questions that are
based on on it.
Th
Percentage Profit Earned by Two Companies X and Y over the Given years
% profit/ loss = [(Income – Expenditure) / Expenditure] * 100](https://image.slidesharecdn.com/38-131220001756-phpapp02/85/38-line-graphs-6-320.jpg)


The document provides examples of line graph questions and their solutions. It includes 4 sample line graphs showing marks obtained by a student over time, the ratio of imports to exports for a company over years, vehicle production by two companies over years, and profit percentages for two companies over years. For each graph, 5 multiple choice questions are provided along with step-by-step solutions. The questions test the ability to analyze trends in the data presented by the line graphs and draw inferences to calculate values.