More Related Content


![ECDL module 5: using databases [To be continued]](https://cdn.slidesharecdn.com/ss_thumbnails/icdlmodule5usingdatabases-150417150536-conversion-gate02-thumbnail.jpg?width=640&height=640&fit=bounds)


![Getting Started with Apache Spark: Big Data Made Simple [Free Meetup]](https://cdn.slidesharecdn.com/ss_thumbnails/apachesparkgettingstarted-260203175547-8361bcc3-thumbnail.jpg?width=640&height=640&fit=bounds)


database_qrg_back.ppt
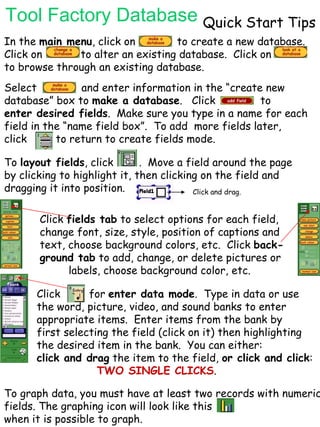
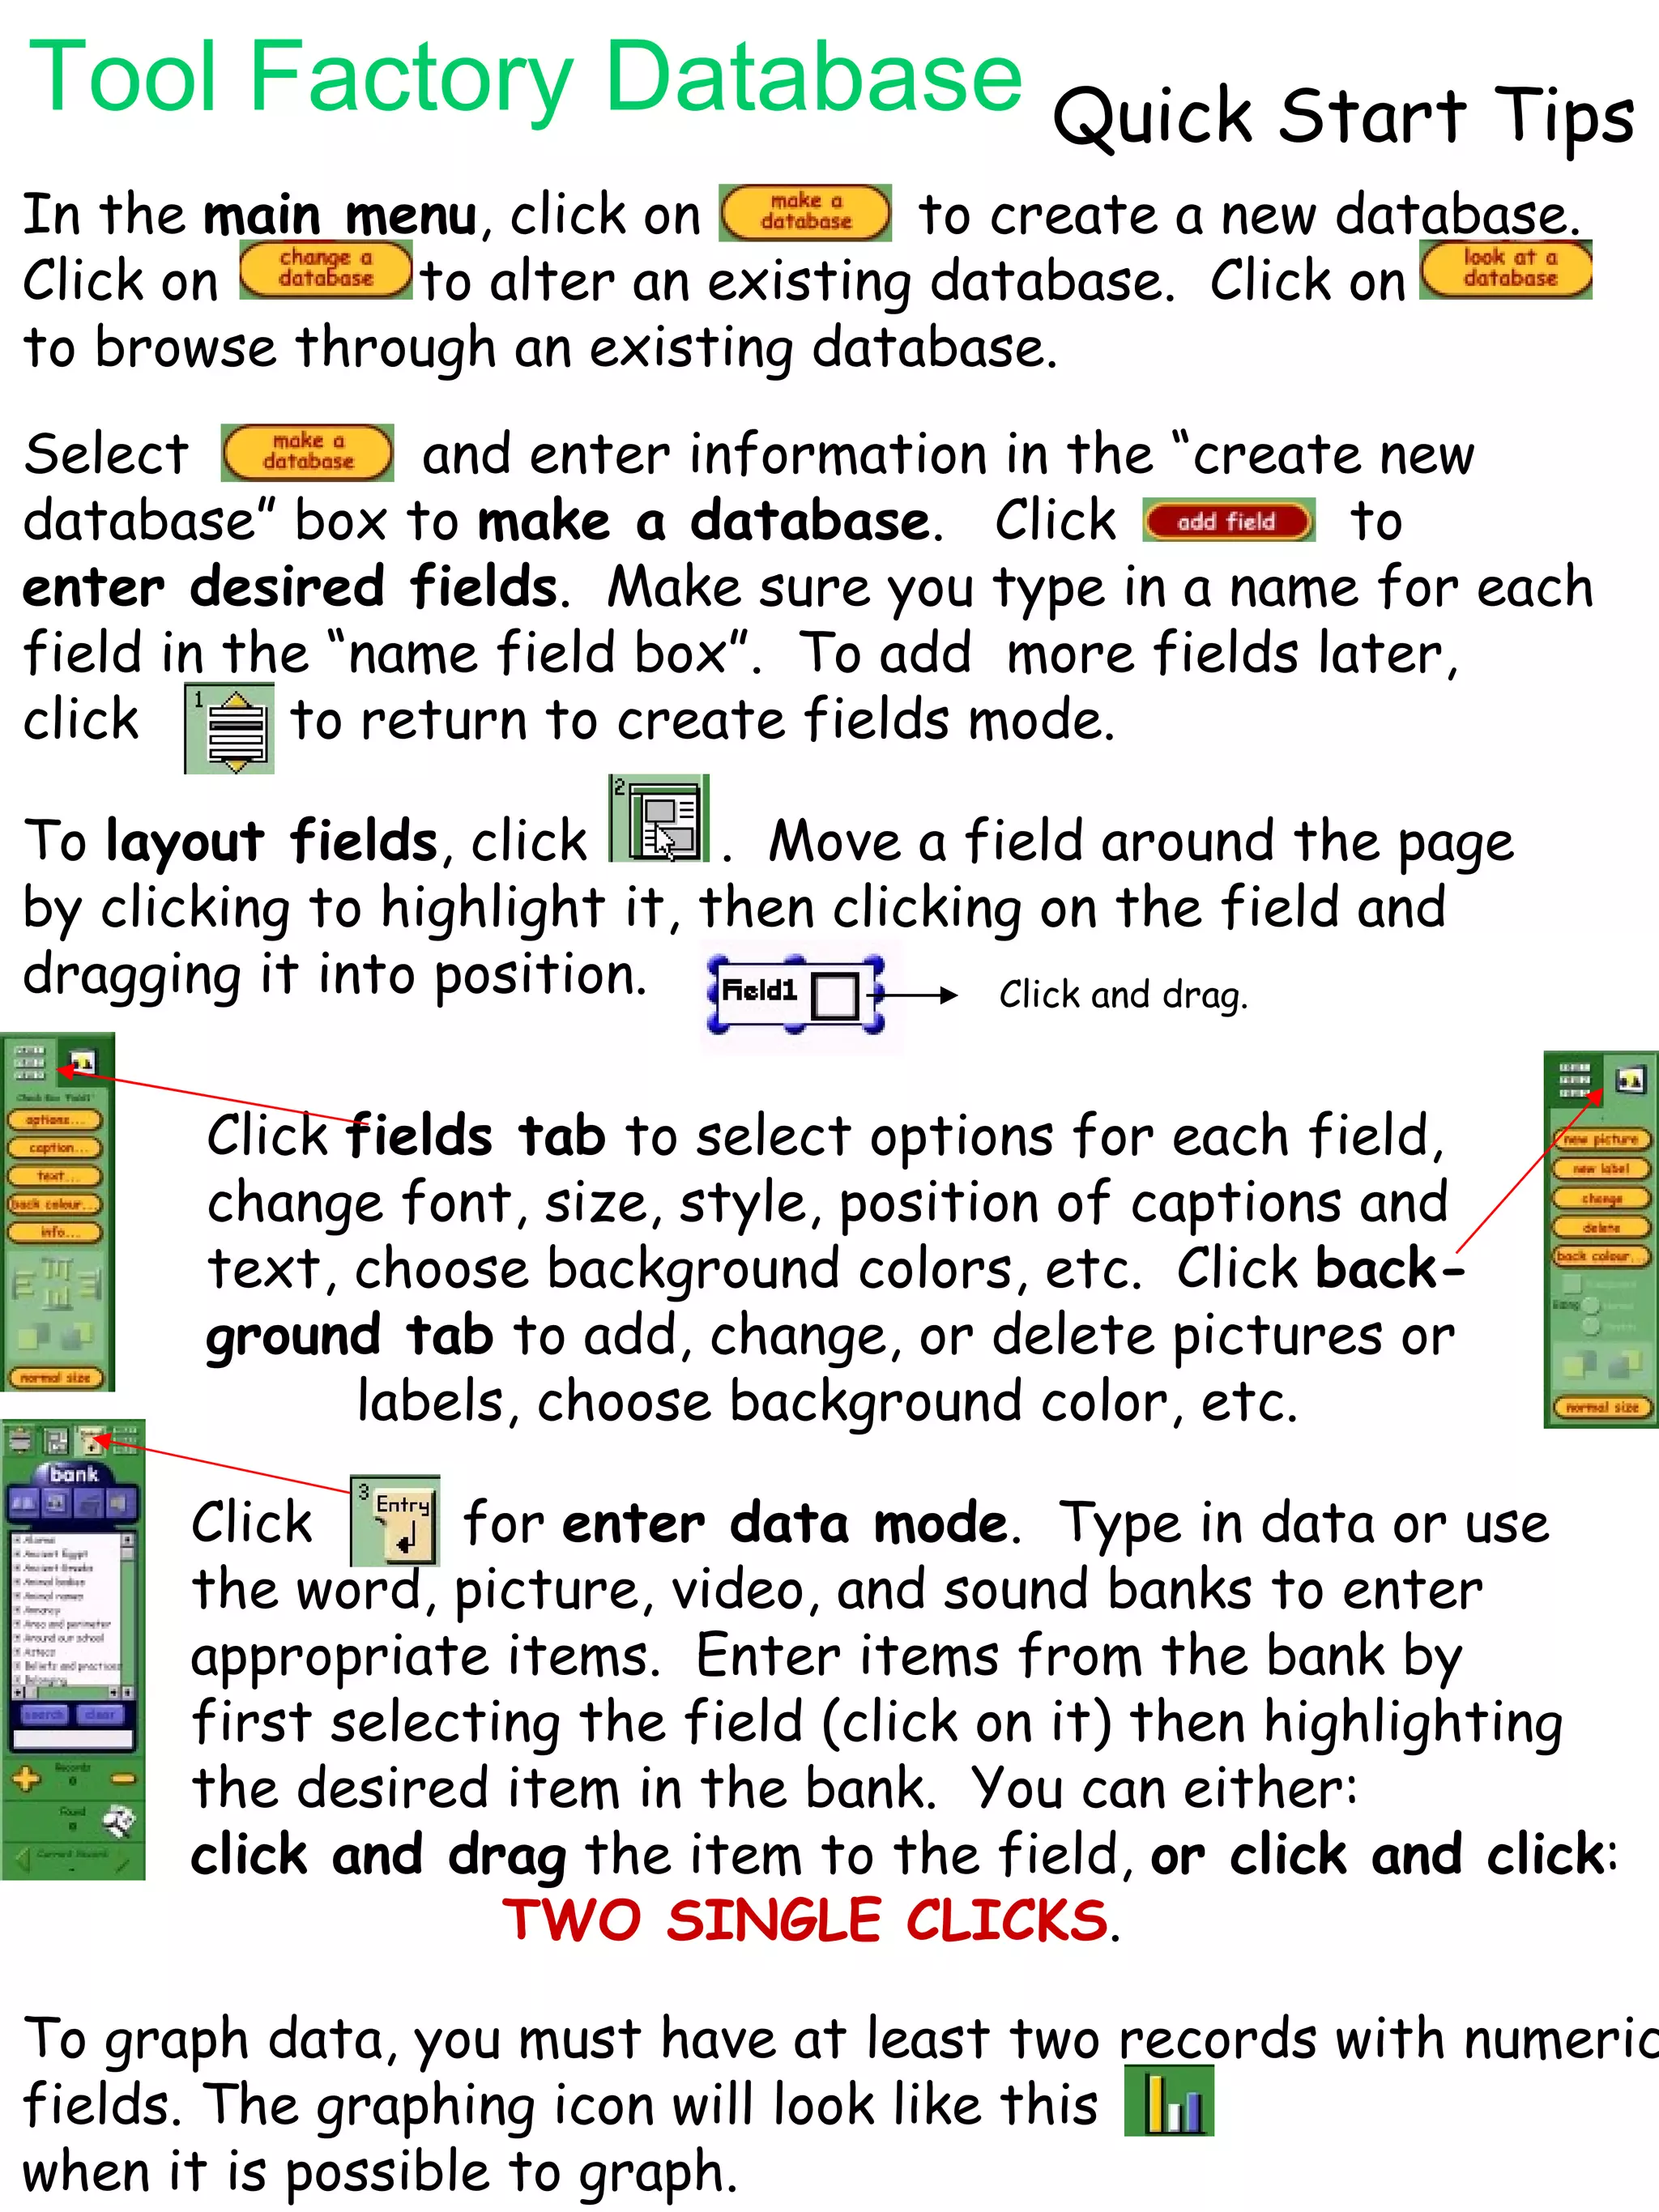
- 1. Tool Factory DatabaseQuick Start Tips In the main menu , click on to create a new database. Click on to alter an existing database. Click on to browse through an existing database. Select and enter information in the “create new database” box to make a database . Click to enter desired fields . Make sure you type in a name for each field in the “name field box”. To add more fields later, click to return to create fields mode. To layout fields , click . Move a field around the page by clicking to highlight it, then clicking on the field and dragging it into position. Click and drag. Click fields tab to select options for each field, change font, size, style, position of captions and text, choose background colors, etc. Click back- ground tab to add, change, or delete pictures or labels, choose background color, etc. Click for enter data mode . Type in data or use the word, picture, video, and sound banks to enter appropriate items. Enter items from the bank by first selecting the field (click on it) then highlighting the desired item in the bank. You can either: click and drag the item to the field, or click and click : TWO SINGLE CLICKS . To graph data, you must have at least two records with numeric fields. The graphing icon will look like this when it is possible to graph.