this presentation covers the following:
* Data warehouse-design strategies
* Data warehouse-modeling techniques
* the points of attention when building ETL-procedures for one of these Data warehouse-modeling techniques
this presentation covers the following:
* Data warehouse-design strategies
* Data warehouse-modeling techniques
* the points of attention when building ETL-procedures for one of these Data warehouse-modeling techniques
This is my presentation at SQLBits 8, Brighton, 9th April 2011. This session is about advanced dimensional modelling topics such as Fact Table Primary Key, Vertical Fact Tables, Aggregate Fact Tables, SCD Type 6, Snapshotting Transaction Fact Tables, 1 or 2 Dimensions, Dealing with Currency Rates, When to Snowflake, Dimensions with Multi Valued Attributes, Transaction-Level Dimensions, Very Large Dimensions, A Dimension With Only 1 Attribute, Rapidly Changing Dimensions, Banding Dimension Rows, Stamping Dimension Rows and Real Time Fact Table. Prerequisites: You need have a basic knowledge of dimensional modelling and relational database design.
My name is Vincent Rainardi. I am a data warehouse & BI architect. I wrote a book on SQL Server data warehousing & BI, as well as many articles on my blog, www.datawarehouse.org.uk. I welcome questions and discussions on data warehousing on vrainardi@gmail.com. Enjoy the presentation.
Designing high performance datawarehouseUday Kothari
Just when the world of “Data 1.0” showed some signs of maturing; the “Outside In” driven demands seem to have already initiated some the disruptive changes to the data landscape. Parallel growth in volume, velocity and variety of data coupled with incessant war on finding newer insights and value from data has posed a Big Question: Is Your Data Warehouse Relevant?
In short, the surrounding changes happening real time is the new “Data 2.0”. It is characterized by feeding the ever hungry minds with sharper insights whether it is related to regulation, finance, corporate action, risk management or purely aimed at improving operational efficiencies. The source in this new “Data 2.0” has to be commensurate to the outside in demands from customers, regulators, stakeholders and business users; and hence, you would need a high relformance (relevance + performance) data warehouse which will be relevant to your business eco-system and will have the power to scale exponentially.
We starts this webinar by giving the audiences a sneak preview of what happened in the Data 1.0 world & which characteristics are shaping the new Data 2.0 world. It then delves deep on the challenges that growing data volumes have posed to the Data warehouse teams. It also presents the audiences some of the practical and proven methodologies to address these performance challenges. Finally, in the end it will highlight some of the thought provoking ways to turbo charge your data warehouse related initiatives by leveraging some of the newer technologies like Hadoop. Overall, the webinar will educate audiences with building high performance and relevant data warehouses which is capable of meeting the newer demands while significantly driving down the total cost of ownership.
Business Intelligence and Multidimensional DatabaseRussel Chowdhury
It was an honor that my employer assigned me to study with Business Intelligence that follows SQL Server Analysis
Services. Hence I started and prepared a presentation as a startup guide for a new learner.
* Thanks to all the contributions gathered here to prepare the doc.
Best practices and tips on how to design and develop a Data Warehouse using Microsoft SQL Server BI products.
This presentation describes the inception and full lifecycle of the Carl Zeiss Vision corporate enterprise data warehouse.
Technologies covered include:
•Using SQL Server 2008 as your data warehouse DB
•SSIS as your ETL Tool
•SSAS as your data cube Tool
You will Learn:
•How to Architect a data warehouse system from End-to-End
•Components of the data warehouse and functionality
•How to Profile data and understand your source systems
•Whether to ODS or not to ODS (Determining if a operational Data Store is required)
•The staging area of the data warehouse
•How to Build the data warehouse – Designing Dimensions and Fact tables
•The Importance of using Conformed Dimensions
•ETL – Moving data through your data warehouse system
•Data Cubes - OLAP
•Lessons learned from Zeiss and other projects
Data marts,Types of Data Marts,Multidimensional Data Model,Fact table ,Dimension table ,Data Warehouse Schema,Star Schema,Snowflake Schema,Fact-Constellation Schema
MSBI online training offered by Quontra Solutions with special features having Extensive Training will be in both MSBI Online Training and Placement. We help you in resume preparation and conducting Mock Interviews.
Emphasis is given on important topics that were required and mostly used in real time projects. Quontra Solutions is an Online Training Leader when it comes to high-end effective and efficient IT Training. We have always been and still are focusing on the key aspect which is providing utmost effective and competent training to both students and professionals who are eager to enrich their technical skills.
Agile Testing Days 2017 Intoducing AgileBI Sustainably - ExcercisesRaphael Branger
"We now do Agile BI too” is often heard in todays BI community. But can you really "create" agile in Business Intelligence projects? This presentation shows that Agile BI doesn't necessarily start with the introduction of an iterative project approach. An organisation is well advised to establish first the necessary foundations in regards to organisation, business and technology in order to become capable of an iterative, incremental project approach in the BI domain.
In this session you learn which building blocks you need to consider. In addition you will see what a meaningful sequence to these building blocks is. Selected aspects like test automation, BI specific design patterns as well as the Disciplined Agile Framework will be explained in more and practical details.
Basics of Microsoft Business Intelligence and Data Integration TechniquesValmik Potbhare
The presentation used to get the conceptual understanding of Business Intelligence and Data warehousing applications. This also gives a basic knowledge about Microsoft's offerings on Business Intelligence space. Lastly but not least, it also contains some useful and uncommon SQL server programming best practices.
SALES BASED DATA EXTRACTION FOR BUSINESS INTELLIGENCEcscpconf
Data warehouse use has increased significantly in recent years and now plays a fundamental role in many organizations’ decision-support processes. An effective business intelligence
infrastructure that leverages the power of a data warehouse can deliver value by helping companies enhance their customer experience. In this paper is to generate reports with various
drilldowns and slier conditions with suitable parameters which provide a complete business solution which is helpful for monitor the company inflow and outflow. The goal of the work is
for potential users of the data warehouse in their decision making process in the Business process system to get a complete visual effort of those reports by creating the chart and grid interface from warehouse. The example in this paper relate directly to the Adventure Work Data Warehouse Project implementation which helps to know the internet sales amount according to different date
Show drafts
volume_up
Empowering the Data Analytics Ecosystem: A Laser Focus on Value
The data analytics ecosystem thrives when every component functions at its peak, unlocking the true potential of data. Here's a laser focus on key areas for an empowered ecosystem:
1. Democratize Access, Not Data:
Granular Access Controls: Provide users with self-service tools tailored to their specific needs, preventing data overload and misuse.
Data Catalogs: Implement robust data catalogs for easy discovery and understanding of available data sources.
2. Foster Collaboration with Clear Roles:
Data Mesh Architecture: Break down data silos by creating a distributed data ownership model with clear ownership and responsibilities.
Collaborative Workspaces: Utilize interactive platforms where data scientists, analysts, and domain experts can work seamlessly together.
3. Leverage Advanced Analytics Strategically:
AI-powered Automation: Automate repetitive tasks like data cleaning and feature engineering, freeing up data talent for higher-level analysis.
Right-Tool Selection: Strategically choose the most effective advanced analytics techniques (e.g., AI, ML) based on specific business problems.
4. Prioritize Data Quality with Automation:
Automated Data Validation: Implement automated data quality checks to identify and rectify errors at the source, minimizing downstream issues.
Data Lineage Tracking: Track the flow of data throughout the ecosystem, ensuring transparency and facilitating root cause analysis for errors.
5. Cultivate a Data-Driven Mindset:
Metrics-Driven Performance Management: Align KPIs and performance metrics with data-driven insights to ensure actionable decision making.
Data Storytelling Workshops: Equip stakeholders with the skills to translate complex data findings into compelling narratives that drive action.
Benefits of a Precise Ecosystem:
Sharpened Focus: Precise access and clear roles ensure everyone works with the most relevant data, maximizing efficiency.
Actionable Insights: Strategic analytics and automated quality checks lead to more reliable and actionable data insights.
Continuous Improvement: Data-driven performance management fosters a culture of learning and continuous improvement.
Sustainable Growth: Empowered by data, organizations can make informed decisions to drive sustainable growth and innovation.
By focusing on these precise actions, organizations can create an empowered data analytics ecosystem that delivers real value by driving data-driven decisions and maximizing the return on their data investment.
Opendatabay - Open Data Marketplace.pptxOpendatabay
Opendatabay.com unlocks the power of data for everyone. Open Data Marketplace fosters a collaborative hub for data enthusiasts to explore, share, and contribute to a vast collection of datasets.
First ever open hub for data enthusiasts to collaborate and innovate. A platform to explore, share, and contribute to a vast collection of datasets. Through robust quality control and innovative technologies like blockchain verification, opendatabay ensures the authenticity and reliability of datasets, empowering users to make data-driven decisions with confidence. Leverage cutting-edge AI technologies to enhance the data exploration, analysis, and discovery experience.
From intelligent search and recommendations to automated data productisation and quotation, Opendatabay AI-driven features streamline the data workflow. Finding the data you need shouldn't be a complex. Opendatabay simplifies the data acquisition process with an intuitive interface and robust search tools. Effortlessly explore, discover, and access the data you need, allowing you to focus on extracting valuable insights. Opendatabay breaks new ground with a dedicated, AI-generated, synthetic datasets.
Leverage these privacy-preserving datasets for training and testing AI models without compromising sensitive information. Opendatabay prioritizes transparency by providing detailed metadata, provenance information, and usage guidelines for each dataset, ensuring users have a comprehensive understanding of the data they're working with. By leveraging a powerful combination of distributed ledger technology and rigorous third-party audits Opendatabay ensures the authenticity and reliability of every dataset. Security is at the core of Opendatabay. Marketplace implements stringent security measures, including encryption, access controls, and regular vulnerability assessments, to safeguard your data and protect your privacy.
Adjusting primitives for graph : SHORT REPORT / NOTESSubhajit Sahu
Graph algorithms, like PageRank Compressed Sparse Row (CSR) is an adjacency-list based graph representation that is
Multiply with different modes (map)
1. Performance of sequential execution based vs OpenMP based vector multiply.
2. Comparing various launch configs for CUDA based vector multiply.
Sum with different storage types (reduce)
1. Performance of vector element sum using float vs bfloat16 as the storage type.
Sum with different modes (reduce)
1. Performance of sequential execution based vs OpenMP based vector element sum.
2. Performance of memcpy vs in-place based CUDA based vector element sum.
3. Comparing various launch configs for CUDA based vector element sum (memcpy).
4. Comparing various launch configs for CUDA based vector element sum (in-place).
Sum with in-place strategies of CUDA mode (reduce)
1. Comparing various launch configs for CUDA based vector element sum (in-place).
Chatty Kathy - UNC Bootcamp Final Project Presentation - Final Version - 5.23...John Andrews
SlideShare Description for "Chatty Kathy - UNC Bootcamp Final Project Presentation"
Title: Chatty Kathy: Enhancing Physical Activity Among Older Adults
Description:
Discover how Chatty Kathy, an innovative project developed at the UNC Bootcamp, aims to tackle the challenge of low physical activity among older adults. Our AI-driven solution uses peer interaction to boost and sustain exercise levels, significantly improving health outcomes. This presentation covers our problem statement, the rationale behind Chatty Kathy, synthetic data and persona creation, model performance metrics, a visual demonstration of the project, and potential future developments. Join us for an insightful Q&A session to explore the potential of this groundbreaking project.
Project Team: Jay Requarth, Jana Avery, John Andrews, Dr. Dick Davis II, Nee Buntoum, Nam Yeongjin & Mat Nicholas
Data Centers - Striving Within A Narrow Range - Research Report - MCG - May 2...pchutichetpong
M Capital Group (“MCG”) expects to see demand and the changing evolution of supply, facilitated through institutional investment rotation out of offices and into work from home (“WFH”), while the ever-expanding need for data storage as global internet usage expands, with experts predicting 5.3 billion users by 2023. These market factors will be underpinned by technological changes, such as progressing cloud services and edge sites, allowing the industry to see strong expected annual growth of 13% over the next 4 years.
Whilst competitive headwinds remain, represented through the recent second bankruptcy filing of Sungard, which blames “COVID-19 and other macroeconomic trends including delayed customer spending decisions, insourcing and reductions in IT spending, energy inflation and reduction in demand for certain services”, the industry has seen key adjustments, where MCG believes that engineering cost management and technological innovation will be paramount to success.
MCG reports that the more favorable market conditions expected over the next few years, helped by the winding down of pandemic restrictions and a hybrid working environment will be driving market momentum forward. The continuous injection of capital by alternative investment firms, as well as the growing infrastructural investment from cloud service providers and social media companies, whose revenues are expected to grow over 3.6x larger by value in 2026, will likely help propel center provision and innovation. These factors paint a promising picture for the industry players that offset rising input costs and adapt to new technologies.
According to M Capital Group: “Specifically, the long-term cost-saving opportunities available from the rise of remote managing will likely aid value growth for the industry. Through margin optimization and further availability of capital for reinvestment, strong players will maintain their competitive foothold, while weaker players exit the market to balance supply and demand.”
Techniques to optimize the pagerank algorithm usually fall in two categories. One is to try reducing the work per iteration, and the other is to try reducing the number of iterations. These goals are often at odds with one another. Skipping computation on vertices which have already converged has the potential to save iteration time. Skipping in-identical vertices, with the same in-links, helps reduce duplicate computations and thus could help reduce iteration time. Road networks often have chains which can be short-circuited before pagerank computation to improve performance. Final ranks of chain nodes can be easily calculated. This could reduce both the iteration time, and the number of iterations. If a graph has no dangling nodes, pagerank of each strongly connected component can be computed in topological order. This could help reduce the iteration time, no. of iterations, and also enable multi-iteration concurrency in pagerank computation. The combination of all of the above methods is the STICD algorithm. [sticd] For dynamic graphs, unchanged components whose ranks are unaffected can be skipped altogether.
As Europe's leading economic powerhouse and the fourth-largest hashtag#economy globally, Germany stands at the forefront of innovation and industrial might. Renowned for its precision engineering and high-tech sectors, Germany's economic structure is heavily supported by a robust service industry, accounting for approximately 68% of its GDP. This economic clout and strategic geopolitical stance position Germany as a focal point in the global cyber threat landscape.
In the face of escalating global tensions, particularly those emanating from geopolitical disputes with nations like hashtag#Russia and hashtag#China, hashtag#Germany has witnessed a significant uptick in targeted cyber operations. Our analysis indicates a marked increase in hashtag#cyberattack sophistication aimed at critical infrastructure and key industrial sectors. These attacks range from ransomware campaigns to hashtag#AdvancedPersistentThreats (hashtag#APTs), threatening national security and business integrity.
🔑 Key findings include:
🔍 Increased frequency and complexity of cyber threats.
🔍 Escalation of state-sponsored and criminally motivated cyber operations.
🔍 Active dark web exchanges of malicious tools and tactics.
Our comprehensive report delves into these challenges, using a blend of open-source and proprietary data collection techniques. By monitoring activity on critical networks and analyzing attack patterns, our team provides a detailed overview of the threats facing German entities.
This report aims to equip stakeholders across public and private sectors with the knowledge to enhance their defensive strategies, reduce exposure to cyber risks, and reinforce Germany's resilience against cyber threats.
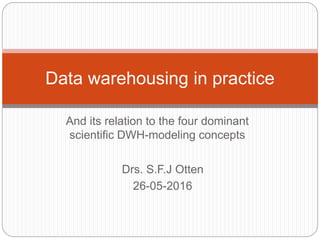
1. And its relation to the four dominant
scientific DWH-modeling concepts
Data warehousing in practice
Drs. S.F.J Otten
26-05-2016
2. Topics
About me…
Business Intelligence
What is a Data warehouse (DWH)
DWH – Design strategies
Data-modeling
Brief history in data modeling
Star-schematic
Snowflake-schematic
Datavault
Anchormodeling
Pratical examples
Summary
3. About me…
Education
Highschool (MAVO)
College (MBO ICT lvl.4)
Univeristy of Applied
sciences (Avans
Hogeschool, Business
Informatics; BSc)
Utrecht University (MBI;
MSc)
Utrecht University (PhD)
Carreer till now..
Kadenza (privatly held (80
employees) (2014 –
present)
Senior BI-architect
(mostly Microsoft BI stack)
CSB-System BV/GmbH
(privatly held, 500-1000
employees globally)
(2010-2014)
BI-consultant/architect
(Microsoft BI stack)
Lead
programmingdepartment
for BI at HQ in DE
4. Business Intelligence
Business Intelligence??
“a way for organizations to understand their internal and external
environment through the systematic acquisition, collation, analysis,
interpretation and exploitation of information” (Watson & Wixom,
2007).
5. What is a Data warehouse (1)
Data warehouse?? (DWH)
“a repository where all data relevant to the
management of an organization is stored and from
which knowledge emerges.” (March & Hevner, 2007)
“A data warehouse is a subject-oriented, integrated,
time-variant, nonvolatile collection of data in support
of management’s decision-making process.” (Inmon, 1992)
Different definitions same goal;
provide data in such a way that it has meaning and
can be used in all levels of an organization as input for
a decision-making-process
6. DWH – design strategies (1)
Enterprise wide DWH-design (Imnon, 2002)
DWH is designed by using a normalized enterprise
data model From the EDWH data marts for specific
business domains are derived
Data mart design (Kimball, 2002)
Hybrid strategy (top-down & bottom-up) for DWH-
design
Create datamarts in a bottom-up fasion
Datamart-design conforms to a top-down
skeleton/framwork-design which is called the
“data warehouse bus”
The EDW = the union of the conformed datamarts
11. Data-modeling – Star/SF - concepts
Concepts
Star-/snowflake-schematic Golfarelli, M., Maio, D., & Rizzi, S. (1998)
Fact-table A fact is a focus of interest for the
decision-making process; typically, it
models an
event occurring in the enterprise world
(e.g., sales and shipments)
Dimension-table Dimensions are discrete
attributes which determine the minimum
granularity adopted to represent facts;
typical dimensions for the sale fact are
product, store and date
Hierarchy Discrete dimension attributes linked by -
to-one relationships, and determine how
facts may be aggregated and selected
significantly for the decision-making
process.
12. Data-modeling - star-schematic
• Comprises of a
single fact-table
• Has N-
dimension-
tables
• Each tuple in the
fact-table has a
pointer (FK) to
each of the
dimension-
tables
• Each dimension-
table has
columns that
correspond to
attributes of the
specific
dimensions(Chaud
huri & Dayal, 1997)
13. Data-modeling - snowflake-schematic
• A normalized
star-
schematic
(3NF)
• Dimensions
are split up in
to sub
dimensions
• Lesser FK’s
in fact-table
• Easier
maintenance
14. Data-modeling –Star/SF - ETL
• Conventional
DWH-architecture
(Star-/SF-
schematic) for
populating a DWH
• RFC has a high
impact on existing
ETL-
practice/package
and DWH (i.e.
request for a new
metric) = re-
engineering
• Introduction of a
new IT-system
causes serious
rework and
headaches
15. Data-modeling – Star/SF – ETL - P.O.A
Two types of ETL:
FULL ETL
Complete transfer of all data in source-systems via ETL-
packages
Incremental ETL
After FULL ETL , incremental ETL determines the delta and
loads it into the DWH. The loading can be :
INSERT records that are not present in the DWH
UPDATE records that have changed values in certain
columns
o Requires UPDATE-statements need to take into
account the keys (primary and foreign) that uniquely
identify a record in a table and execute the UPDATE-
statement); risky if not entirely clear what the unique
identifier is.
16. Data-modeling – Star/SF – Case (1)
DWH = Snowflake-architecture (3NF)
Dimension-tables (DimItem,DimInvoice)
Fact-table (FactSalesStatistics)
ETL comprises a FULL and INCREMENTAL-load
Client A sends an RFC for an addition in the sales-
overview.
Addition = metric “NetValue” per item per invoice
Additional req= metric “NetValue” is present for future
data and also for data allready residing in the sales-
overview
How would you guys, as future Business-/Technical-
consultants / researches approach this case??
17. Data-modeling – Star/SF – Case (2)
Solution
Identify column containing metric “NetValue” in the source-
system (requires in-depth analysis of transactional system)
Add column to fact table “FactSalesStatistics” ([NetValue]
[decimal] (x,y) NULL)
Revert to appropriate ETL-package;
Adjust the source-query / source-columns to include the identified
column (metric)
Adjust the function that determines the Delta (add identified column)
Adjust the INSERT-command to write the value from the identified
source-column metric “NetValue” in fact-table “FactSalesStatistics”
Adjust the UPDATE-command to update the metric “NetValue” with the
value from the identified source-column for the existing data in table
“FactSalesStatistics”
VALIDATE…VALIDATE…VALIDATE…the ERP-data and
DWH-data (especially in the beginning)
18. Data-modeling – Star/SF – Case (3)
Introduce the new metric in your Sales-cube
Refresh the data source / data source view to get the metric
“NetValue” in the cube-server-environment
Add measure simply by adding the metric in a measuregroup
in the sales-cube
Process the cube and the metric should be available for all
end-users
19. Data-modeling – Datavault - Concepts
Concepts
Data vault (DV) Lindstedt, D., & Graziano, K. (2011)
Data vault The Data Vault is a detail oriented,
historical tracking and uniquely linked set
of normalized tables that support one or
more functional areas of business. It is
scalable and flexible
Hub The Hub is intended to represent major
identifiable concepts-entities of interest
from the real world. It is required that
every Hub entity can be denoted by a
unique identifier
Link The Link represents relationship among
Concepts. Both, Hubs and Links may be
involved in such relationships
Satellite The Satellite is used to associate a Hub
(or a Link) with (a data model) attribute
20. Data-modeling – Datavault - Schematic
• Comprises of
N-Hub-/Link-
/Satellite-
tables
• Scalable/Flexi
ble
• 100% of the
data, 100% of
the time
• Fairly new to
DWH-world
• Used by large
organizations
(i.e. D.O.D,
ABN-AMRO)
21. Data-modeling – Datavault - ETL
• Datavault-
ETL-
architecture
for populating
a datavault.
• RFC has no
impact on
existing ETL-
practice/packa
ge and DWH;
no re-
engineering
• Introduction of
new IT-system
does not
cause
headaches
22. Data-modeling – Datavault – ETL – P.O.A
Two types of ETL:
FULL ETL
Complete transfer of all data in source-systems via ETL-packages
Decomposition of existing tables in to Hubs, Links, and Satellites
Incremental ETL
After FULL ETL , incremental ETL determines the delta and
loads it into the DWH. The loading can be :
INSERT records that are not present in the DWH
END-DATING records that are not valid anymore
There is no UPDATING of metric columns in Datavault.
Only an End-date update is required
23. Data-modeling – Datavault – Case (1)
DWH = Datavault-architecture
Hub-tables (H_Product,H_Customer,H_Order)
Link-tables (L_SalesOrder)
Satellite-tables
(S_Product_1,S_SalesOrder_1,S_Customer_1)
ETL comprises a FULL and INCREMENTAL-load
Client A sends an RFC for an addition in the sales-
overview.
Addition = metric “NetValue” per item per order
Additional req= metric “NetValue is present for future data and
also for data allready residing in the sales-overview
How would you guys, as future Business-/Technical-
consultants / researches approach this case??
24. Data-modeling – Datavault – Case (2)
Solution
Identify column containing metric “NetValue” in the source-system
(requires in-depth analysis of transactional system)
Create a new table in the DWH called S_SalesOrder_2
(ProductID,CustomerID,OrderID,LoadDate,NetValue,MD5,Source,EndDa
te)
Create a new ETL-package
Provide the source-query/ source-columns including the new metric
“NetValue”
Create the function that determines the Delta (Keyfields &identified
column)
Create the INSERT-command to write the value from the identified
source-column metric “NetValue” in satellite S_SalesOrder_2 with
additional values for
“ProductID,CustomerID,OrderID,LoadDate,MD5,Source)
Optional: Create EndDate-function (with the help of staging-tables)
VALIDATE…VALIDATE…VALIDATE…the ERP-data and DWH-data
(especially in the beginning)
26. Data-modeling – Datavault – Case (4)
Datavault does not store data in a structure that is suited
for usage in a datacube.
A datacube needs a Star-/SF-schematic. Hence, data
marts or a “Business vault” is created.
introducting new data in the cube, by using a data mart, is
the same as for a Star-/SF-schematic DWH
27. Data-modeling – Anchormodeling -
concepts
Concepts
Anchor modeling (AM) Rönnbäck (2010)
Anchor modeling Anchor modeling is an agile information
modeling technique that offers non-
destructive extensibility mechanisms.
Anchor An anchor represents a set of entities.
Attribute Attributes are used to represent
properties of anchors
Tie tie represents an association between
two or more anchor entities and optional
knot entities
Knot knot is used to represent a fixed,
typically small, set of entities that do not
change over time
28. Data-modeling – anchormodeling -
schematic
• 6NF-modeling
• Assumption
of AM is that
data changes
over time
• Future proof
• Evolution of
data model is
done through
extensions
• Modulair
• Agile
• Bottom up
29. Data-modeling – anchormodeling - ETL
ETL-procedure has many similarities with DV-ETL-ing
In DV first the HUBS are filled, followed by the LINKS and to
finish it of the SATELLITES are filled.
With AM at first the ANCHORS are populated, followed by
the TIES and ATTRIBUTES
In addition a metadata-repository is filled with each ETL-run
Like DV, there are only INSERT-statements and END-
DATING-procedures.
NO UPDATE-statement
DELETE-statement is only performed when errornous data is
loaded for a given batch
30. Data-modeling – anchormodeling – ETL –
P.O.A
In an ANCHOR only the surrogate key is stored. While with
DV in a HUB the surrogate key and businesskey are
stored together
How is this resolved in an ETL-environment?
Well, the same as to populate a HUB in DV but with an
additional step.
Additional attributes can be loaded in parallel like in DV.
For each of those attributes the surrogatekey is resolved
by referencing the businesskey-attribute.
34. Summary (1)
Two main DWH-design-strategies
Enterprise wide DWH-design
DWH is designed by using a normalized enterprise data model
From the EDWH data marts for specific business domains are
derived
Data mart Design
Create datamarts in a bottom-up fasion
Datamart-design conforms to a top-down skeleton/framwork-
design which is called the “data warehouse bus”
The EDW = the union of the conformed datamarts
35. Summary (2)
Four main Data-modeling-techniques
Star-/Snowflake were introduced in the 80’s
Star-/Snowflake requires re-engineering when introducing new
metrics or systems at the source (ETL/DWH). High impact
Not Agile, specs are determined beforehand, traditional way of
system development deliver results slow hard to expand
existing
Datavault / anchor-modeling introduced in early/mid 00’s
Flexible, Scalable data-model, requires no re-engineering when
introducing new metrics or systems at the source (ETL/DWH),
simply extend/expand. Little to no impact
Agile fast developemt track due to iterative development start
small deliver results fast Expand Scale without effort
36. Summary (3)
So, which data-modeling technique comes out as the
winner…
Well, None, they can co-exist and you should choose the
one that is suited for your needs,demands, skillset etc.
It is merely a tool for acieving your goal
BI-schematic overview (classic)
Focus on DWH this presentation (RED)
DWH = the core of a BI-environment. If data is not stored properly it could have serious concequenses for both the back-end and the front-end (business perspective; wrong numbers wrong decisions etc.)
DWH-adjustment has effect on Extract Transform Load (ETL) and Presentation/Analytics (cube structure, report-definition etc)
Comparing both schematics, each has its advantages and disadvantages. The star schematic is a simple design which is fast to set up, easy to use and more suitable for browsing dimensional tables due to its denormalized structure and therefore is often used in DW design. However, the possibility for inefficiencies due to a higher risk of redundancy is present (Chaudhuri & Dayal, 1997). The snowflake schematic requires more design time, takes longer to set up, but due to its normalized structure it allows for a decrease in redundancy and thereby the possible removal of inefficiencies resulting in performance enhancements.
DELTA can be determined by hashvalues or MD5-checksums based on certain attributes and do a look-up.
UPDATE = (1) Delete OLD-data, (2) INSERT NEW-data expensive on the resources, takes quite some time when handlig large datasets, error-sensitive
SF-architecture
Two dim-tables; one facttable
Delta-function() uses a hashvalue-component in ETL-package for determining the delta
UPDATE-statement is error prone. If one does not know for sure how to uniquely identify a record the possibility exists that multiple records are wrongfully updated with new data.
consequence wrong data wrong information wrong knowledge wrong input in strategic desicion process wrong choices
Who’s tom blame? Yep, the IT-guy who created it. There goes your reputation and good will from the client.
Datavault-principles:
100% of the data, 100% of the time (no filtereing on datasource or aggregations)
Flexible (extendibility with ease; introduction of new data into the datavault does not affect allready present datavault-structure)
Scalable (due to its structure datavault is scalable over multiple servers without any problems and it can grow rapidly in size)
(i.e. Used by D.O.D. due to its flexibily and scalability (3 PetaBytes of data))
Sequence of data load per business-entity:
Hubs
Links
Sattelites
With recent sql-servers one is able to use lead() and LAG() functions to determine end-date. This eliminates the need for an update-statement for END-dating
Anchormodeling is the latest addition to the data-modeling-schematics for a DWH.
Just like Datavault it is very flexible and scalable. However, the decomposition of operational entities is even higher than in data vault and has strict modeling rules:
Each attribute for an “anchor” or “tie” is stored in its own table
Strict naming conventions for anchors, attributes, ties and knots
AM obligates you to set-up metadata-repository
Anchor only contains a surrogate key
NULL-elimination
If you have any questions afterwards please feel free to contact me.