Here are the steps to solve this homework problem:
1. Draw the snowflake schema diagram with dimensions for students, modules, semesters, and lecturers connected to fact tables with measures of count and avg_grade.
2. To list the average grade of CS modules for each student, perform the following OLAP operations on the base cuboid:
- Roll-up the semester dimension to the year level
- Roll-up the module dimension to the CS level
This would aggregate the avg_grade measure to the student-year-CS level.
3. If each dimension has 5 levels, including an overall "all" level, and there are 4 dimensions, then by the power set formula,
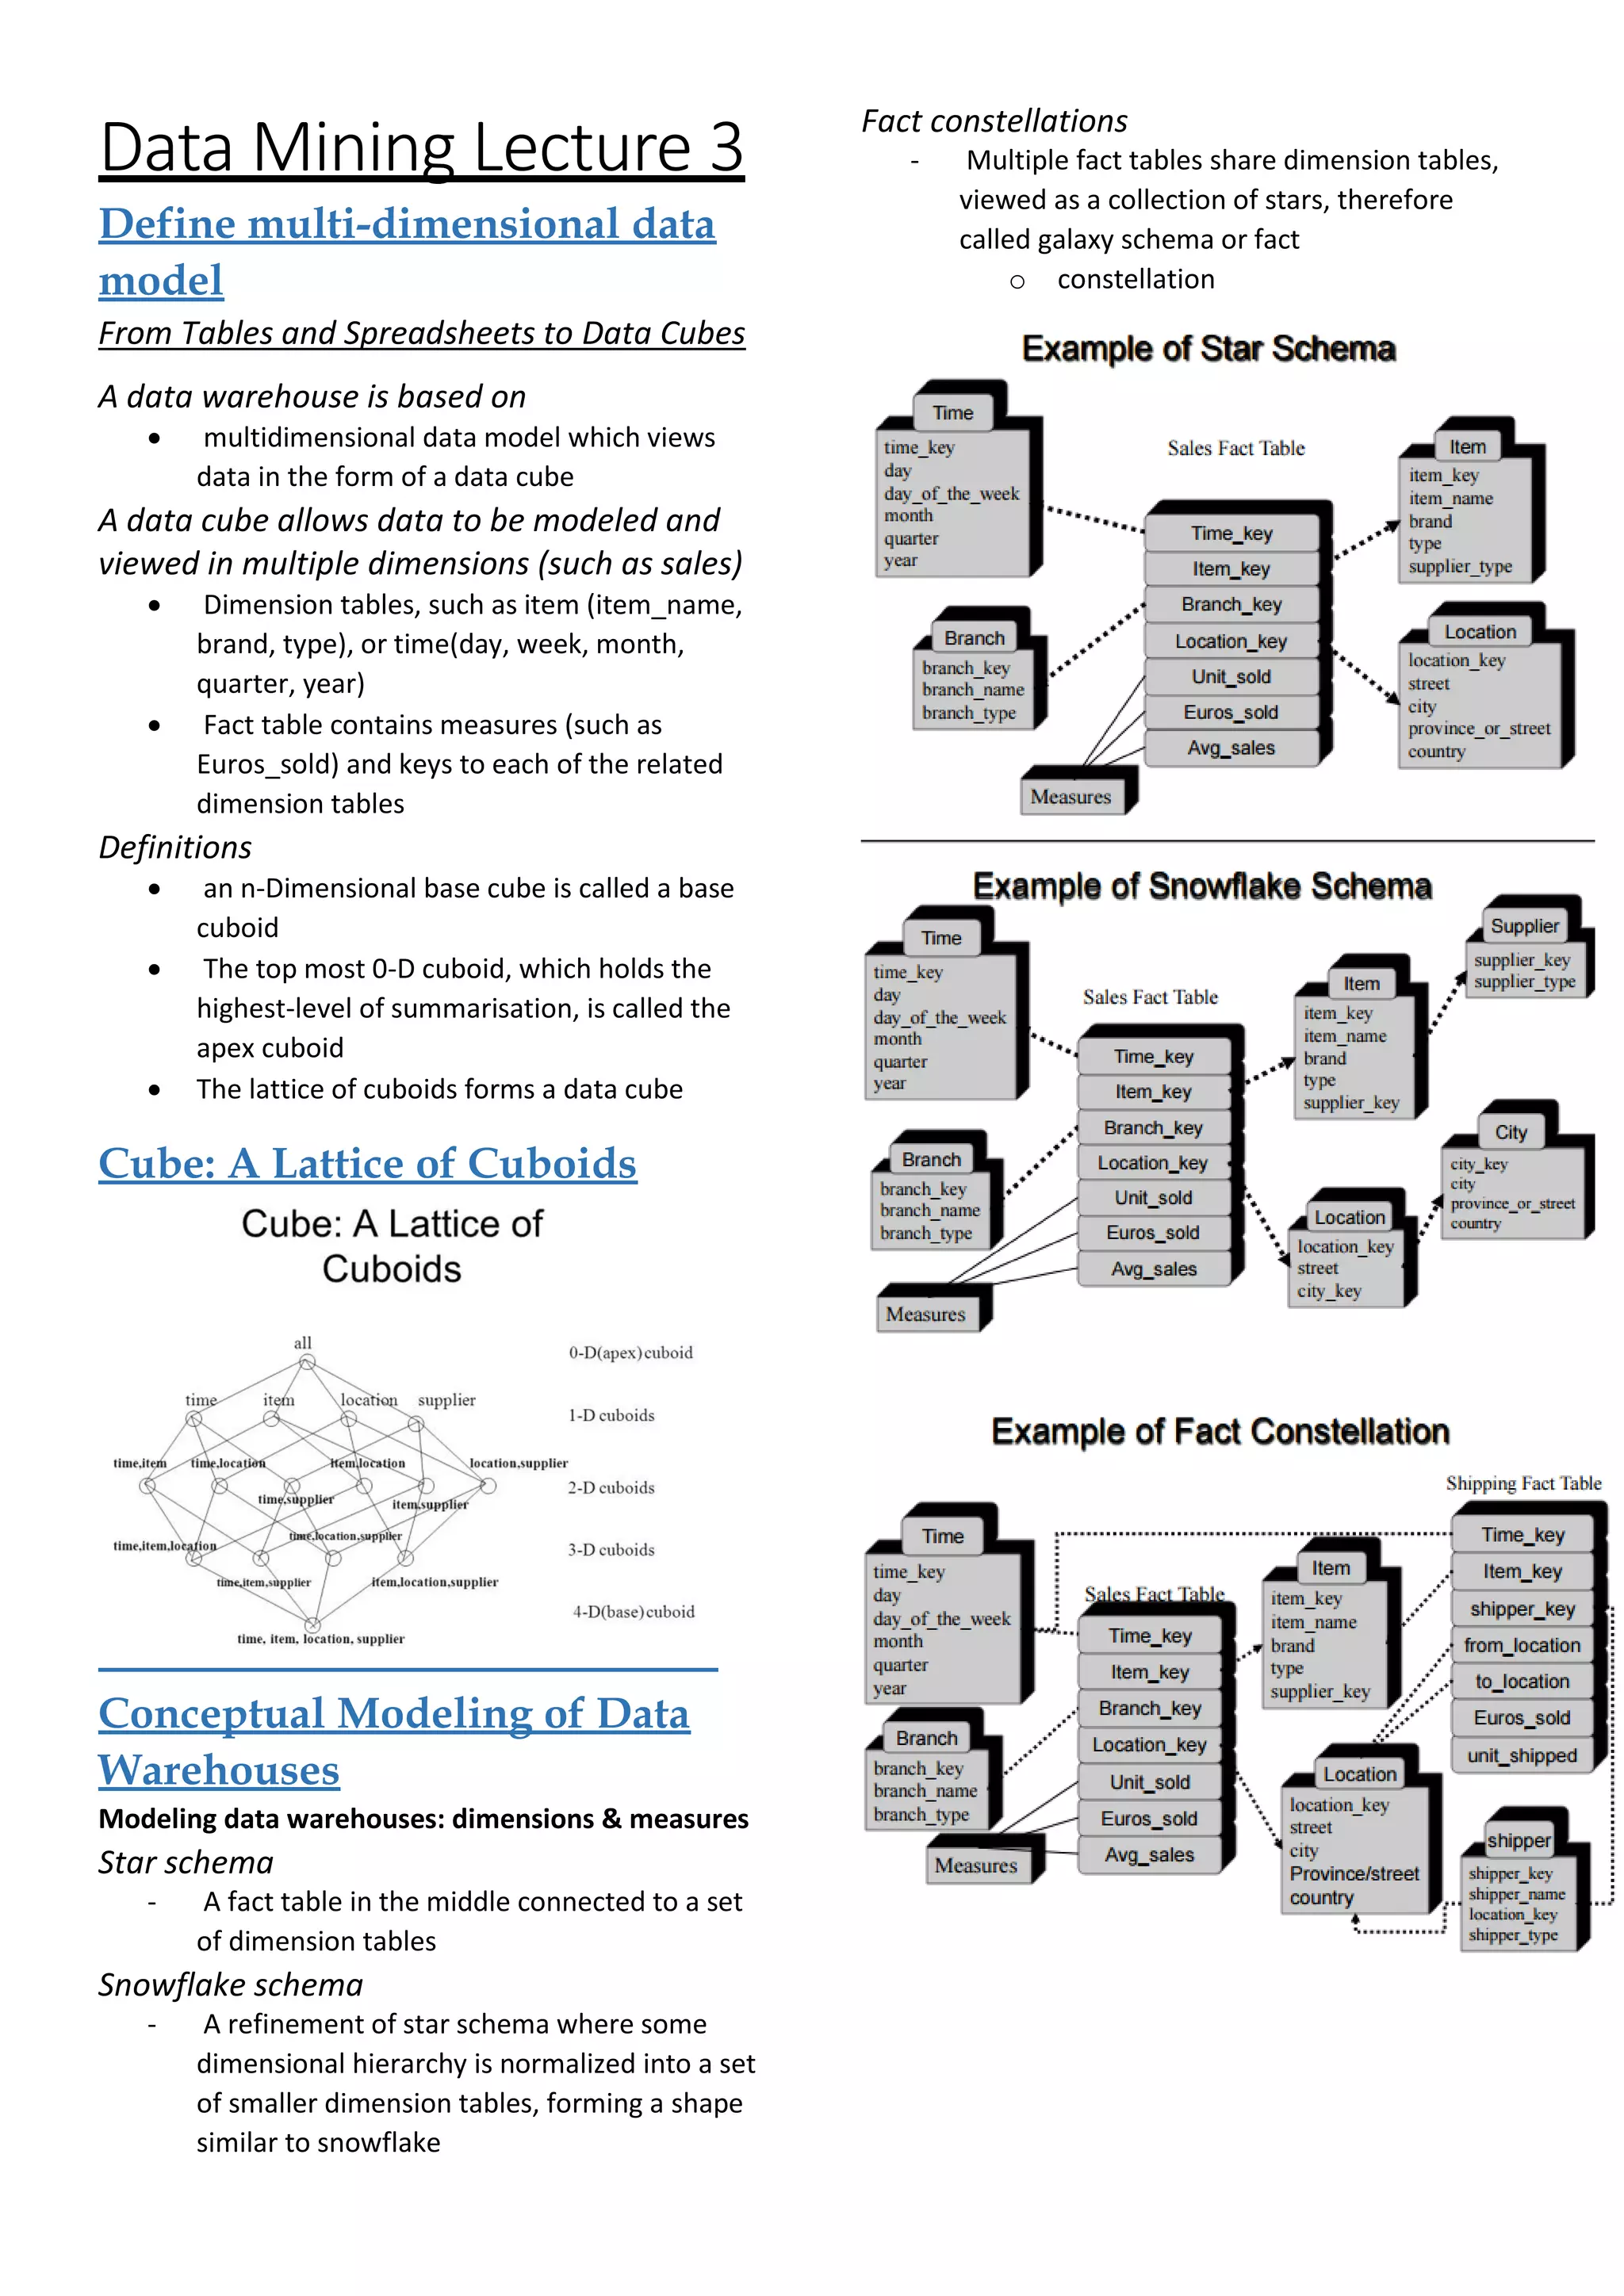
![DMQL: Language Primitives
Cube Definition (Fact Table)
define cube <cube_name> [<dimension_list>]:
<measure_list>
Dimension Definition (Dimension Table)
define dimension <dimension_name> as
(<attribute_or_subdimension_list>)
Special Case (Shared Dimension Tables)
First time as “cube definition”
define dimension <dimension_name> as
<dimension_name_first_time> in cube
<cube_name_first_time>
Defining a Star Schema in
DMQL
define cube sales_star [time, item, branch, location]:
Euros_sold = sum(sales_in_Euros),
avg_sales = avg(sales_in_Euros),
units_sold = count(*)
define dimension time as
(time_key, day, day_of_week, month,
quarter, year)
define dimension item as
(item_key, item_name, brand, type,
supplier_type)
define dimension branch as
(branch_key, branch_name, branch_type)
define dimension location as
(location_key, street, city, county, province,
country)
Defining a Snowflake Schema in
DMQL
define cube sales_snowflake [time, item, branch,
location]:
Euros_sold = sum(sales_in_Euros),
avg_sales = avg(sales_in_Euros),
units_sold = count(*)
define dimension time as
(time_key, day, day_of_week, month,
quarter, year)
define dimension item as
(item_key, item_name, brand, type,
supplier(supplier_key, supplier_type))
define dimension branch as
(branch_key, branch_name, branch_type)
define dimension location as
(location_key, street, city(city_key, county,
province, country))
Defining a Fact Constellation in
DMQL
define cube sales [time, item, branch, location]:
Euros_sold = sum(sales_in_Euros), avg_sales =
avg(sales_in_Euros),
units_sold = count(*)
define dimension time as (time_key, day,
day_of_week, month, quarter, year)
define dimension item as (item_key, item_name,
brand, type, supplier_type)
define dimension branch as (branch_key,
branch_name, branch_type)
define dimension location as (location_key, street,
city, province_or_state,
country)
define cube shipping [time, item, shipper,
from_location, to_location]:
Euro_cost = sum(cost_in_Euros), unit_shipped =
count(*)
define dimension time as time in cube sales
define dimension item as item in cube sales
define dimension shipper as (shipper_key,
shipper_name, location as location
in cube sales, shipper_type)
define dimension from_location as location in cube
sales
define dimension to_location as location in cube sales
Measures: Three Categories
Distributive
if the result derived by applying the function
to n aggregate values is the same as that
derived by applying the function on all the
data without partitioning.
o E.g., count(), sum(), min(), max()
Algebraic
if it can be computed by an algebraic function
with M arguments (where M is a bounded
integer), each of which is obtained by
applying a distributive aggregate function.
o E.g., avg(), min_N(),
standard_deviation()
Holistic
if there is no constant bound on the storage
size needed to describe a sub-aggregate.
o E.g., median(), mode(), rank()](https://image.slidesharecdn.com/datamininglecture3-160909020936/75/Data-mining-3-Data-Models-and-Data-Warehouse-Design-cheat-sheet-printable-2-2048.jpg)
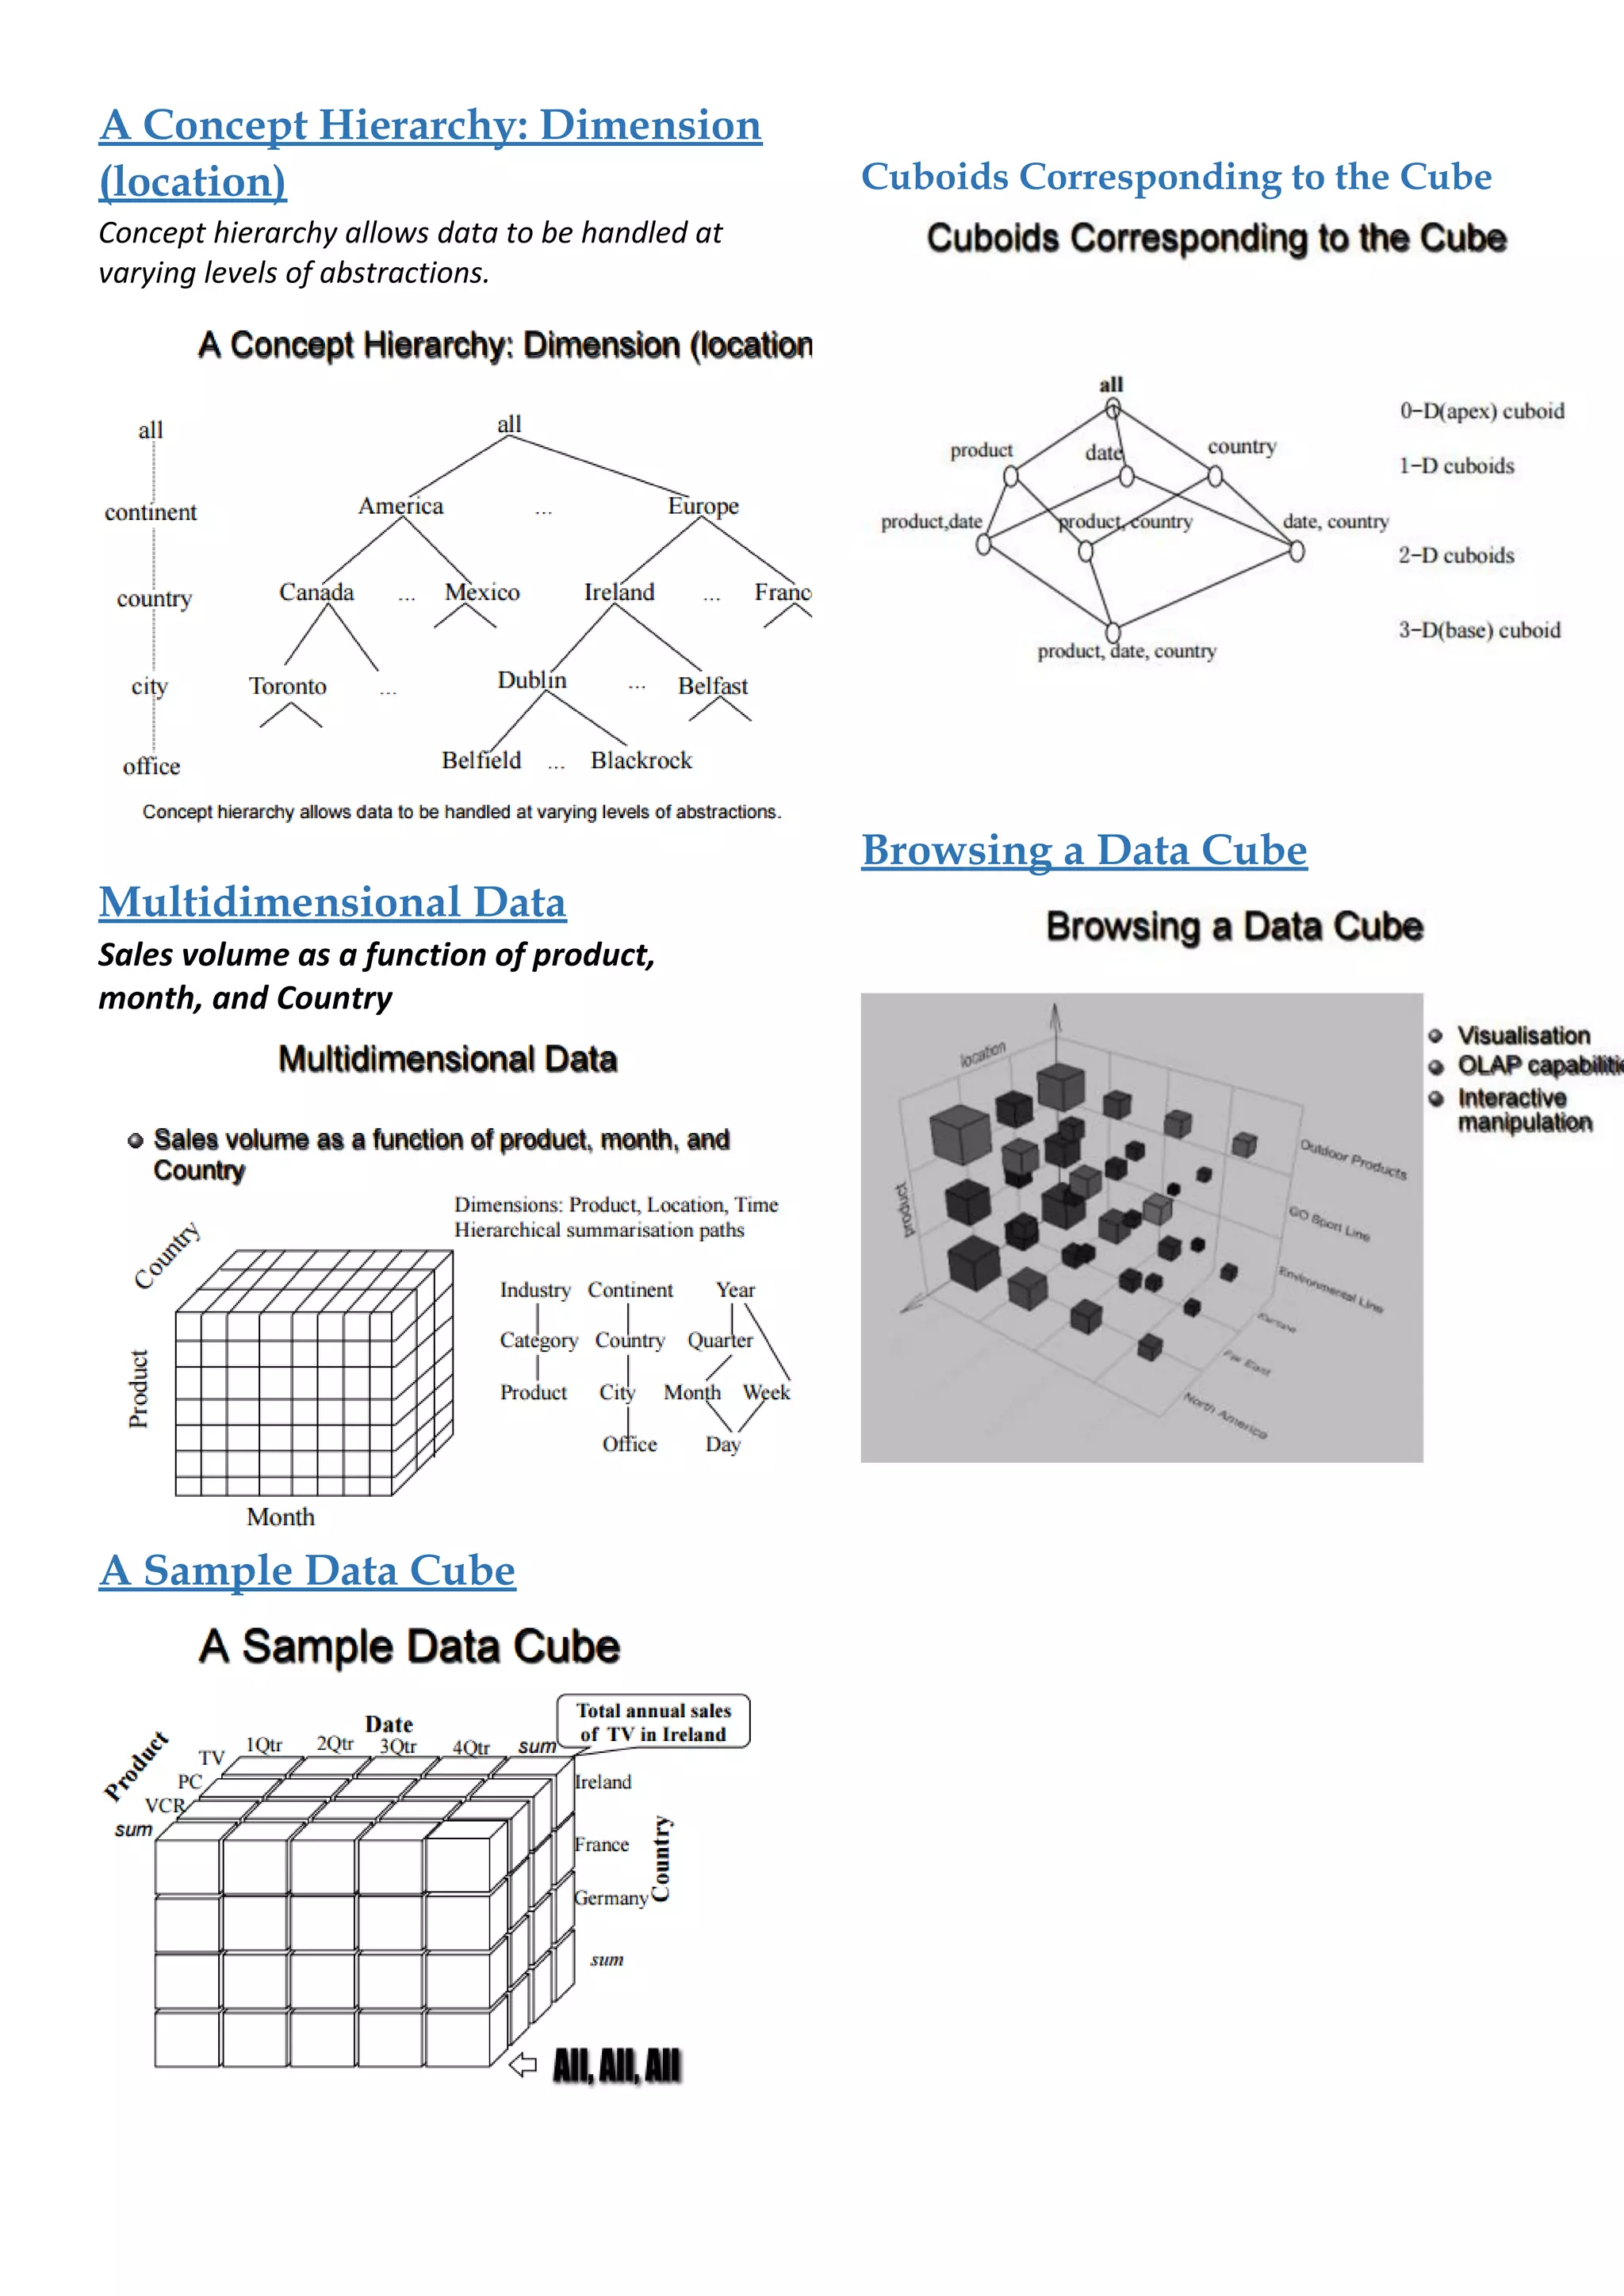
![Three Data Warehouse Models
Enterprise warehouse
collects all of the information about subjects
spanning the entire organisation
Data Mart
a subset of corporate-wide data that is of
value to a specific group of users. Its scope is
confined to specific, selected groups, such as
marketing data mart
- Independent vs. dependent (directly from
warehouse) data mart
Virtual warehouse
A set of views over operational databases
Only some of the possible summary views
may be materialised
Data Warehouse Development:
A Recommended Approach
OLAP Server Architectures
Relational OLAP (ROLAP)
Use relational or extended-relational DBMS
to store and manage warehouse data and
OLAP middleware to support missing pieces
Include optimisation of DBMS backend,
implementation of aggregation navigation
logic, and additional tools and services
greater scalability
Multidimensional OLAP (MOLAP)
Array-based multidimensional storage engine
(sparse matrix techniques)
fast indexing to pre-computed summarised
data
Hybrid OLAP (HOLAP)
User flexibility, e.g., low level: relational,
high-level: array
Specialised SQL servers
specialised support for SQL queries over
star/snowflake schemas
Home Work 1a
Suppose that a data warehouse for a Big University
consists of the following 4
dimensions: students, module, semester, and lecturer
and 2 measures count
and avg_grade. When at the lowest conceptual level
(e.g., for a given student,
module, semester, and lecturer combination), the
avg_grade measure stores
the actual module grade of the student. At higher
conceptual levels,
avg_grade stores the average grade for the given
combination.
1. Draw a snowflake schema diagram for the data
warehouse.
2. Starting with the base cuboid [student, module,
semester, lecturer], what
specific OLAP operations (e.g., roll-up from semester
to year) should one
perform in order to list the average grade of CS
modules for each Big
University student.
3. If each dimension has 5 levels (including all), such
as “student < major <
status < university < all”, how many cuboids will this
cube contain (including
the base and apex cuboids](https://image.slidesharecdn.com/datamininglecture3-160909020936/75/Data-mining-3-Data-Models-and-Data-Warehouse-Design-cheat-sheet-printable-5-2048.jpg)


