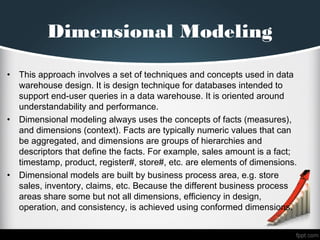
DIMENSION
MODELLING
ISM-6028
DIVYA RAJASRI TADI
ISHRAIN HUSSAIN
MADHURI CHADALAPAKA
SHWETHA THYAGARAJACHARY
Dimensional Modeling
• This approach involves a set of techniques and concepts used in data
warehouse design. It is design technique for databases intended to
support end-user queries in a data warehouse. It is oriented around
understandability and performance.
• Dimensional modeling always uses the concepts of facts (measures),
and dimensions (context). Facts are typically numeric values that can
be aggregated, and dimensions are groups of hierarchies and
descriptors that define the facts. For example, sales amount is a fact;
timestamp, product, register#, store#, etc. are elements of dimensions.
• Dimensional models are built by business process area, e.g. store
sales, inventory, claims, etc. Because the different business process
areas share some but not all dimensions, efficiency in design,
operation, and consistency, is achieved using conformed dimensions.
INTRODUCTION
Fact Table
•Stocks Fact
Dimension Table
•Political Parties: Information about ruling political parties
and current presidency
•Company: Information about the Companies involved in
the stock market
•Supply & Demand: Fluctuation in the stock price and the
relative increase or decrease in the supply & demand
•Hype: Popluarity of a product or company
Step1 - Select the business process to
model
•There are various factors that are crucial while analyzing the stock
market like Economy, Scandals, Politics, Hype, Supply and Demand,
Natural disasters, expectation and speculation, war, politics, global
events, news related to companies etc., The business model that can
be built on the Stocks database is the stock value pertaining to various
dimensions.
•For instance, let’s consider the business problem as “finding the
industry with the highest stock value in the past decade occurred under
which political party’s reign and in which quarter.”
QUERY
SELECT S.COMPANY, S.GICS_SECTO ,Q.TRADE_YEAR,
P.CONGRESS_ID,
P.CONGRESS_NAME,P.WHITEHOUSE_PARTY, MAX(Q.HIGH) AS
MAX_HIGH
FROM POLITICAL_PARTIES P,SP500_EOD_STOCKS E,STOCKS S,
SP500_QUARTERLY_FACTS Q
WHERE Q.TRADE_YEAR BETWEEN 2005 AND 2015
GROUP BY
S.COMPANY,S.GICS_SECTOR,Q.TRADE_YEAR,P.CONGRESS_ID,
P.CONGRESS_NAME,
P.WHITEHOUSE_PARTY
ORDER BY
MAX(Q.HIGH) DESC
Which yields the following result snapshot that clearly indicates
that in the past decade, the financial sector has the highest
stock (1197.66) under the ruling of Democrats.
COMPANY GICS_SECTOR TRADE_YEA
R
CONGRESS_ID CONGRESS_NAME WHITEHOUSE_PARTY MAX_HIGH
Allstate Corp Financials 2005 87 87th Democrat 1197.66
Citigroup Inc. Financials 2005 87 87th Democrat 1197.66
Amgen Inc Health Care 2005 87 87th Democrat 1197.66
Broadcom
Corporation
Information
Technology
2005 87 87th Democrat 1197.66
Anadarko Petroleum
Corp
Energy 2005 87 87th Democrat 1197.66
Adobe Systems Inc Information
Technology
2005 87 87th Democrat 1197.66
Boston Scientific Health Care 2005 87 87th Democrat 1197.66
Becton Dickinson Health Care 2005 87 87th Democrat 1197.66
BMC Software Information
Technology
2005 87 87th Democrat 1197.66
Apple Inc. Information
Technology
2005 87 87th Democrat 1197.66
Step2 - Declare the grain of the
business process
The granularity of a dimension depends on how often it is modified. If
the Political party dimension is considered, the
POLITICAL_PARTIES table is modified only after every election or
when change in the government takes place. So, we do not need a
fine grain for this dimension. The political party dimension table is as
follows:
POLITICAL_PARTIES
COLUMN_NAME DATA_TYPE
CONGRESS_ID NUMBER(3,0)
CONGREE_YEAR NUMBER(4,0)
WHITEHOUSE_PARTY VARCHAR2(20 BYTE)
PRESIDENT_NAME VARCHAR2(20 BYTE)
CONGRESS_NAME VARCHAR2(10 BYTE)
HOUSE_MAJORITY VARCHAR2(20 BYTE)
HOUSE_DEMOCRATS NUMBER(3,0)
HOUSE_REPUBLICANS NUMBER(3,0)
HOUSE_OTHERS NUMBER(3,0)
SENATE_MAJOIRTY VARCHAR2(20 BYTE)
SENATE_DEMOCRATS NUMBER(3,0)
SENATE_REPUBLICANS NUMBER(3,0)
SENATE_OTHERS NUMBER(3,0)
FOOTNOTE VARCHAR2(200 BYTE)
Step3 - Choose the dimensions that
apply to each fact table row
• For the business problem under consideration, we can have Political
Parties as one of the dimensions, so the fact table and dimension
tables are as follows:
Step4 - Identify the numeric facts that
will populate each fact table row
 
Once the fact and dimensional tables are in place, it is easy to identify
the numeric facts such as which company has the highest stock in
which year under which ruling party will become quite obvious. In this
scenario, the numeric fact is that the company Allstate Corp, in the
trade year 2005 has the maximum high stock of 1197.66 under
Democratic Party ruling with congress id 87.
 
QUERY 2
SELECT d.company_name, sum(s.volume) "Volume"
FROM SP500_EOD_STOCK_FACTS s,COMPANY_DIM d
WHERE s.TICKER_SYMBOL=d.TICKER_SYMBOL and
d.COMPANY_name is not null
GROUP BY cube(s.VOLUME), d.COMPANY_name order by "Volume"
desc;
QUERY 2 OUTPUT
COMPANY VOLUME
BANK OF AMERICA 465813622
GENERAL ELECTRIC 204452485
MICROSOFT CORP 148263502
PFIZER INC 141891968
E-TRADE 122969972
WELLS FARGO 109991283
CITI BANK 109892271
Dimension Table:
COMPANY_DIM
COLUMN NAME DATATYPE
TICKER_SYMBOL (PK) VARCHAR2(10)
COMPANY_NAME VARCHAR2(100)
COMPANY_LOCATION VARCHAR2(60)
COMPANY_ESTABLISHMENT_DATE DATE
NOTE VARCHAR2(150)
Dimension Table:
JULIAN_DAY_DIM
COLUMN NAME DATATYPE
JULIAN_DAY NUMBER(12)
ACTUAL_DATE DATE
DAY_NAME VARCHAR2(20 BYTE)
DAY_IN_YEAR NUMBER(3)
DAY_IN_MONTH NUMBER(3)
DAY_IN_WEEK NUMBER(3)
MONTH_NAME VARCHAR2(20 BYTE)
MONTH_NUM NUMBER(3)
YEAR_NAME VARCHAR2(40 BYTE)
YEAR_NUM NUMBER(3)
Dimension Table:
STOCK_EXCHANGE_DIM
COLUMN NAME DATATYPE
EXCHANGE_ID NUMBER(12)
EXCHANGE _DATE DATE
EXCHANGE _TIME TIMESTAMP
NUM_SHARES_EXCHANGE NUMBER
EXCHANGE_QTY VARCHAR2 (20BYTE)
EXCHANGE_COUNTRY VARCHAR2 (20BYTE)
EXCHANGE_PRICE VARCHAR2(20 BYTE)
DIMENSION MODEL
THANK YOU

DW DIMENSN MODELNG

  • 1.
    DIMENSION MODELLING ISM-6028 DIVYA RAJASRI TADI ISHRAINHUSSAIN MADHURI CHADALAPAKA SHWETHA THYAGARAJACHARY
  • 2.
    Dimensional Modeling • Thisapproach involves a set of techniques and concepts used in data warehouse design. It is design technique for databases intended to support end-user queries in a data warehouse. It is oriented around understandability and performance. • Dimensional modeling always uses the concepts of facts (measures), and dimensions (context). Facts are typically numeric values that can be aggregated, and dimensions are groups of hierarchies and descriptors that define the facts. For example, sales amount is a fact; timestamp, product, register#, store#, etc. are elements of dimensions. • Dimensional models are built by business process area, e.g. store sales, inventory, claims, etc. Because the different business process areas share some but not all dimensions, efficiency in design, operation, and consistency, is achieved using conformed dimensions.
  • 3.
    INTRODUCTION Fact Table •Stocks Fact DimensionTable •Political Parties: Information about ruling political parties and current presidency •Company: Information about the Companies involved in the stock market •Supply & Demand: Fluctuation in the stock price and the relative increase or decrease in the supply & demand •Hype: Popluarity of a product or company
  • 4.
    Step1 - Selectthe business process to model •There are various factors that are crucial while analyzing the stock market like Economy, Scandals, Politics, Hype, Supply and Demand, Natural disasters, expectation and speculation, war, politics, global events, news related to companies etc., The business model that can be built on the Stocks database is the stock value pertaining to various dimensions. •For instance, let’s consider the business problem as “finding the industry with the highest stock value in the past decade occurred under which political party’s reign and in which quarter.”
  • 5.
    QUERY SELECT S.COMPANY, S.GICS_SECTO,Q.TRADE_YEAR, P.CONGRESS_ID, P.CONGRESS_NAME,P.WHITEHOUSE_PARTY, MAX(Q.HIGH) AS MAX_HIGH FROM POLITICAL_PARTIES P,SP500_EOD_STOCKS E,STOCKS S, SP500_QUARTERLY_FACTS Q WHERE Q.TRADE_YEAR BETWEEN 2005 AND 2015 GROUP BY S.COMPANY,S.GICS_SECTOR,Q.TRADE_YEAR,P.CONGRESS_ID, P.CONGRESS_NAME, P.WHITEHOUSE_PARTY ORDER BY MAX(Q.HIGH) DESC
  • 6.
    Which yields thefollowing result snapshot that clearly indicates that in the past decade, the financial sector has the highest stock (1197.66) under the ruling of Democrats. COMPANY GICS_SECTOR TRADE_YEA R CONGRESS_ID CONGRESS_NAME WHITEHOUSE_PARTY MAX_HIGH Allstate Corp Financials 2005 87 87th Democrat 1197.66 Citigroup Inc. Financials 2005 87 87th Democrat 1197.66 Amgen Inc Health Care 2005 87 87th Democrat 1197.66 Broadcom Corporation Information Technology 2005 87 87th Democrat 1197.66 Anadarko Petroleum Corp Energy 2005 87 87th Democrat 1197.66 Adobe Systems Inc Information Technology 2005 87 87th Democrat 1197.66 Boston Scientific Health Care 2005 87 87th Democrat 1197.66 Becton Dickinson Health Care 2005 87 87th Democrat 1197.66 BMC Software Information Technology 2005 87 87th Democrat 1197.66 Apple Inc. Information Technology 2005 87 87th Democrat 1197.66
  • 7.
    Step2 - Declarethe grain of the business process The granularity of a dimension depends on how often it is modified. If the Political party dimension is considered, the POLITICAL_PARTIES table is modified only after every election or when change in the government takes place. So, we do not need a fine grain for this dimension. The political party dimension table is as follows:
  • 8.
    POLITICAL_PARTIES COLUMN_NAME DATA_TYPE CONGRESS_ID NUMBER(3,0) CONGREE_YEARNUMBER(4,0) WHITEHOUSE_PARTY VARCHAR2(20 BYTE) PRESIDENT_NAME VARCHAR2(20 BYTE) CONGRESS_NAME VARCHAR2(10 BYTE) HOUSE_MAJORITY VARCHAR2(20 BYTE) HOUSE_DEMOCRATS NUMBER(3,0) HOUSE_REPUBLICANS NUMBER(3,0) HOUSE_OTHERS NUMBER(3,0) SENATE_MAJOIRTY VARCHAR2(20 BYTE) SENATE_DEMOCRATS NUMBER(3,0) SENATE_REPUBLICANS NUMBER(3,0) SENATE_OTHERS NUMBER(3,0) FOOTNOTE VARCHAR2(200 BYTE)
  • 9.
    Step3 - Choosethe dimensions that apply to each fact table row • For the business problem under consideration, we can have Political Parties as one of the dimensions, so the fact table and dimension tables are as follows:
  • 10.
    Step4 - Identifythe numeric facts that will populate each fact table row   Once the fact and dimensional tables are in place, it is easy to identify the numeric facts such as which company has the highest stock in which year under which ruling party will become quite obvious. In this scenario, the numeric fact is that the company Allstate Corp, in the trade year 2005 has the maximum high stock of 1197.66 under Democratic Party ruling with congress id 87.  
  • 11.
    QUERY 2 SELECT d.company_name,sum(s.volume) "Volume" FROM SP500_EOD_STOCK_FACTS s,COMPANY_DIM d WHERE s.TICKER_SYMBOL=d.TICKER_SYMBOL and d.COMPANY_name is not null GROUP BY cube(s.VOLUME), d.COMPANY_name order by "Volume" desc;
  • 12.
    QUERY 2 OUTPUT COMPANYVOLUME BANK OF AMERICA 465813622 GENERAL ELECTRIC 204452485 MICROSOFT CORP 148263502 PFIZER INC 141891968 E-TRADE 122969972 WELLS FARGO 109991283 CITI BANK 109892271
  • 13.
    Dimension Table: COMPANY_DIM COLUMN NAMEDATATYPE TICKER_SYMBOL (PK) VARCHAR2(10) COMPANY_NAME VARCHAR2(100) COMPANY_LOCATION VARCHAR2(60) COMPANY_ESTABLISHMENT_DATE DATE NOTE VARCHAR2(150)
  • 14.
    Dimension Table: JULIAN_DAY_DIM COLUMN NAMEDATATYPE JULIAN_DAY NUMBER(12) ACTUAL_DATE DATE DAY_NAME VARCHAR2(20 BYTE) DAY_IN_YEAR NUMBER(3) DAY_IN_MONTH NUMBER(3) DAY_IN_WEEK NUMBER(3) MONTH_NAME VARCHAR2(20 BYTE) MONTH_NUM NUMBER(3) YEAR_NAME VARCHAR2(40 BYTE) YEAR_NUM NUMBER(3)
  • 15.
    Dimension Table: STOCK_EXCHANGE_DIM COLUMN NAMEDATATYPE EXCHANGE_ID NUMBER(12) EXCHANGE _DATE DATE EXCHANGE _TIME TIMESTAMP NUM_SHARES_EXCHANGE NUMBER EXCHANGE_QTY VARCHAR2 (20BYTE) EXCHANGE_COUNTRY VARCHAR2 (20BYTE) EXCHANGE_PRICE VARCHAR2(20 BYTE)
  • 16.
  • 17.