Download to read offline
![International Research Journal of Engineering and Technology (IRJET) e-ISSN: 2395 -0056
Volume: 04 Issue: 01 | Jan -2017 www.irjet.net p-ISSN: 2395-0072
© 2017, IRJET | Impact Factor value: 5.181 | ISO 9001:2008 Certified Journal | Page 1613
Mining of Medical Data to Identify Risk Factors of Heart Disease Using
Frequent Itemset
H K Shifali, Dr. B. Srinivasu, Rajashekar Shastry, B N Ranga Swamy
H K Shifali M.Tech
Dept. of Computer Science and Engineering, Stanley College of Engineering and Technology for Women
Telangana - Hyderabad, India.
Dr. B. Srinivasu Associate Professor, Rajashekar Shastry Assistant Professor
Dept. of Computer Science and Engineering, Stanley College of Engineering and Technology for Women
Telangana - Hyderabad, India.
B N Ranga Swamy Scientist ‘F’
Defence Electronics Research Laboratory (D.L.R.L)
Telangana - Hyderabad, India.
---------------------------------------------------------------------***---------------------------------------------------------------------
Abstract – - Data mining techniques are used in the field
of medicine for various purposes. The function of data
mining in biomedical information is remarkable one. Mining
association rule is one of the interesting topics. It was first
proposed for market basket analysis. In this project a
method has been implemented to identify risk factors having
heart disease through frequent Itemset. Frequent itemsets
are generated based on the attributes and minimum
support value. The extracted frequent itemsets help the
medical practitioner to make diagnostic decisions and
determine the risk level of patients at an early stage. The
proposed method can be applied to any medical dataset to
predict the risk factors with risk level of the patients based
on chosen factors.
Key Words: Data Mining, Heart Disease, Frequent
Itemset, prediction, missing values,
1. INTRODUCTION
Heart disease or cardiovascular disease is the class of
diseases that involve the heart or blood vessels (arteries
and veins). Heart disease was considered to be a man’s
problem, but now it is recognized as number one killer of
women, just as it is of men.
As described by National Heart Lung and Blood Institute
echo can detect possible blood clots inside the heart, fluid
buildup in the pericardium (the sac around the heart), and
problems with the aorta But, the interpretation of echo
recordings remains a challenge as it is time consuming. In
order to solve this and many other problems in the health
sector related to disease diagnosis. Data mining can be a
solution by generating rules from those enormous
datasets which can be used in echo readings. mining
include diverse techniques to extract the information from
a large database [1].
1.2 Problem Description
Clinical decisions are often made based on doctors’
intuition and experience rather than on the knowledge
rich data hidden in the database. This practice leads to
unwanted biases, errors and excessive medical costs
which affects the quality of service provided to patients.
The integration of clinical decision support with
computer‐based patient records could reduce medical
errors, enhance patient safety, decrease unwanted
practice variation, and improve patient outcome. Data
mining have shown a promising result in prediction of
heart disease. It is widely applied for prediction or
classification of different types of heart disease. The key
objective of the work is,
To identify key patterns or features from the
dataset.
To Identify and select attributes that are more
relevant in relation to heart disease diagnosis.
To analyze the results of the selected model with
the help of domain expert.
1.3 Basics and Background Knowledge
Data Mining is the core of the KDD process, involving the
inferring of algorithms that explore the data, develop the
model and discover previously unknown patterns. The
model is used for understanding phenomena from the
data, analysis and prediction [2].
Healthcare data analysis: healthcare data is diversified
due to the high dimensionality of the data comprising of
medical history records of patients having different
symptoms. Textual data analysis: Textual data is
commonly available in electronic documents or on social
networks.
1.3.1 Association Rule Discovery
The association task for data mining is the job of finding
which attributes “go together.” Association rules are of the](https://image.slidesharecdn.com/irjet-v4i1319-171111090029/75/Mining-of-medical-data-to-identify-risk-factors-of-heart-disease-using-frequent-itemset-1-2048.jpg)
![International Research Journal of Engineering and Technology (IRJET) e-ISSN: 2395 -0056
Volume: 04 Issue: 01 | Jan -2017 www.irjet.net p-ISSN: 2395-0072
© 2017, IRJET | Impact Factor value: 5.181 | ISO 9001:2008 Certified Journal | Page 1614
form “If antecedent, then consequent,” together with a
measure of the support and confidence associated with the
rule.
(Eq 1.1)
(Eq 1.2)
Association differs from classification in two ways: they
can “predict” any attribute, not just the class, and they can
predict more than one attribute’s value at a time [3].
1.3.2 Frequent Itemset
Frequent patterns are itemsets, subsequences, or
substructures that appear in a data set with frequency no
less than a user-specified threshold. Frequent pattern
mining was first proposed by Agrawal et al.[4] for market
basket analysis in the form of association rule mining.
1.3.3 Heart Disease
Heart disease or cardiovascular disease is the greatest
scourge afflicting the world. As with previous scourge-
bubonic plague, yellow fever, and smallpox;
cardiovascular disease not only strikes down a significant
fraction of the population without warning but causes
prolonged suffering and disability in an even larger
number. Simultaneously, remarkable progress has been
made in preventing and treating cardiovascular diseases
by medical and surgical means Braunwald et al., [5].
1.3.4 Major Types of Heart Disease
There are many types of heart disease, but in this study
the researcher chooses to discuss five types that are
common to happen. As described by Cindy [6], five
common types of heart disease are discussed below.
Congenital heart disease-heart doesn’t pump adequate
blood to the other organs in the body. Congestive heart
failure -heart disease which is passed down through the
family.Coronary heart disease (ischemic heart
disease)- -damage to the heart that happens because its
blood supply is decreased.Pulmonary heart disease-
disease that comes from lung, pulmonary, disorder.
Rheumatic heart disease derives from strep throat
infections.
2. LITERATURE SURVEY
Numerous works related to heart disease diagnosis using
data mining techniques have motivated this study.
K S Kavitha et al [7] performed a work on “Modeling and
design of evolutionary neural network for heart disease
detection” an alternative solution for complex medical
diagnosis in detection of heart disease where human
knowledge is apprehended in a general fashion.
AH Chen et al [8] developed a new system to predict heart
disease that can assist medical professionals in predicting
heart disease status based on the clinical data of patients.
An artificial neural network algorithm was developed for
classifying heart disease based on 13 important clinical
features.
Resul Das et al [9] introduced a methodology using SAS
Base Software9.1.3 for diagnosing of the valvular heart
disease. A neural networks ensemble method creates new
models by combining the posterior probabilities or the
predicted values from multiple predecessor models.
Carlos Ordonez [10] introduced an algorithm to searches
for association rules on a training set reduces the number
of rules using search constraints, and finally validates
them an independent test set. The discovered rules are
evaluated with support value, confidence value and lift.
Dubey et al. [11] performed a work on suggest the early
detection may help in providing better treatment and can
cure. They also suggest that the framework based on data
mining and optimization may predict diseases properly.
U.Chandrasekhar et al. [12] surveys various latest
frequent pattern mining algorithms on data streams to
understand various advantages and disadvantages, so they
provides a way of using new insights in the direction of
frequent pattern. The combination of optimization and
data mining is also suggested has gotten much
consideration and has been joined in numerous
enhancement issues, to be specific the system directing,
voyaging salesperson, quadratic task, and asset
assignment issues.
3. ARCHITECTURE
This section deals with the proposed method, system
architecture and short description of design process.
3.1 Proposed Method
We are proposing a method to predict the risk of heart
disease based on patience history. In this approach we do
not require training module, directly we can extract the
frequent patterns by which we can generate the attributes
that cause heart disease and rise early warnings to
patience. In this method attributes which are in columns
and patient records which are in rows are eliminated if
they do not satisfy support value and which leads to
dimension reduction from further analysis, if they do not
satisfy the chosen rules.](https://image.slidesharecdn.com/irjet-v4i1319-171111090029/75/Mining-of-medical-data-to-identify-risk-factors-of-heart-disease-using-frequent-itemset-2-2048.jpg)
![International Research Journal of Engineering and Technology (IRJET) e-ISSN: 2395 -0056
Volume: 04 Issue: 01 | Jan -2017 www.irjet.net p-ISSN: 2395-0072
© 2017, IRJET | Impact Factor value: 5.181 | ISO 9001:2008 Certified Journal | Page 1616
is the number of transactions that contains the item set X.
Therefore, Support (X=>Y) = Support (XUY).
Risk Factors
A condition or habit that makes a person more likely to
develop a disease can also increase the chances that an
existing disease will get worse.
4. IMPLEMENTATION
Based on the proposed system architecture in figure
3.1, the methodology is constructed into four
modules (1) data set collection (2) preprocessing (3)
data transformation (4) frequent Item set generation.
4.1 Dataset Description
The dataset used in this project is obtained from UCI
Repository of Cleveland database [36] containing 303
patience’s record. Below are the list of attributes and there
values.
Table 4.1 Attributes of Heart Disease Dataset
S.no Attribute
name
Type Values
1 Age Continuous In years
2 Sex Discrete 1=male 2=female
3 CP Discrete Value1=typical angina
Value2=atypical
angina
Value3=non-anginal
pain
Value4=asymptomatic
4 Trestbps Continuous In mm Hg on
Admission to the
Hospital
5 Chol Continous In mg/dl
6 Fbs Discrete Fasting blood sugar>
120mg/dl
True=1
False=0
7 RestECG Discrete Value0=normal
Value1=having ST-T
Wave abnormality
Value2=showing
probable
8 Thalach Continous Maximum heart rate
achieved
9 Exang Discrete Value1=yes
Value0=no
10 Old peak Continuous In number values
11 Slope Discrete Value1=up sloping
Value2=flat
Value3=down sloping
12 CA Discrete 0-3 value
13 Thal Discrete Value3=normal
Value6=fixed
Value7=reversible
Defect
14 Concept
Class
Discrete 5 types of values 0-4
The dataset is used by authors for different purpose; they
have used it to find the prediction of heart disease with
different algorithms and technique. Our aim is to find the
risk factor that causes heart disease. The Cleveland
database contains 75 attributes in which 14 attributes are
considered.
Table 4.2 Sample Dataset Structure
age sex cp trestbps chol fbs restECG thalach exang Oldpeak slope ca thal Concept
class
63 1 1 145 233 1 2 150 0 2.3 3 0 6 0
67 1 4 160 286 0 2 108 1 1.5 2 3 3 2
67 1 4 120 229 0 2 129 1 2.6 2 2 7 1
37 1 3 130 250 0 0 187 0 3.5 3 0 3 0
41 0 2 130 204 0 2 172 0 1.4 1 0 3 0
56 1 2 120 236 0 0 178 0 0.8 1 0 3 0
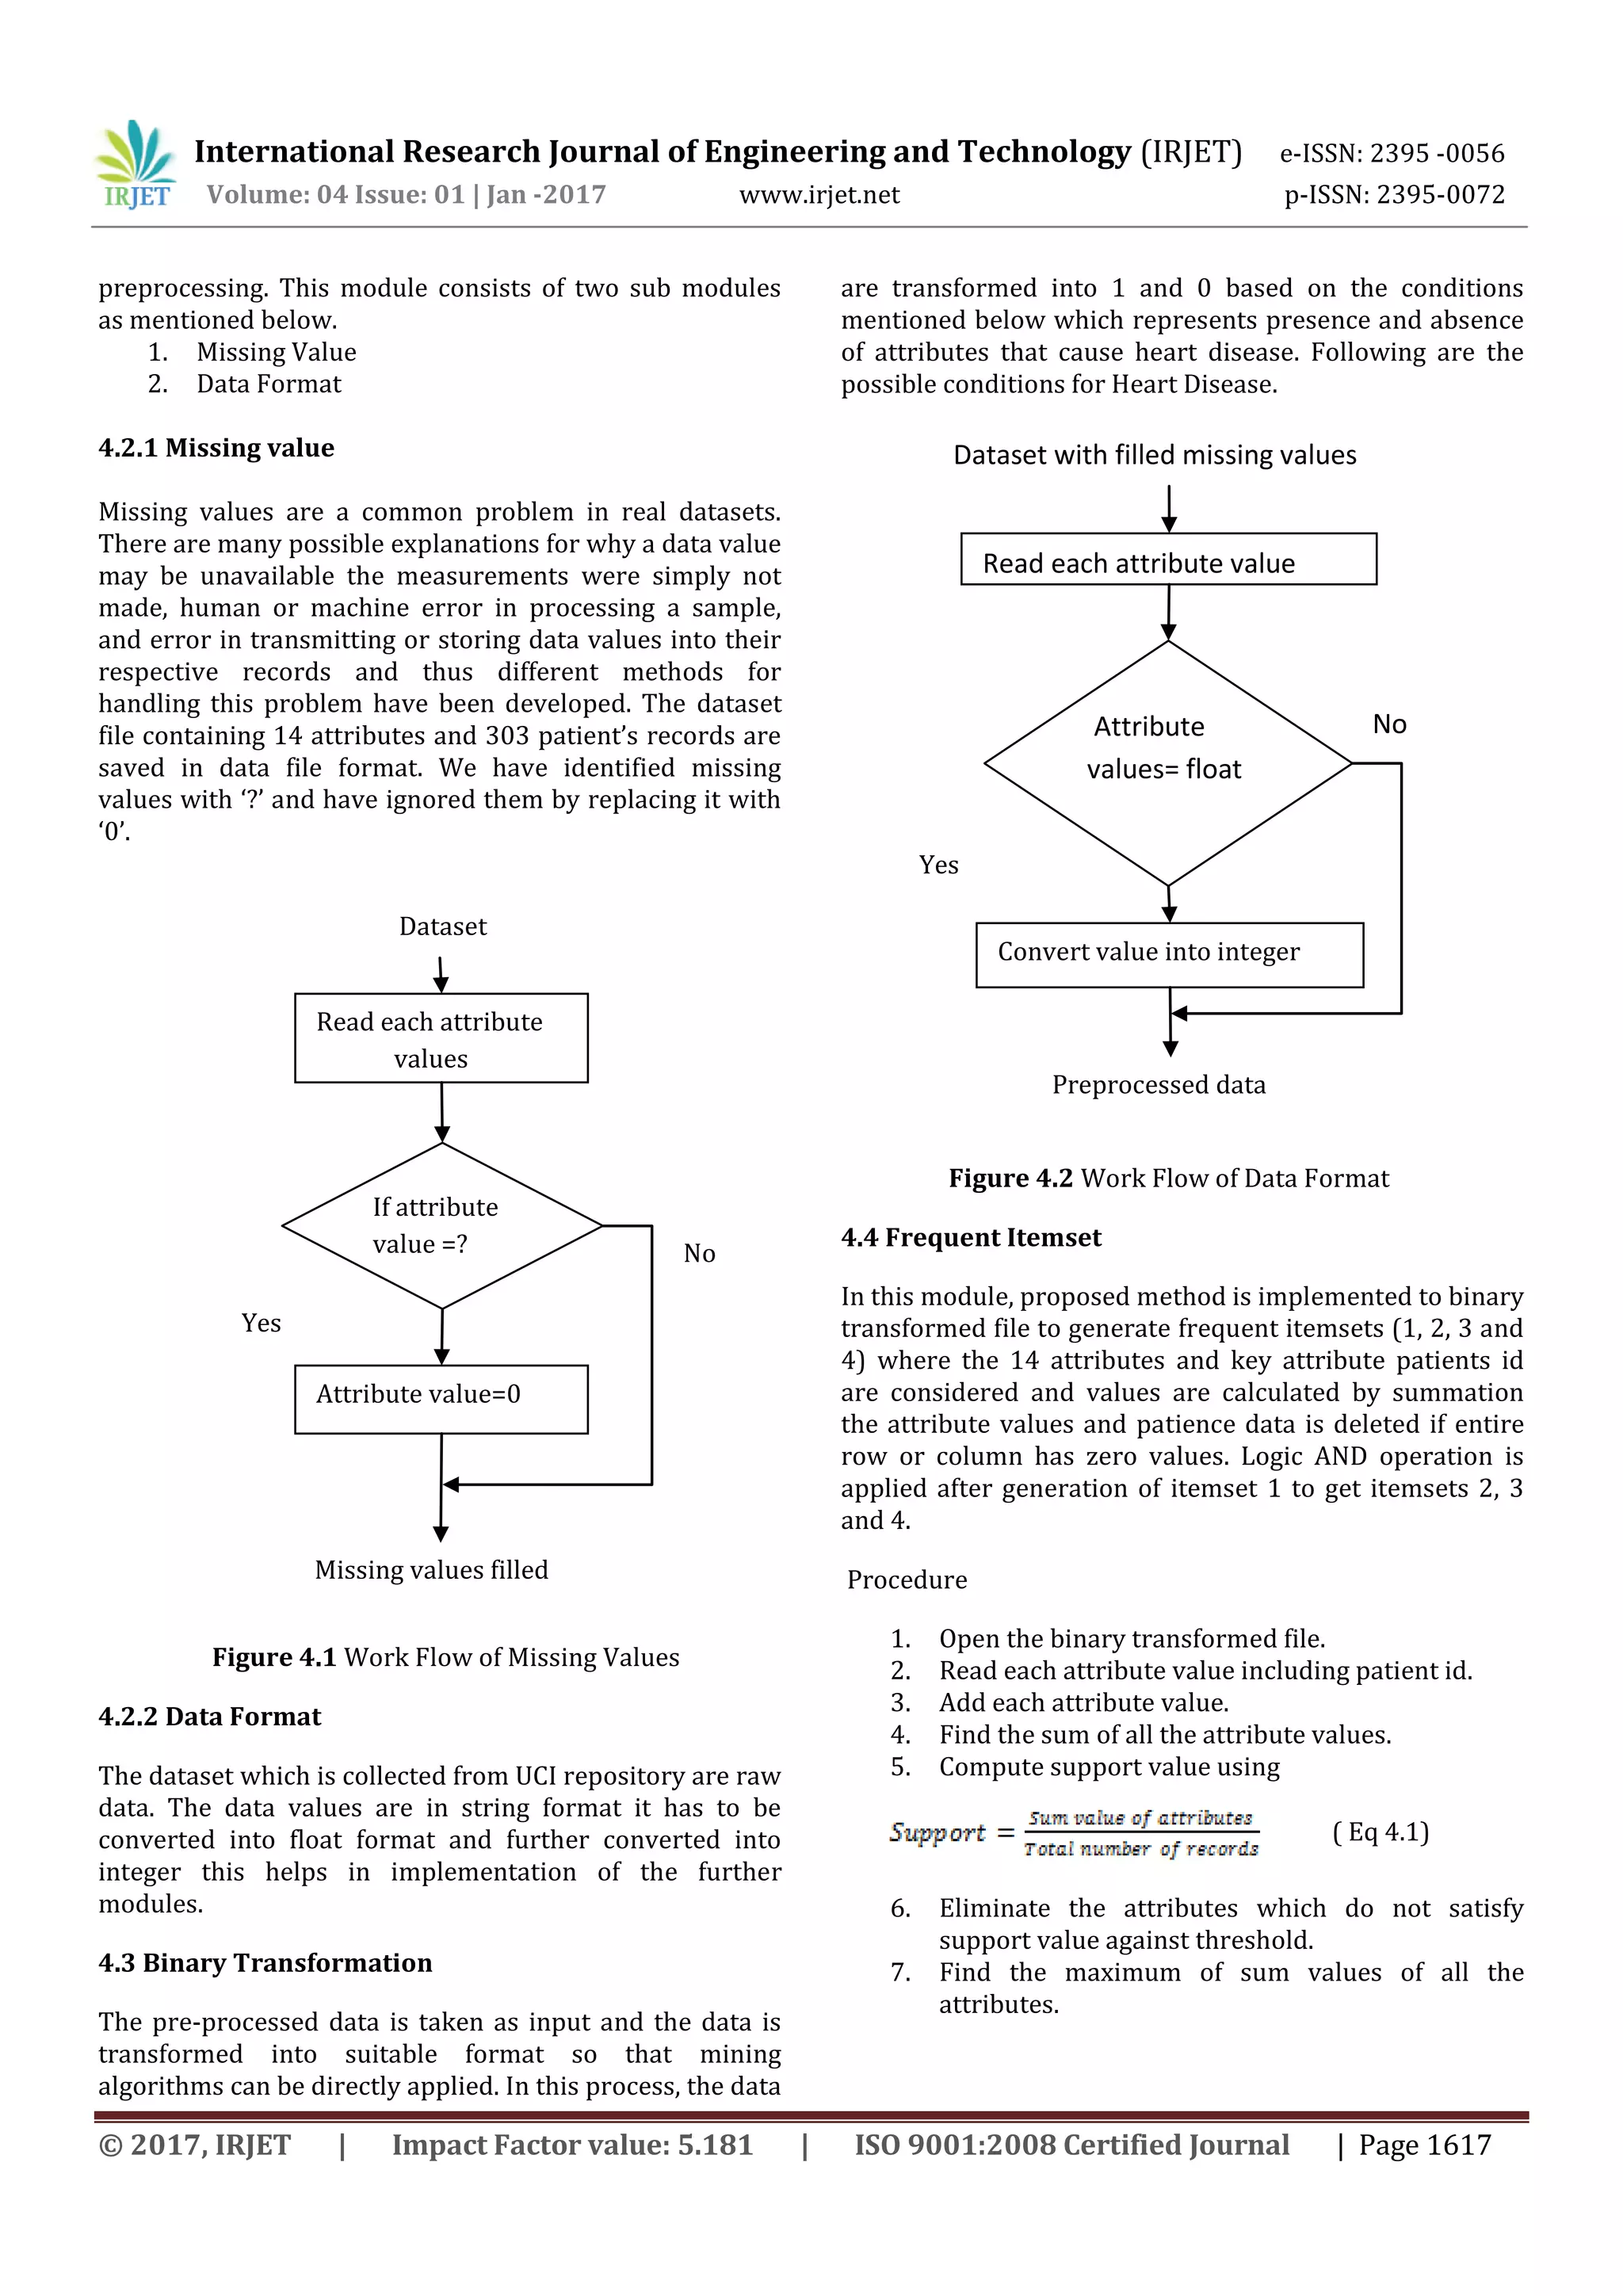
4.2 Preprocessing
Analyzing data that has not been carefully screened can
produce misleading results. If there is much irrelevant and
redundant information or noisy and unreliable data
reduces the performance. Removing such noisy data is](https://image.slidesharecdn.com/irjet-v4i1319-171111090029/75/Mining-of-medical-data-to-identify-risk-factors-of-heart-disease-using-frequent-itemset-4-2048.jpg)
![International Research Journal of Engineering and Technology (IRJET) e-ISSN: 2395 -0056
Volume: 04 Issue: 01 | Jan -2017 www.irjet.net p-ISSN: 2395-0072
© 2017, IRJET | Impact Factor value: 5.181 | ISO 9001:2008 Certified Journal | Page 1618
8. Apply logic AND operation between maximum
sum value of attribute with all the other
attributes.
9. Delete the row containing zero i.e. by deleting the
rows, patients who are not affected by the
attributes are eliminated for further analysis.
10. Repeat step 4 to 9.
11. Finally, frequent itemsets (1, 2, 3, and 4) are
generated.
12. All four frequent itemset show the pairs of risk
factors causing heart disease.
5. EXPERIMENT RESULTS
5.1 Result Analysis
The dataset used in this project is Cleveland Clinic
Foundation. Heart disease dataset is available at UCI
repository. The data set has 76 raw attributes. However,
all of the published experiments only refer to 13 of them
and one more attribute which specify the concept class.
The data set contains 303 patients’ records.
During implementation we found 6 missing values which
represents as ‘?’ in attributes slope and ca. In slope and ca
the missing values are 4 and 2 as mentioned in the below
table 5.1.
Table 5.1 Missing Values
Attributes name Missing values
Slope 4
CA 2
Total=6
The overall performance of the proposed approach for the
generation of frequent itemsets based on the support
calculation against support threshold.
We set the threshold to see the variations of frequent
itemsets from the above table we estimate that as the
threshold increases frequent itemsets decreases. The table
5.2 it depicts for 40% support threshold frequent itemset-
1 generates 11 risk factors whereas, for 50% support
threshold frequent itemset-1 generates 7 risk factors we
obtained four frequent itemsets. Similarly in frequent
itemsets – 2, 3 and 4 for threshold 40% 10, 13 and 6
respectively and for threshold 50% 7, 6, 3 respectively.
Table 5.2: Generation of Frequent Itemsets
Support
threshold
Iteration
Number
Selected Attribute
40% 1 [1,2,3,4,5,7,8,10,11,13]
2 [1,8,2,8,3,8,4,8,5,8,7,8,10,8,11,8,
13,8]
3 [1,2,8,1,3,8,1,4,8,1,5,8,1,7,8,1,11
8,2,4,8,2,13,8]
4 [1,2,4,8]
50% 1 [1,2,4,5,8,11]
2 [1,8,2,8,4,8,5,8,11,8]
3 [1,2,8,1,4,8]
4 [1,2,4,8]
Table 5.3 Number of Lexical chains generated.
Iteration
numbers
No of frequent itemsets
at threshold 40%
No of frequent
itemsets at
threshold 50%
1 11 7
2 10 6
3 13 3
4 6 0
Figure 5.1 Pattern Comparison
6. CONCLUSIONS
A new method has been developed to generate the
frequent itemsets based on the heart disease dataset
which is collected from UCI repository Cleveland Clinical](https://image.slidesharecdn.com/irjet-v4i1319-171111090029/75/Mining-of-medical-data-to-identify-risk-factors-of-heart-disease-using-frequent-itemset-6-2048.jpg)

This document describes a study that uses data mining techniques to identify risk factors for heart disease. The researchers apply frequent itemset mining to a dataset from the UCI Machine Learning Repository containing medical records. The goal is to extract frequent itemsets from the data based on a minimum support threshold. These frequent itemsets can then be used to determine attributes that are risk factors for heart disease. The proposed method does not require a training phase and can directly extract risk factor patterns from the data. This could help medical practitioners identify patients at high risk and make early diagnostic decisions. The researchers implement their approach in four steps: data collection, preprocessing to handle missing values and data formatting, data transformation to binary values, and frequent itemset generation to identify