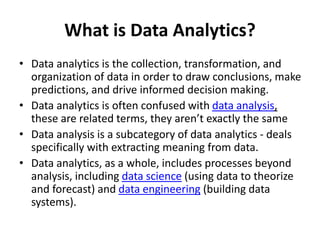
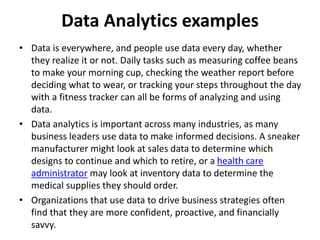
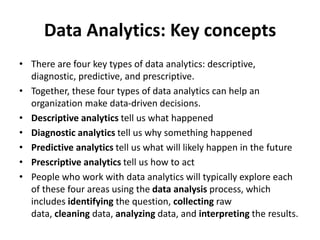
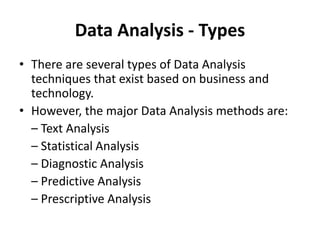
2. What is Data Analytics?
• Data analytics is the collection, transformation, and
organization of data in order to draw conclusions, make
predictions, and drive informed decision making.
• Data analytics is often confused with data analysis,
these are related terms, they aren’t exactly the same
• Data analysis is a subcategory of data analytics - deals
specifically with extracting meaning from data.
• Data analytics, as a whole, includes processes beyond
analysis, including data science (using data to theorize
and forecast) and data engineering (building data
systems).
3. What is Data Analytics?
• Data analytics is a multidisciplinary field that
employs a wide range of analysis techniques,
including math, statistics, and computer
science, to draw insights from data sets
• Data analytics is a broad term that includes
everything from simply analyzing data to
theorizing ways of collecting data and creating
the frameworks needed to store it
4. Data Analytics examples
• Data is everywhere, and people use data every day, whether
they realize it or not. Daily tasks such as measuring coffee beans
to make your morning cup, checking the weather report before
deciding what to wear, or tracking your steps throughout the day
with a fitness tracker can all be forms of analyzing and using
data.
• Data analytics is important across many industries, as many
business leaders use data to make informed decisions. A sneaker
manufacturer might look at sales data to determine which
designs to continue and which to retire, or a health care
administrator may look at inventory data to determine the
medical supplies they should order.
• Organizations that use data to drive business strategies often
find that they are more confident, proactive, and financially
savvy.
5. Data Analytics: Key concepts
• There are four key types of data analytics: descriptive,
diagnostic, predictive, and prescriptive.
• Together, these four types of data analytics can help an
organization make data-driven decisions.
• Descriptive analytics tell us what happened
• Diagnostic analytics tell us why something happened
• Predictive analytics tell us what will likely happen in the future
• Prescriptive analytics tell us how to act
• People who work with data analytics will typically explore each
of these four areas using the data analysis process, which
includes identifying the question, collecting raw
data, cleaning data, analyzing data, and interpreting the results.
6. Data Analysis
• Data analysis is defined as a process of
cleaning, transforming, and modeling data to
discover useful information for business
decision making.
• The purpose of Data Analysis is to extract
useful information from data and taking the
decision based upon the data analysis.
7. Data Analysis process
The data analysis process typically moves through several
iterative phases -
• Identify the business question you’d like to answer. What
problem is the company trying to solve? What do you need to
measure, and how will you measure it?
• Collect the raw data sets you’ll need to help you answer the
identified question. Data collection might come from internal
sources, like a company’s client relationship management (CRM)
software, or from secondary sources, like government records or
social media application programming interfaces (APIs).
• Clean the data to prepare it for analysis. This often involves
purging duplicate and anomalous data, reconciling
inconsistencies, standardizing data structure and format, and
dealing with white spaces and other syntax errors.
8. Data Analysis process
• Analyze the data - By manipulating the data using
various data analysis techniques and tools, you can
begin to find trends, correlations, outliers, and
variations that tell a story. During this stage, you might
use data mining to discover patterns within databases
or data visualization software to help transform data
into an easy-to-understand graphical format.
• Interpret the results of your analysis to see how well
the data answered your original question. What
recommendations can you make based on the data?
What are the limitations to your conclusions?
9. Data Analysis - Types
• There are several types of Data Analysis
techniques that exist based on business and
technology.
• However, the major Data Analysis methods are:
– Text Analysis
– Statistical Analysis
– Diagnostic Analysis
– Predictive Analysis
– Prescriptive Analysis
10. Text Analysis
• Text analysis, also known in the industry as
text mining, is the process of taking large sets
of textual data and arranging it in a way that
makes it easier to manage.
• By working through this cleansing process in
stringent detail, you will be able to extract the
data that is truly relevant to your business and
use it to develop actionable insights that will
propel you forward.
11. Descriptive Analysis
• Descriptive analysis tells us what happened.
This type of analysis helps describe or
summarize quantitative data by presenting
statistics. For example, descriptive statistical
analysis could show the distribution of sales
across a group of employees and the average
sales figure per employee.
• Descriptive analysis answers the question,
“what happened?”
12. Diagnostic Analysis
• If the descriptive analysis determines the “what,”
diagnostic analysis determines the “why.” Let’s
say a descriptive analysis shows an unusual influx
of patients in a hospital. Drilling into the data
further might reveal that many of these patients
shared symptoms of a particular virus. This
diagnostic analysis can help you determine that
an infectious agent—the “why”—led to the influx
of patients.
• Diagnostic analysis answers the question, “why
did it happen?”
13. Predictive Analysis
• Predictive analytics uses data to form
projections about the future. Using predictive
analysis, you might notice that a given product
has had its best sales during the months of
September and October each year, leading
you to predict a similar high point during the
upcoming year.
• Predictive analysis answers the question,
“what might happen in the future?”
14. Prescriptive Analysis
• Prescriptive analysis takes all the insights
gathered from the first three types of analysis
and uses them to form recommendations for how
a company should act. Using our previous
example, this type of analysis might suggest a
market plan to build on the success of the high
sales months and harness new growth
opportunities in the slower months.
• Prescriptive analysis answers the question,
“what should we do about it?”
15. Data-driven Decision-making (DDDM)
• Data-driven decision-making, sometimes abbreviated
to DDDM) can be defined as the process of making
strategic business decisions based on facts, data, and
metrics instead of intuition, emotion, or observation.
• This might sound obvious, but in practice, not all
organizations are as data-driven as they could be.
According to global management consulting firm
McKinsey Global Institute, data-driven companies are
better at acquiring new customers, maintaining
customer loyalty, and achieving above-average
profitability
16. Data Analysts vs. Data Scientists
• Data analysts typically work with structured data to solve
tangible business problems using tools like SQL, R or
Python programming languages, data visualization
software, and statistical analysis. Common tasks for a data
analyst might include:
• Collaborating with organizational leaders to identify
informational needs
• Acquiring data from primary and secondary sources
• Cleaning and reorganizing data for analysis
• Analyzing data sets to spot trends and patterns that can be
translated into actionable insights
• Presenting findings in an easy-to-understand way to inform
data-driven decisions
17. Data Analysts vs. Data Scientists
• Data scientists often deal with the unknown by using more
advanced data techniques to make predictions about the future.
They might automate their own machine learning algorithms or
design predictive modeling processes that can handle both
structured and unstructured data. This role is generally considered a
more advanced version of a data analyst. Some day-to-day tasks
might include:
• Gathering, cleaning, and processing raw data
• Designing predictive models and machine learning algorithms to
mine big data sets
• Developing tools and processes to monitor and analyze data
accuracy
• Building data visualization tools, dashboards, and reports
• Writing programs to automate data collection and processing
18. Data Engineering
• Data engineering is the practice of designing and building
systems for collecting, storing, and analyzing data at scale.
It is a broad field with applications in just about every
industry. Organizations have the ability to collect massive
amounts of data, and they need the right people and
technology to ensure it is in a highly usable state by the
time it reaches data scientists and analysts.
• Data engineers work in a variety of settings to build
systems that collect, manage, and convert raw data into
usable information for data scientists and business analysts
to interpret. Their ultimate goal is to make data
accessible so that organizations can use it to evaluate and
optimize their performance.
19. Data Scientist vs. data Engineer
• Data scientists and data analysts analyze data
sets to glean knowledge and insights. Data
engineers build systems for collecting,
validating, and preparing that high-quality
data. Data engineers gather and prepare the
data and data scientists use the data to
promote better business decisions.
20. Data Analytics skills
• Data analytics requires a wide range of skills to be performed
effectively
• Structured Query Language (SQL), a programming language
commonly used for databases
• Statistical programming languages, such as R and Python,
commonly used to create advanced data analysis programs
• Machine learning, a branch of artificial intelligence that
involves using algorithms to spot data patterns
• Probability and statistics, in order to better analyze and
interpret data trends
21. Data Analytics skills
• Data management, or the practices around collecting,
organizing and storing data
• Data visualization, or the ability to use charts and graphs to
tell a story with data
• Econometrics, or the ability to use data trends to create
mathematical models that forecast future trends based
While careers in data analytics require a certain amount of
technical knowledge, approaching the above skills
methodically—for example by learning a little bit each day or
learning from your mistakes—can help lead to mastery, and
it’s never too late to get started.
Editor's Notes
Structured Query Language (SQL), a programming language commonly used for databases
Statistical programming languages, such as R and Python, commonly used to create advanced data analysis programs
Machine learning, a branch of artificial intelligence that involves using algorithms to spot data patterns
Probability and statistics, in order to better analyze and interpret data trends
Data management, or the practices around collecting, organizing and storing data
Data visualization, or the ability to use charts and graphs to tell a story with data
Econometrics, or the ability to use data trends to create mathematical models that forecast future trends based