Downloaded 65 times

![MSc IT Part – I, Semester-1 Page No:- ________
DATA MINING Date:- ____________
Sonali. Parab.
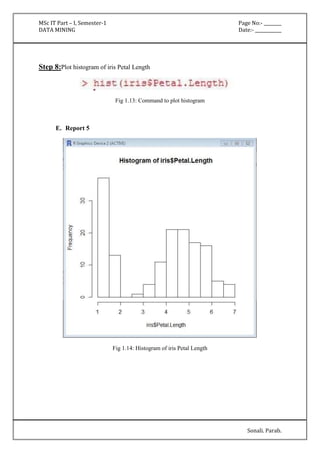
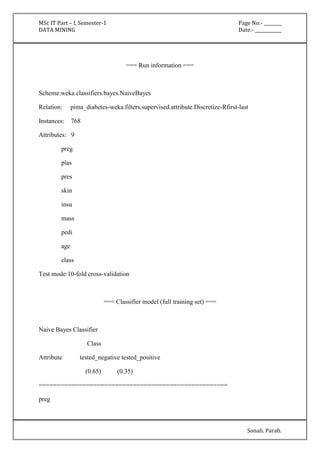
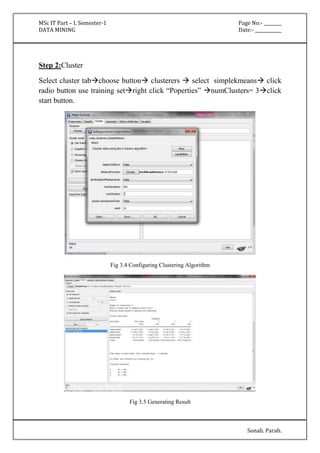
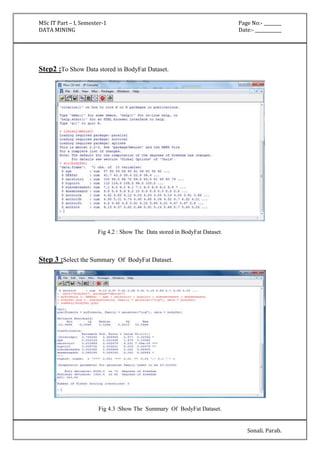
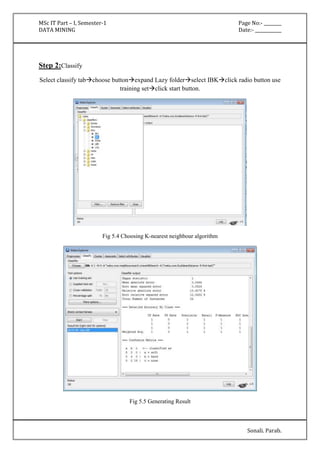
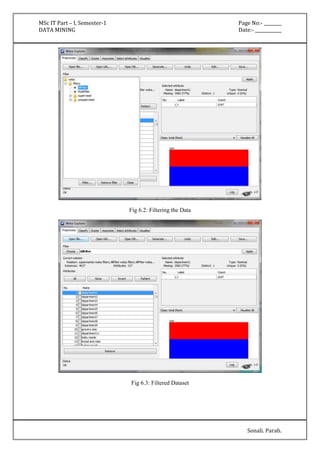
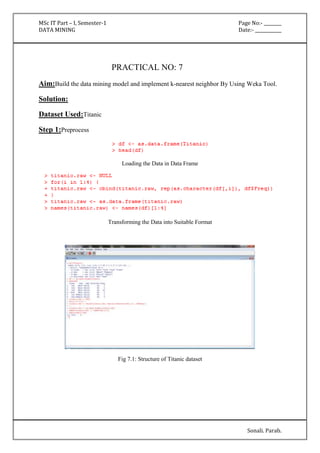
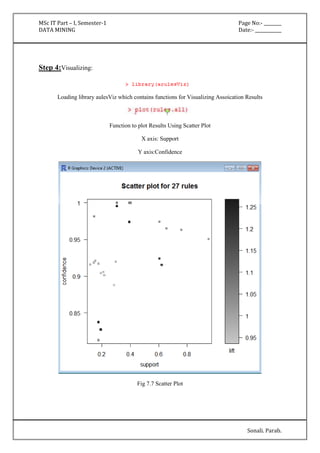
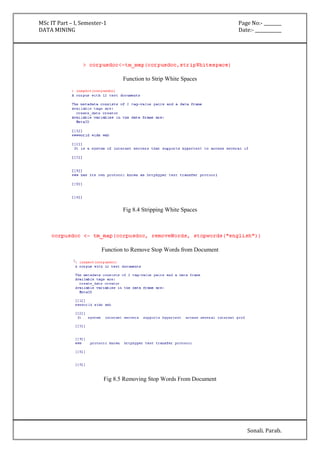
'(-inf-6.5]' 427.0 174.0
'(6.5-inf)' 75.0 96.0
[total] 502.0 270.0
plas
'(-inf-99.5]' 182.0 17.0
'(99.5-127.5]' 211.0 79.0
'(127.5-154.5]' 86.0 77.0
'(154.5-inf)' 25.0 99.0
[total] 504.0 272.0
pres
'All' 501.0 269.0
[total] 501.0 269.0
skin
'All' 501.0 269.0
[total] 501.0 269.0
insu
'(-inf-14.5]' 237.0 140.0
'(14.5-121]' 165.0 28.0
'(121-inf)' 101.0 103.0
[total] 503.0 271.0
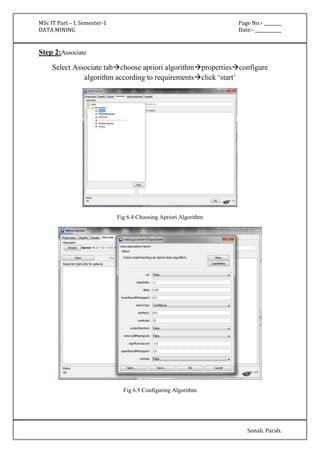
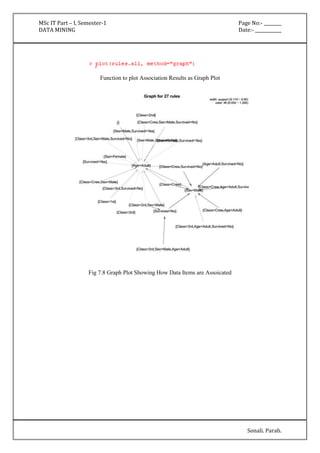
mass
'(-inf-27.85]' 196.0 28.0](https://image.slidesharecdn.com/datamining-141020132052-conversion-gate02/85/Data-Mining-12-320.jpg)
![MSc IT Part – I, Semester-1 Page No:- ________
DATA MINING Date:- ____________
Sonali. Parab.
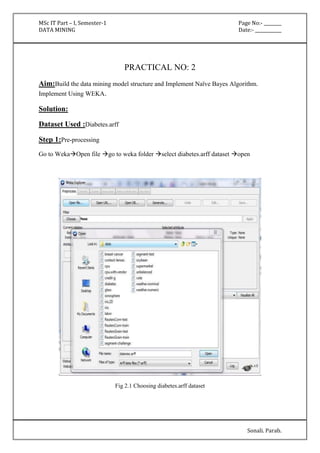
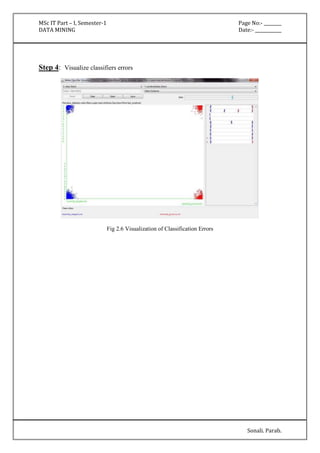
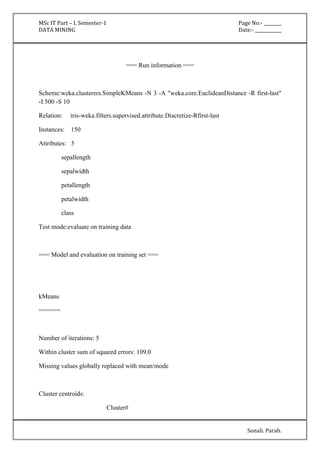
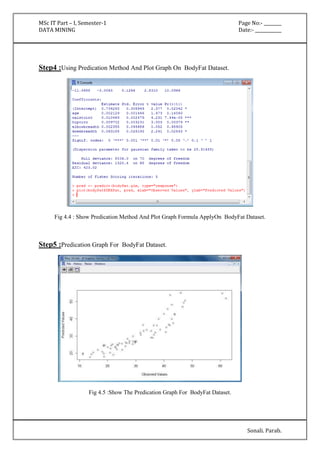
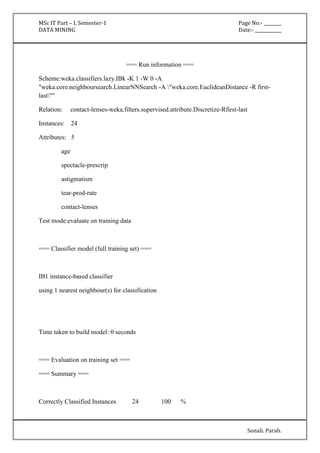
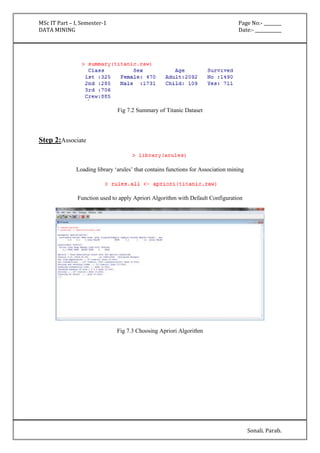
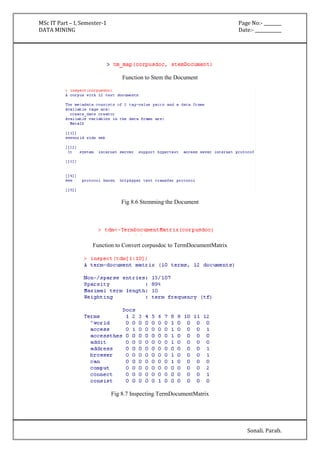
'(27.85-inf)' 306.0 242.0
[total] 502.0 270.0
pedi
'(-inf-0.5275]' 362.0 149.0
'(0.5275-inf)' 140.0 121.0
[total] 502.0 270.0
age
'(-inf-28.5]' 297.0 72.0
'(28.5-inf)' 205.0 198.0
[total] 502.0 270.0
Time taken to build model: 0 seconds](https://image.slidesharecdn.com/datamining-141020132052-conversion-gate02/85/Data-Mining-13-320.jpg)
![MSc IT Part – I, Semester-1 Page No:- ________
DATA MINING Date:- ____________
Sonali. Parab.
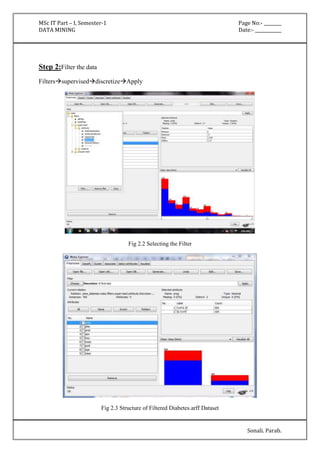
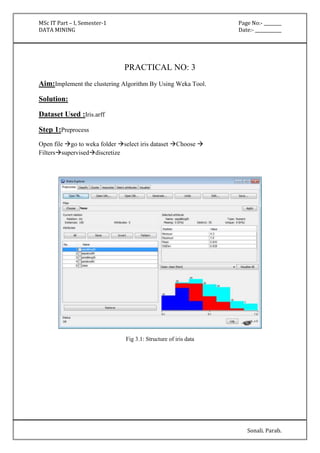
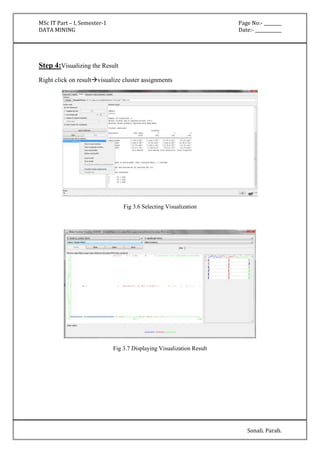
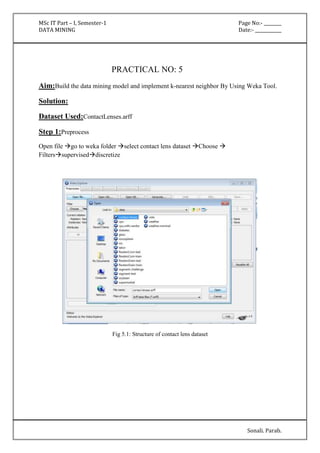
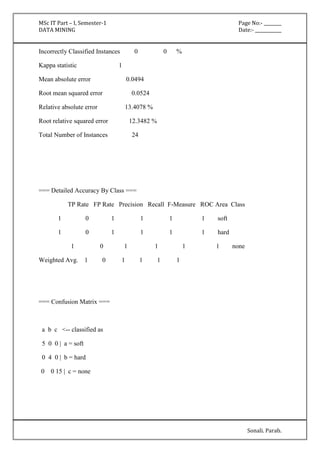
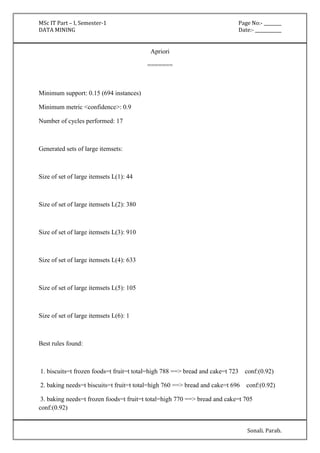
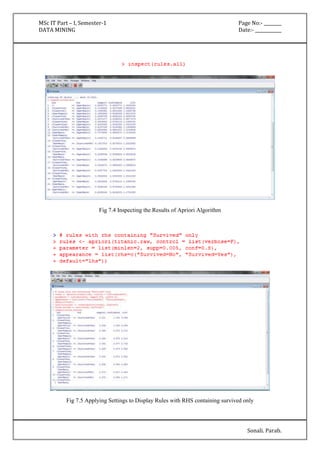
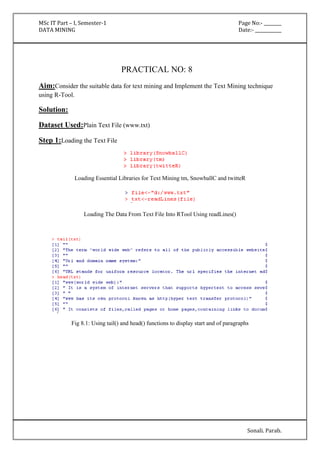
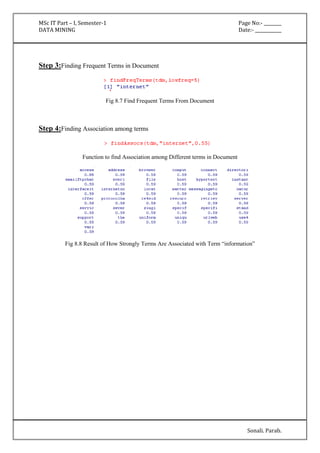
Attribute Full Data 0 1 2
(150) (50) (50) (50)
=====================================================
sepallength '(-inf-5.55]' '(-inf-5.55]' '(5.55-6.15]' '(6.15-inf)'
sepalwidth '(-inf-2.95]' '(3.35-inf)' '(-inf-2.95]' '(2.95-3.35]'
petallength '(4.75-inf)' '(-inf-2.45]' '(2.45-4.75]' '(4.75-inf)'
petalwidth '(0.8-1.75]' '(-inf-0.8]' '(0.8-1.75]' '(1.75-inf)'
class Iris-setosa Iris-setosa Iris-versicolor Iris-virginica
Time taken to build model (full training data) : 0 seconds
=== Model and evaluation on training set ===
Clustered Instances
0 50 ( 33%)
1 50 ( 33%)
2 50 ( 33%)](https://image.slidesharecdn.com/datamining-141020132052-conversion-gate02/85/Data-Mining-19-320.jpg)
![MSc IT Part – I, Semester-1 Page No:- ________
DATA MINING Date:- ____________
Sonali. Parab.
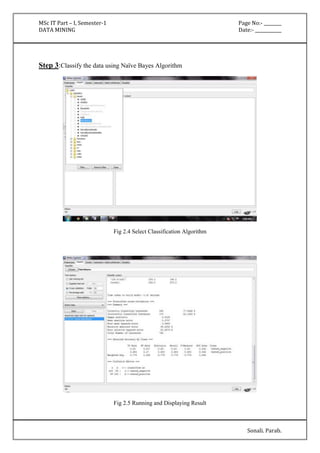
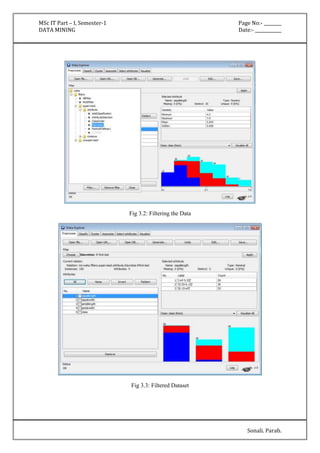
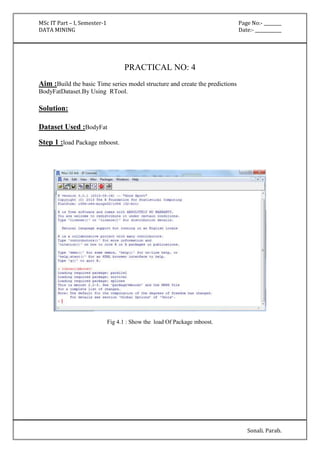
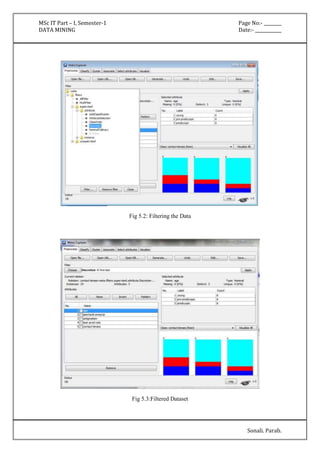
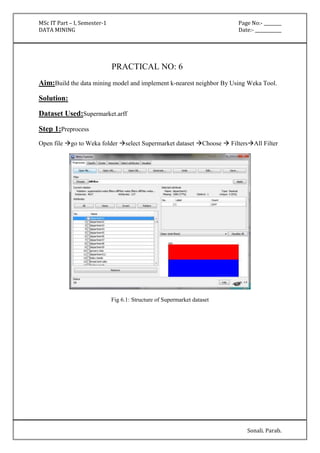
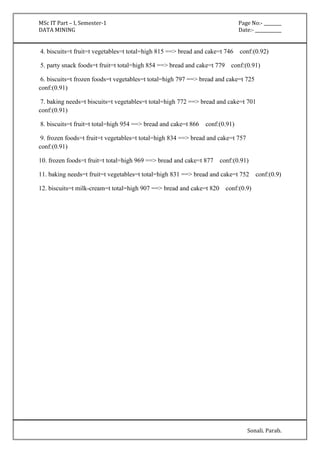
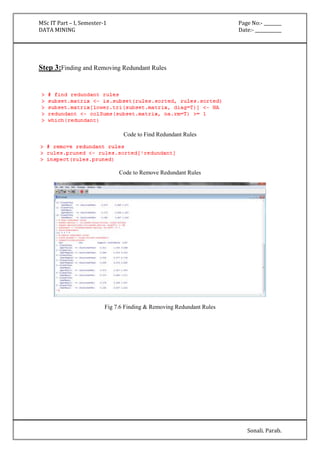
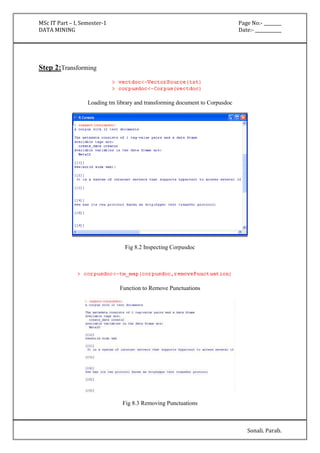
Fig 6.6 Displaying Association Results
=== Run information ===
Scheme: weka.associations.Apriori -N 12 -T 0 -C 0.9 -D 0.05 -U 1.0 -M 0.1 -S -1.0 -c -1
Relation: supermarket-weka.filters.AllFilter-weka.filters.AllFilter-weka.filters.AllFilter-weka.
filters.AllFilter-weka.filters.MultiFilter-Fweka.filters.AllFilter-weka.filters.AllFilter-weka.
filters.AllFilter
Instances: 4627
Attributes: 217
[list of attributes omitted]
=== Associator model (full training set) ===](https://image.slidesharecdn.com/datamining-141020132052-conversion-gate02/85/Data-Mining-32-320.jpg)

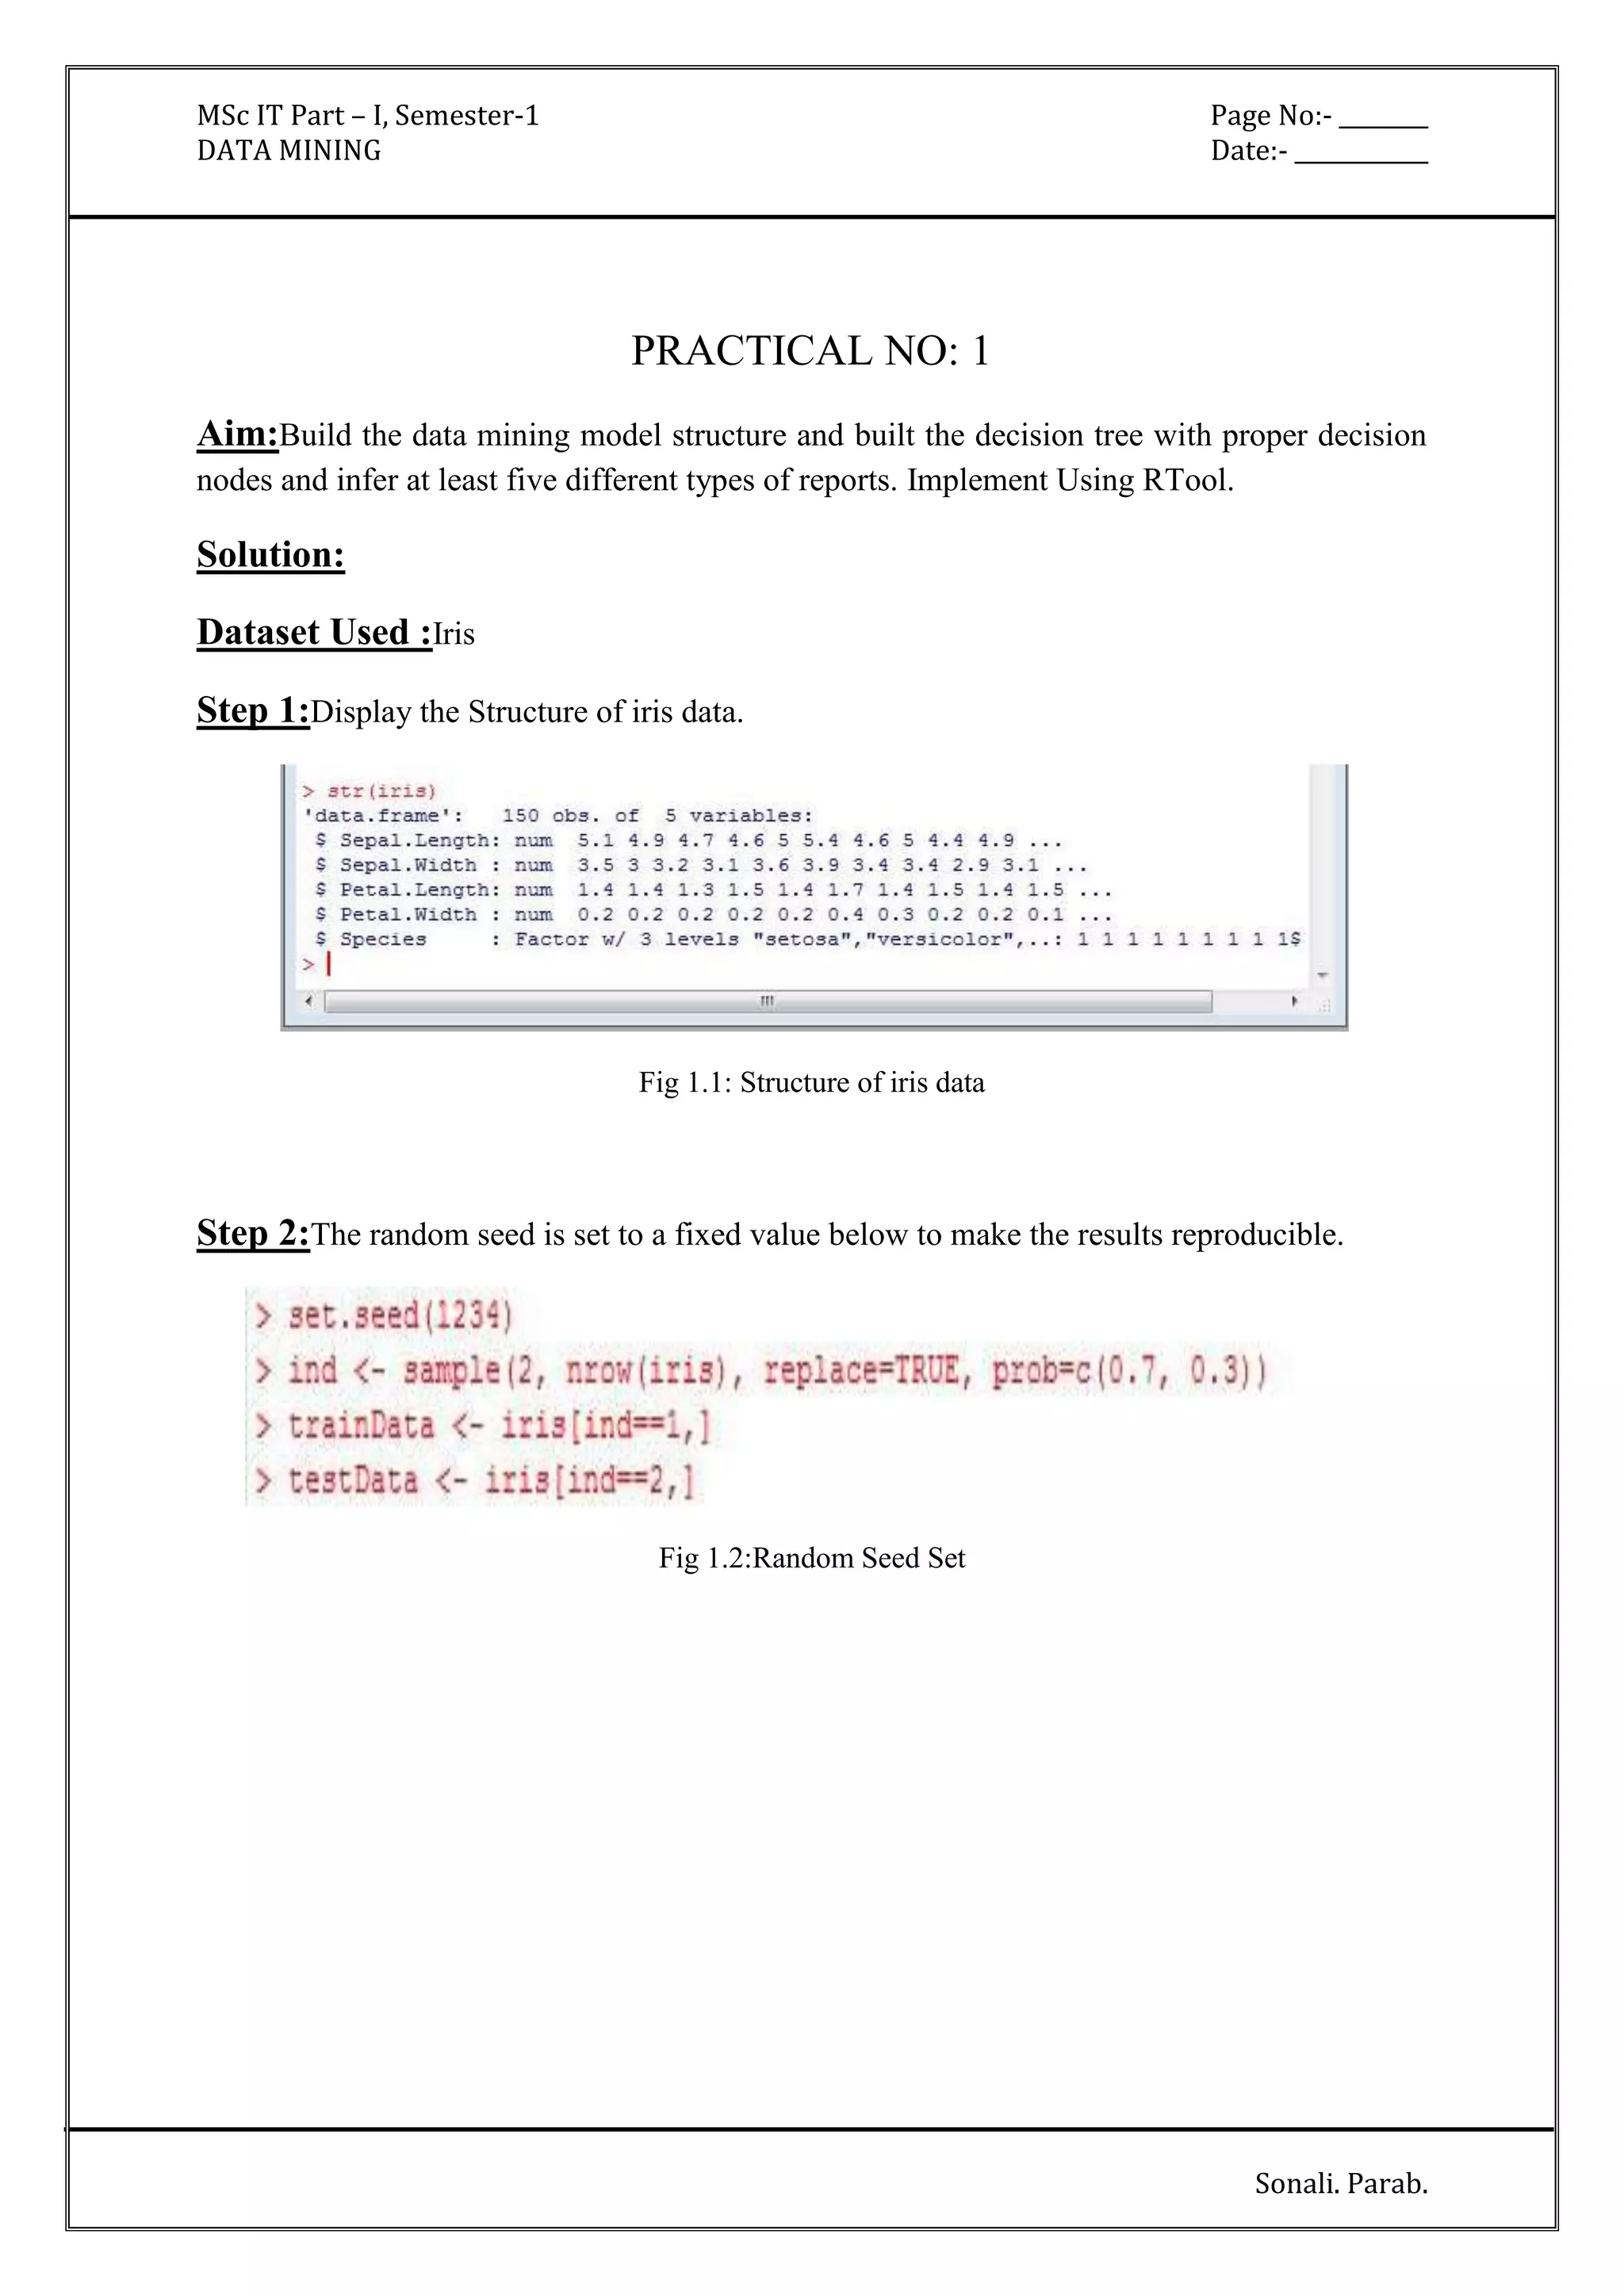
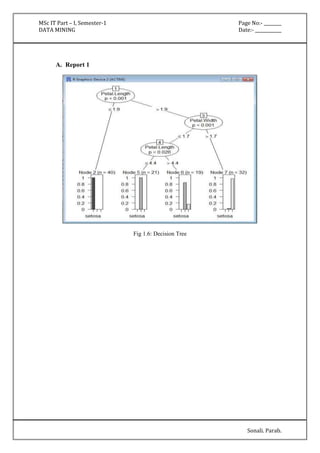
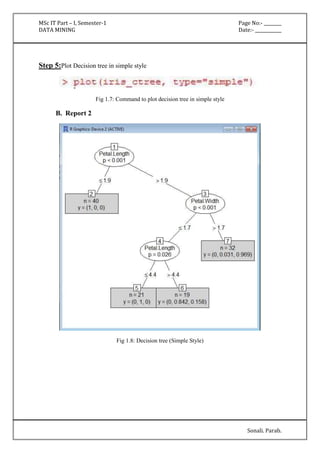
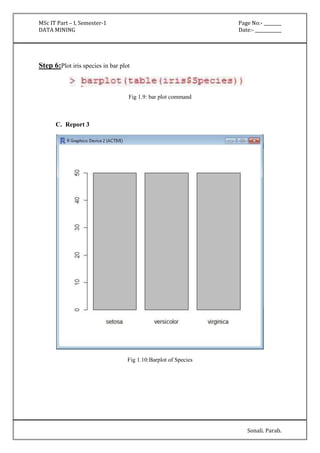
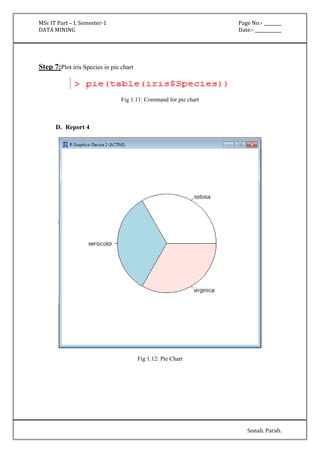
The document outlines various practical assignments for a Data Mining course using different datasets and tools like R and Weka. Each practical involves building models using algorithms such as decision trees, naive Bayes, k-nearest neighbors, and clustering techniques along with steps for data preprocessing and visualization. Key datasets include iris, diabetes, bodyfat, and contact lenses, with reports generated to analyze results.


![[Women in Data Science Meetup ATX] Decision Trees](https://cdn.slidesharecdn.com/ss_thumbnails/decisiontrees-161118165341-thumbnail.jpg?width=640&height=640&fit=bounds)