This document summarizes a study on using data mining techniques like multiple linear regression and density-based clustering to estimate crop production in East Godavari district of India. Multiple linear regression and density-based clustering were used to model the relationship between crop production and factors like rainfall, area sown, fertilizer use. The estimated values from both techniques were found to have a percentage difference ranging from -14% to 13% when compared to actual production values, indicating the techniques can adequately estimate crop production. Tables of actual versus estimated values using both techniques are provided for comparison.
FLOW OF SEMINAR
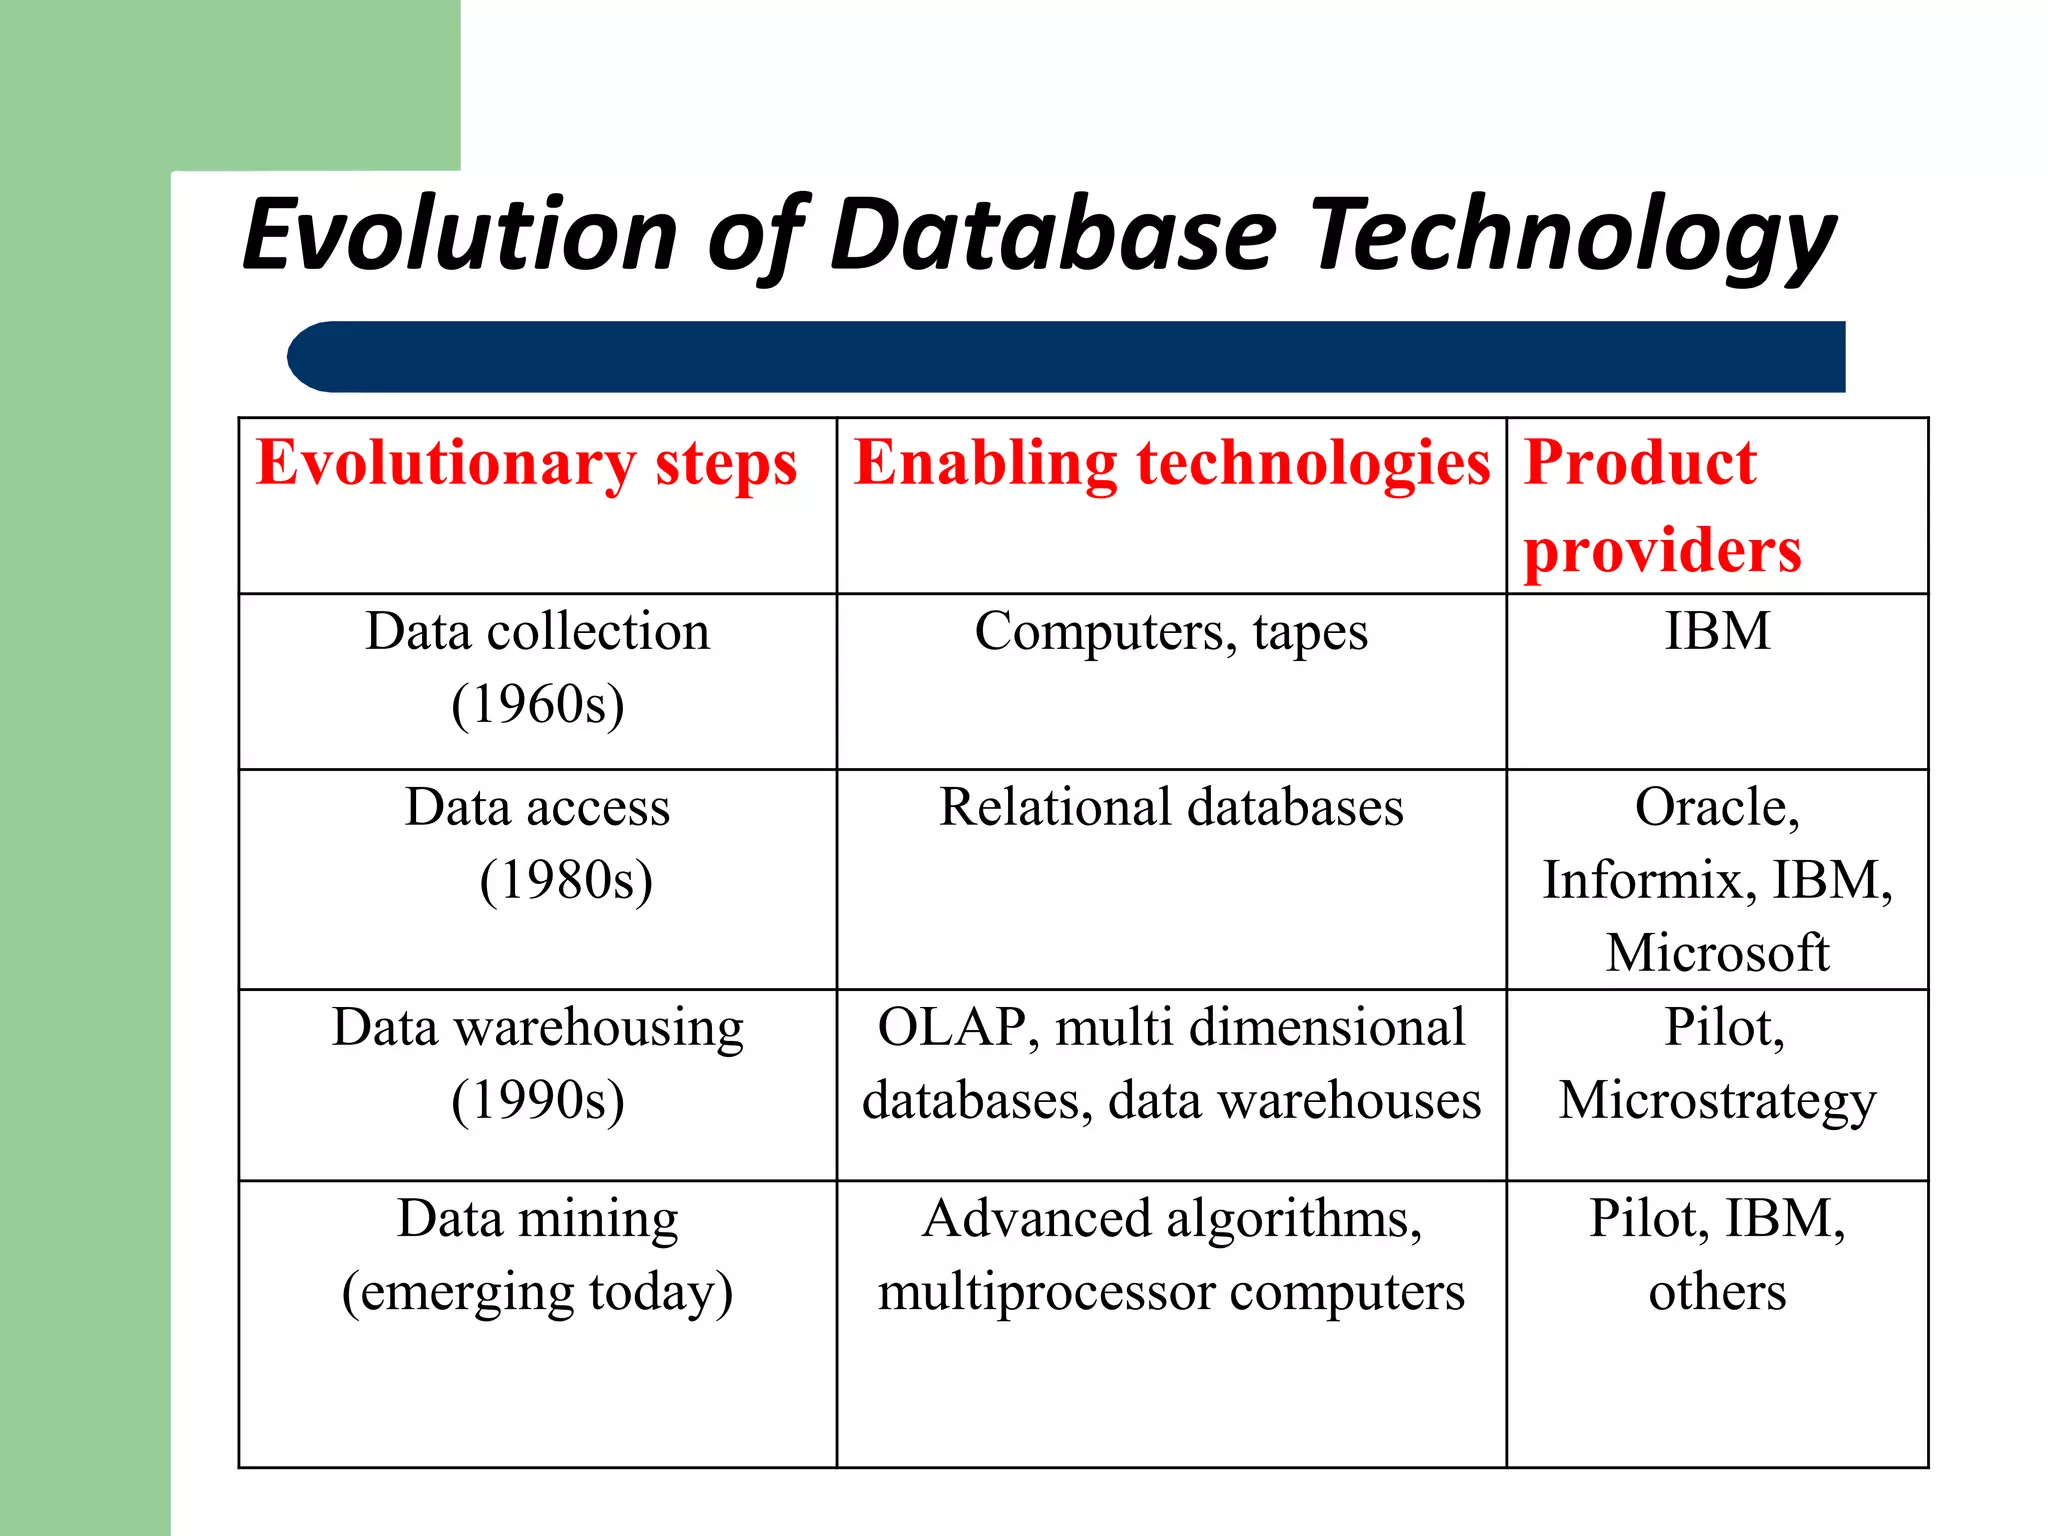
INTRODUCTION
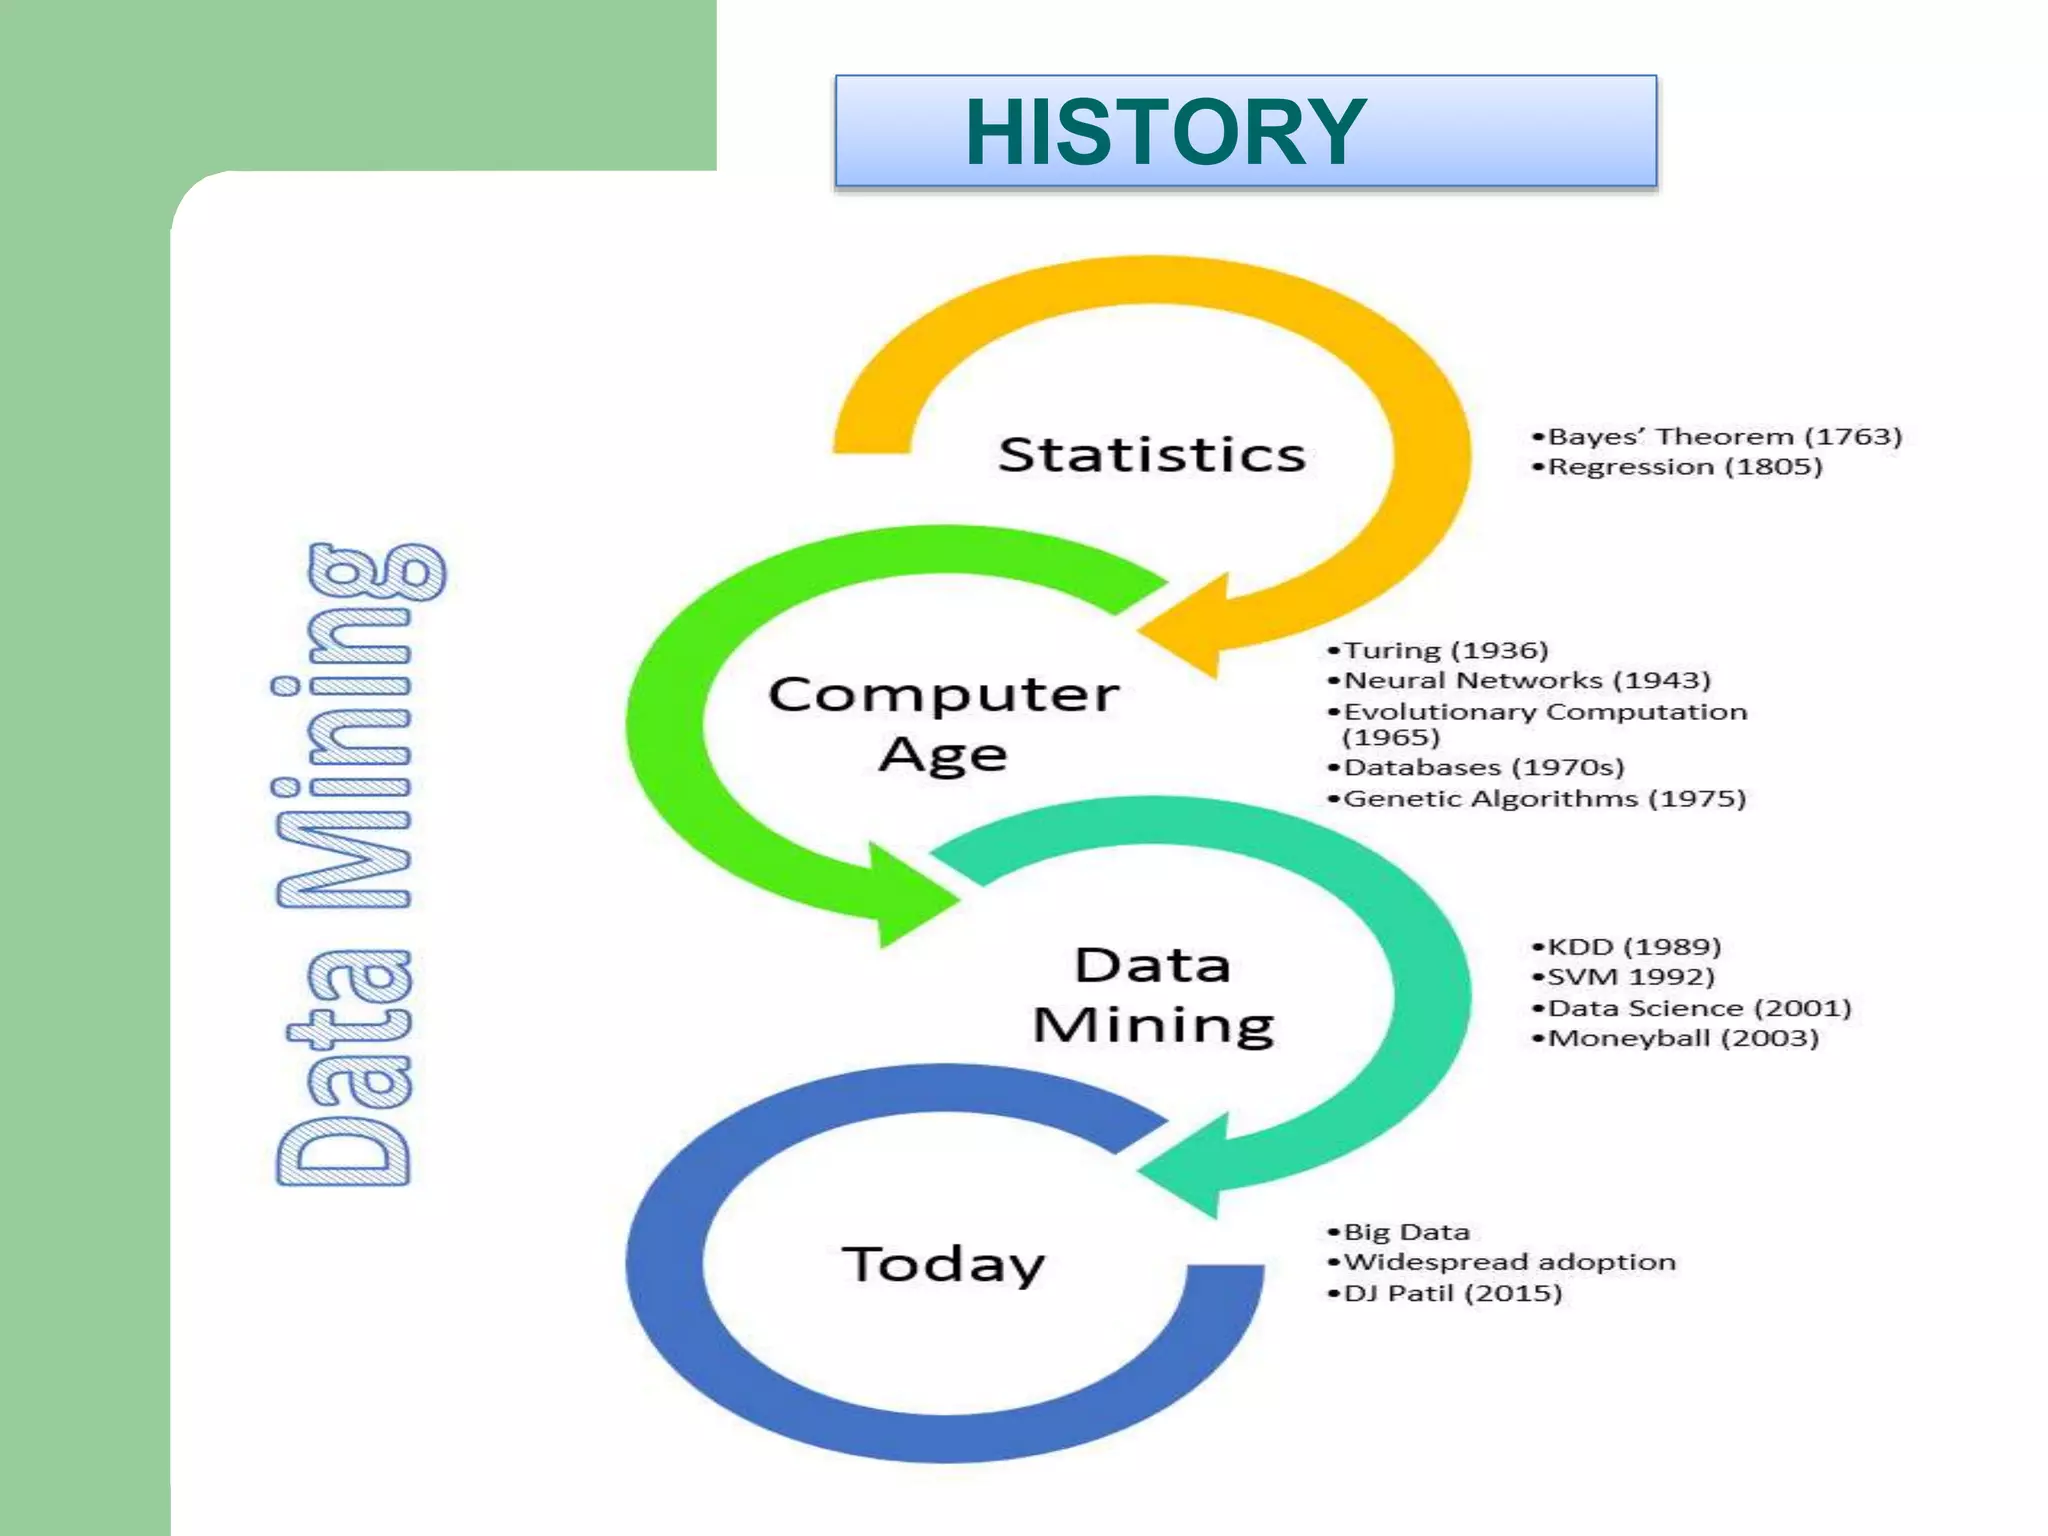
HISTORY
STEPS IN DATA MINING
GOALS OF DATA MINING
TECHNIQUES USED IN DATA MINING
DATA MINING METHODOLOGIES
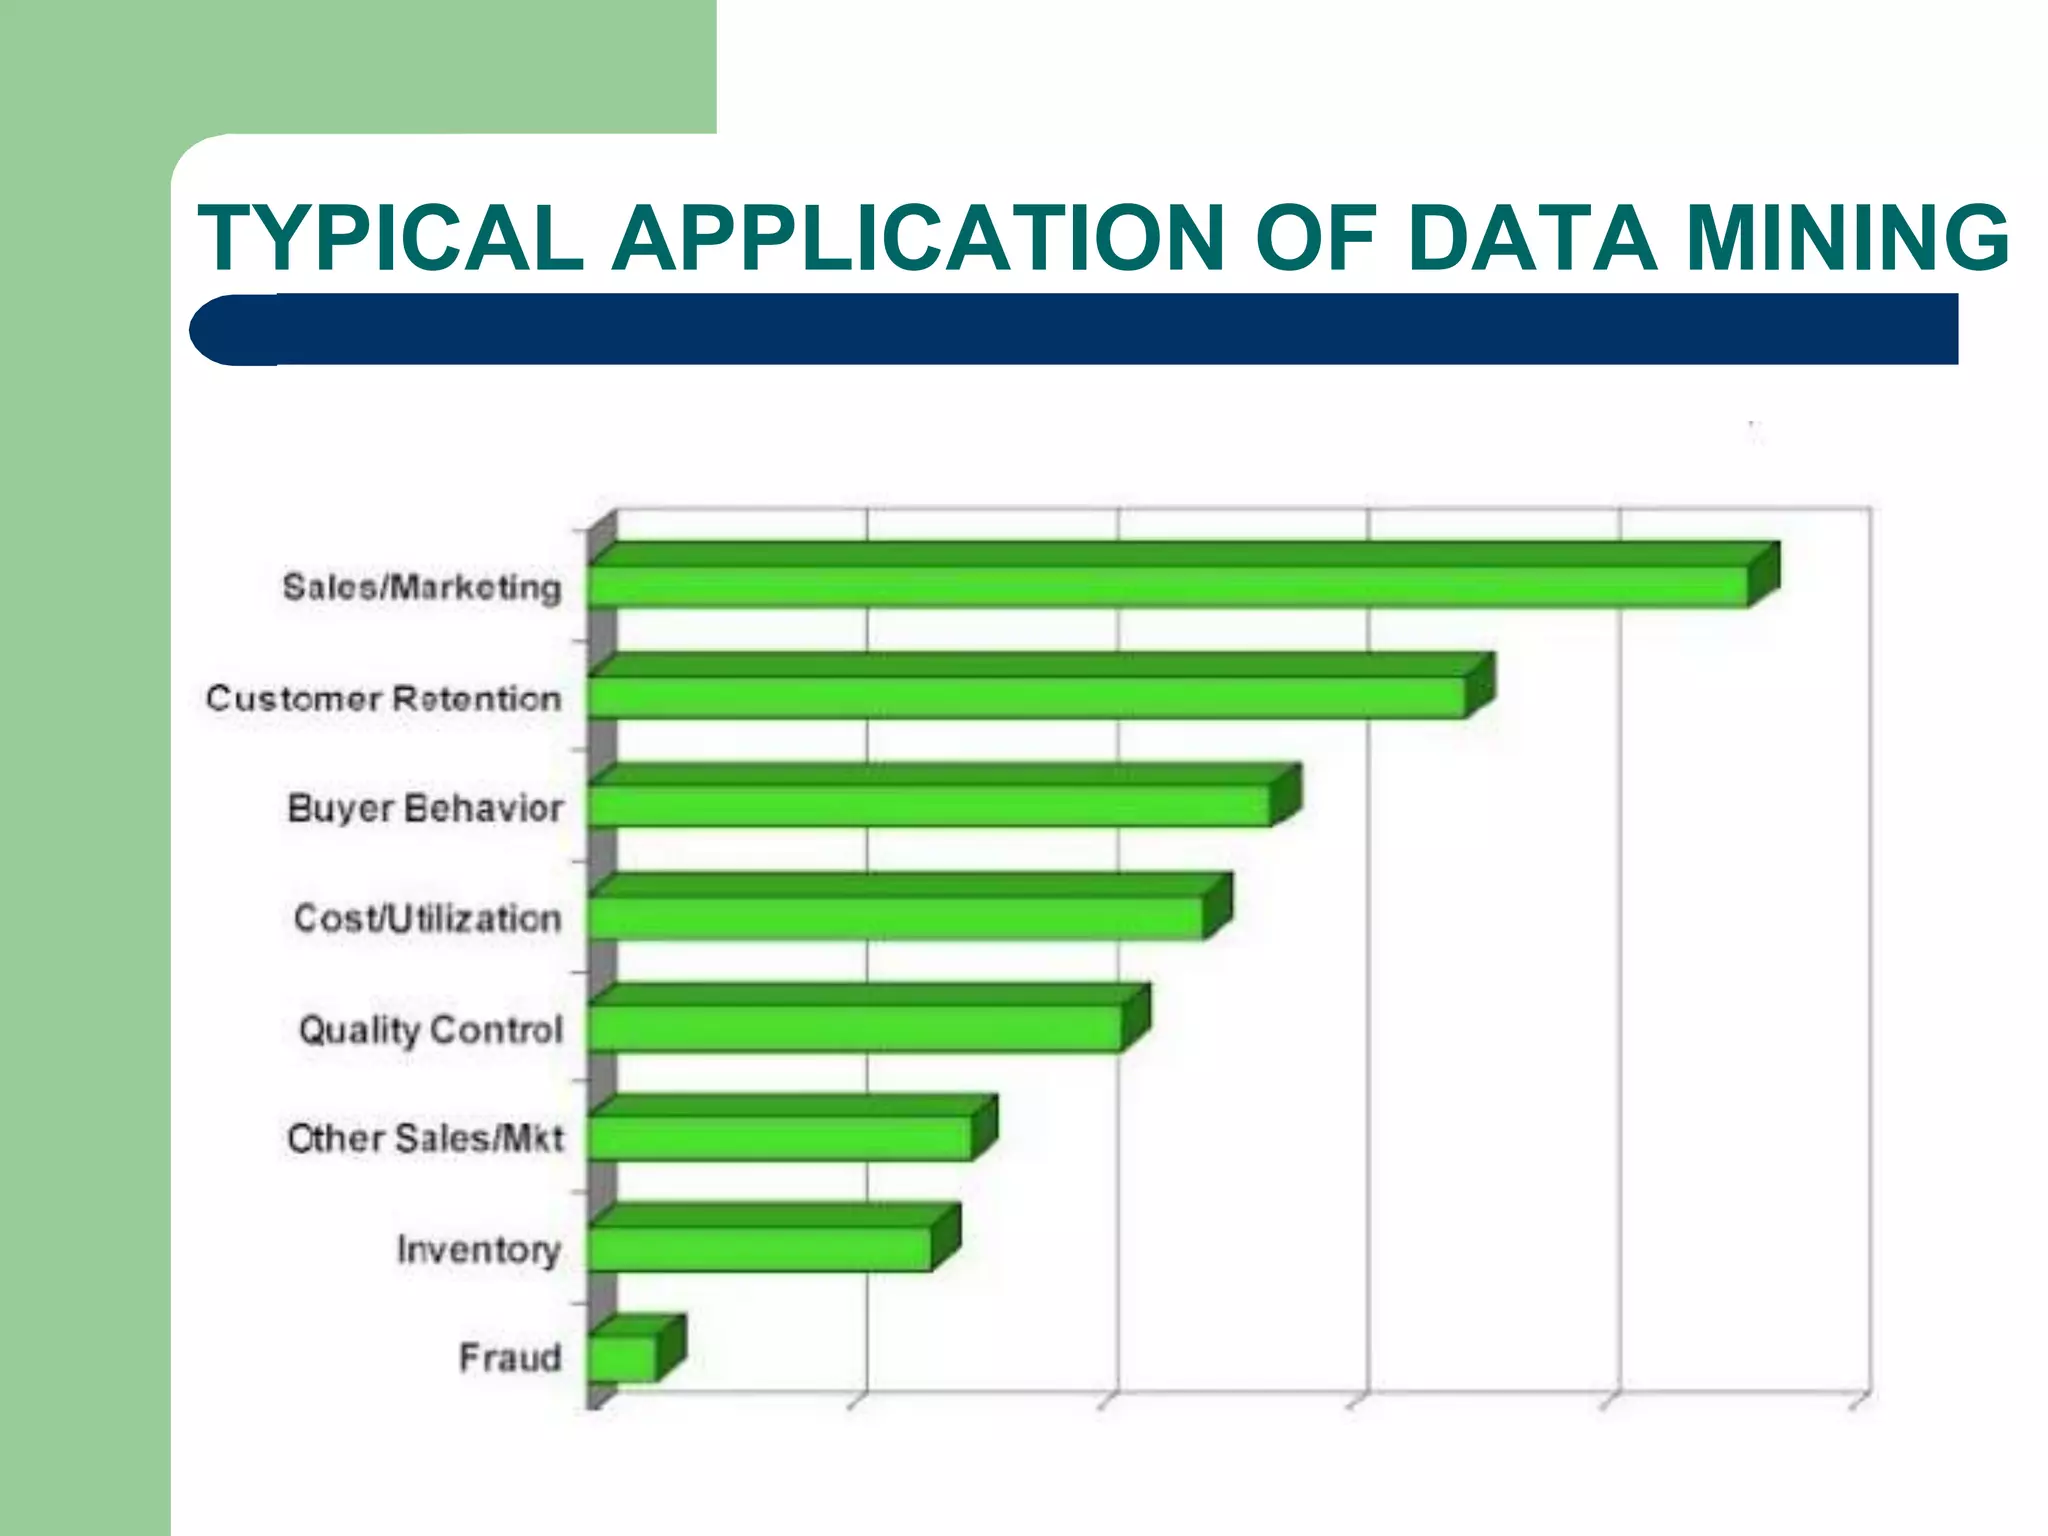
ROLE OF DATA MINING IN AGRICULTURE
CASE STUDIES
CONCLUSION
REFERENCES
3.
INTRODUCTION
Agriculture isthe backbone of the Indian nation.
Demand of food is increasing due to low Productivity of
agriculture production.
Agricultural researches put extra effort for more production.
Agricultural data acquisition rapidly increases these data to
be extracted when needed .
Data mining can be used for predicting the future trends of
agricultural processes.
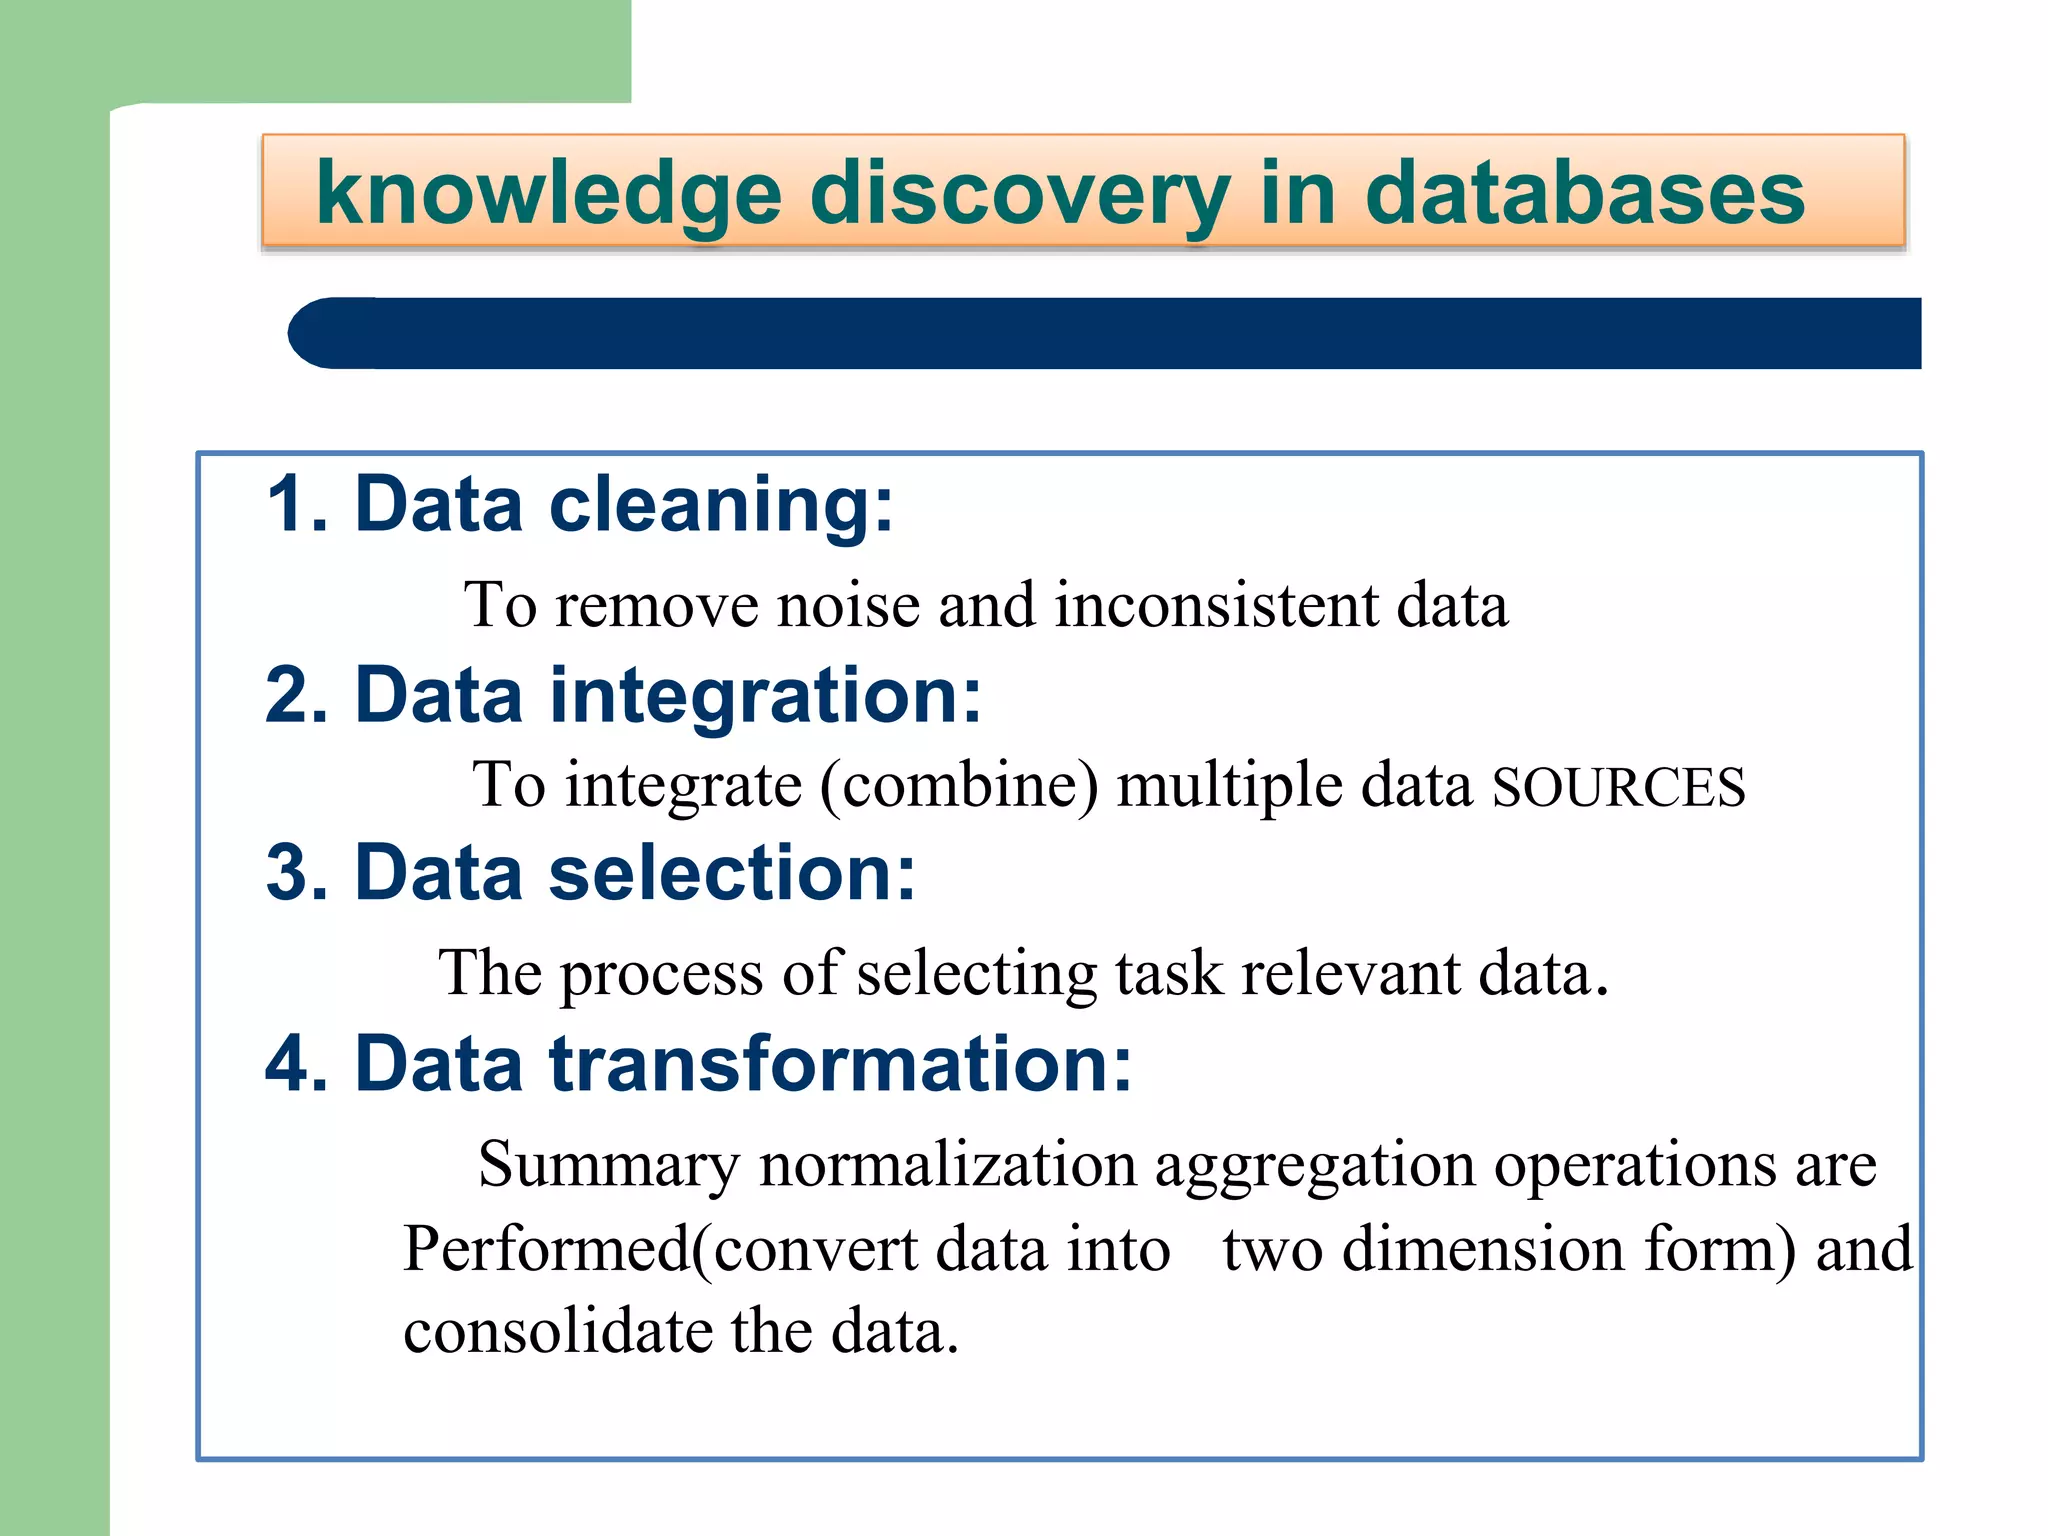
knowledge discovery indatabases
1. Data cleaning:
To remove noise and inconsistent data
2. Data integration:
To integrate (combine) multiple data SOURCES
3. Data selection:
The process of selecting task relevant data.
4. Data transformation:
Summary normalization aggregation operations are
Performed(convert data into two dimension form) and
consolidate the data.
8.
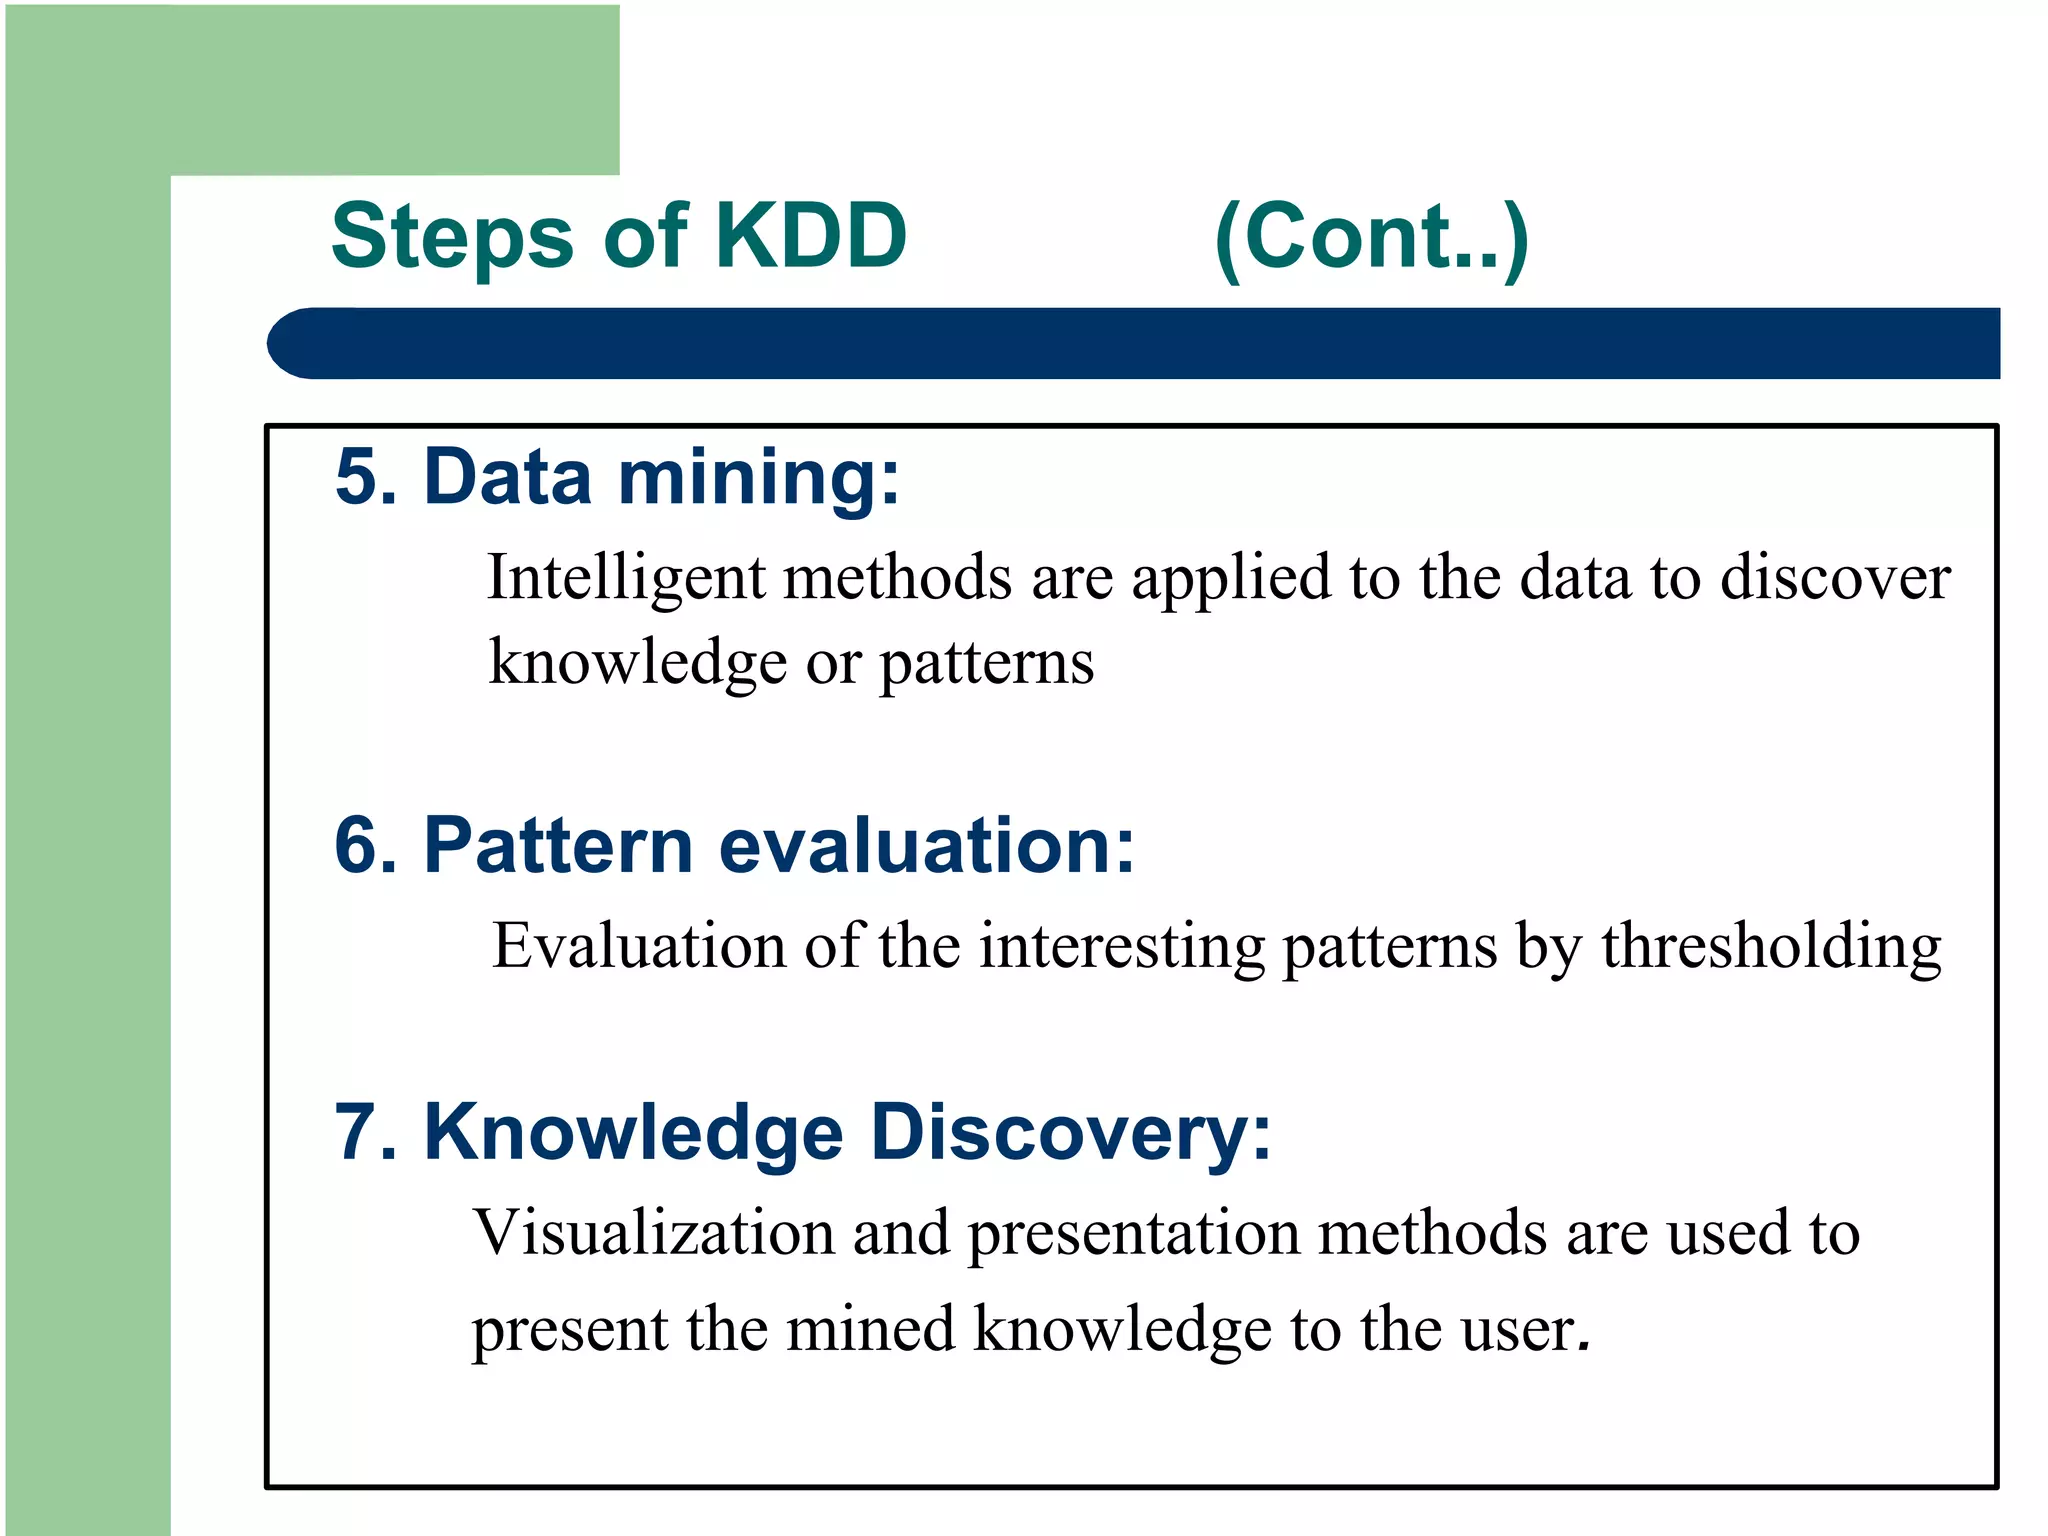
Steps of KDD(Cont..)
5. Data mining:
Intelligent methods are applied to the data to discover
knowledge or patterns
6. Pattern evaluation:
Evaluation of the interesting patterns by thresholding
7. Knowledge Discovery:
Visualization and presentation methods are used to
present the mined knowledge to the user.
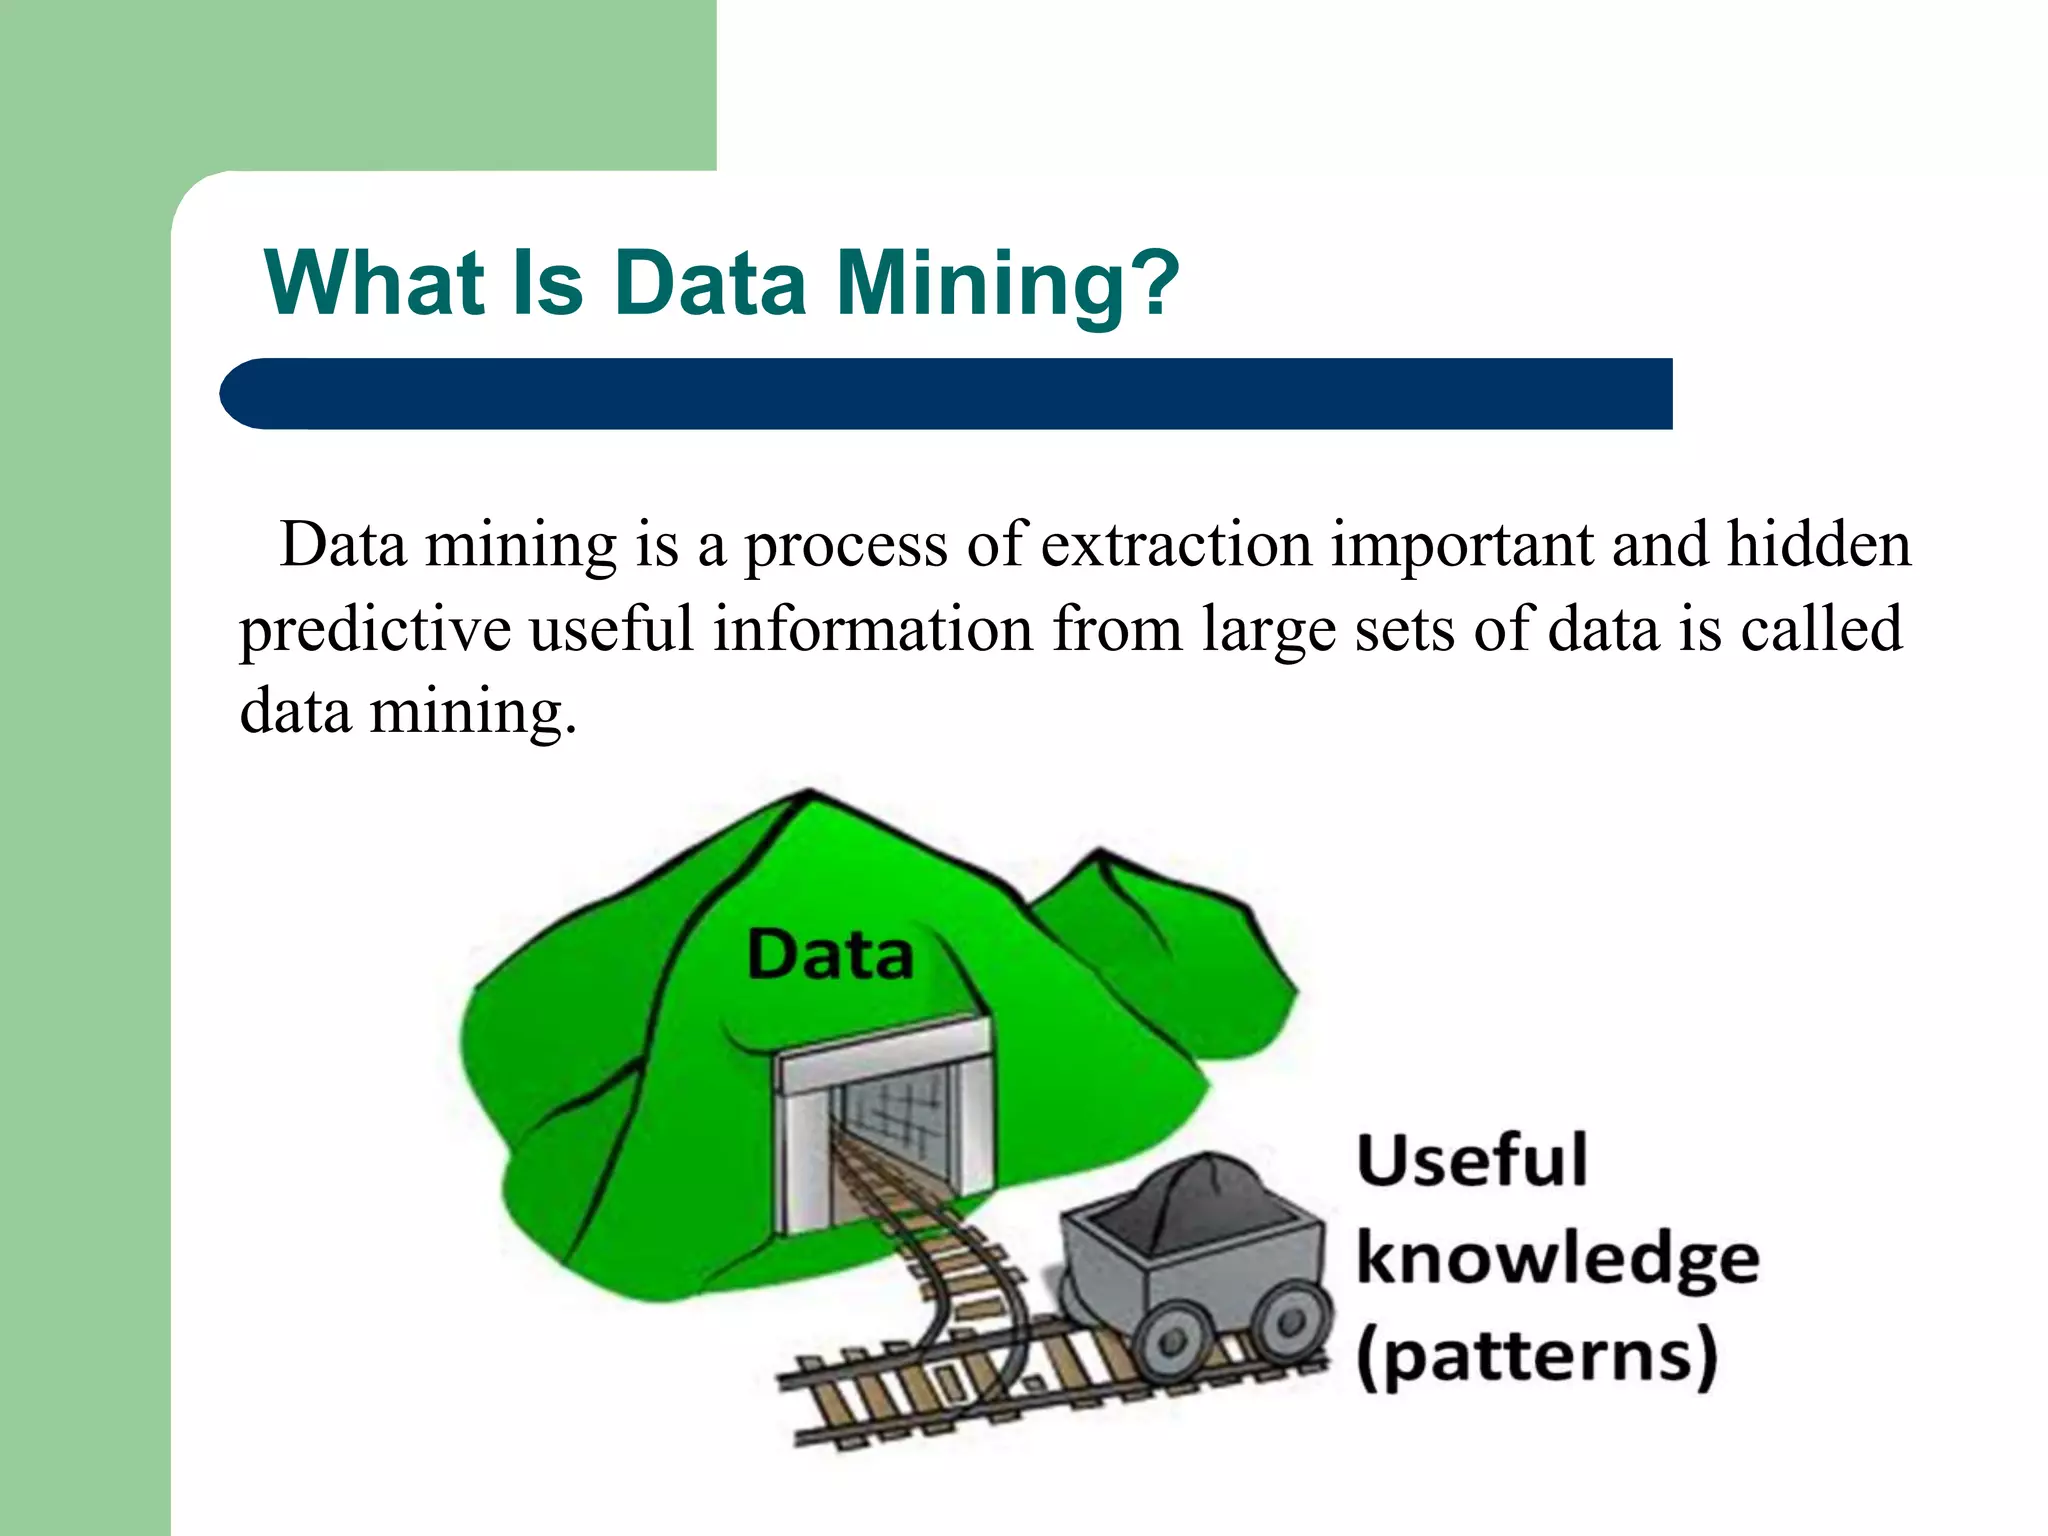
What Is DataMining?
Data mining is a process of extraction important and hidden
predictive useful information from large sets of data is called
data mining.
11.
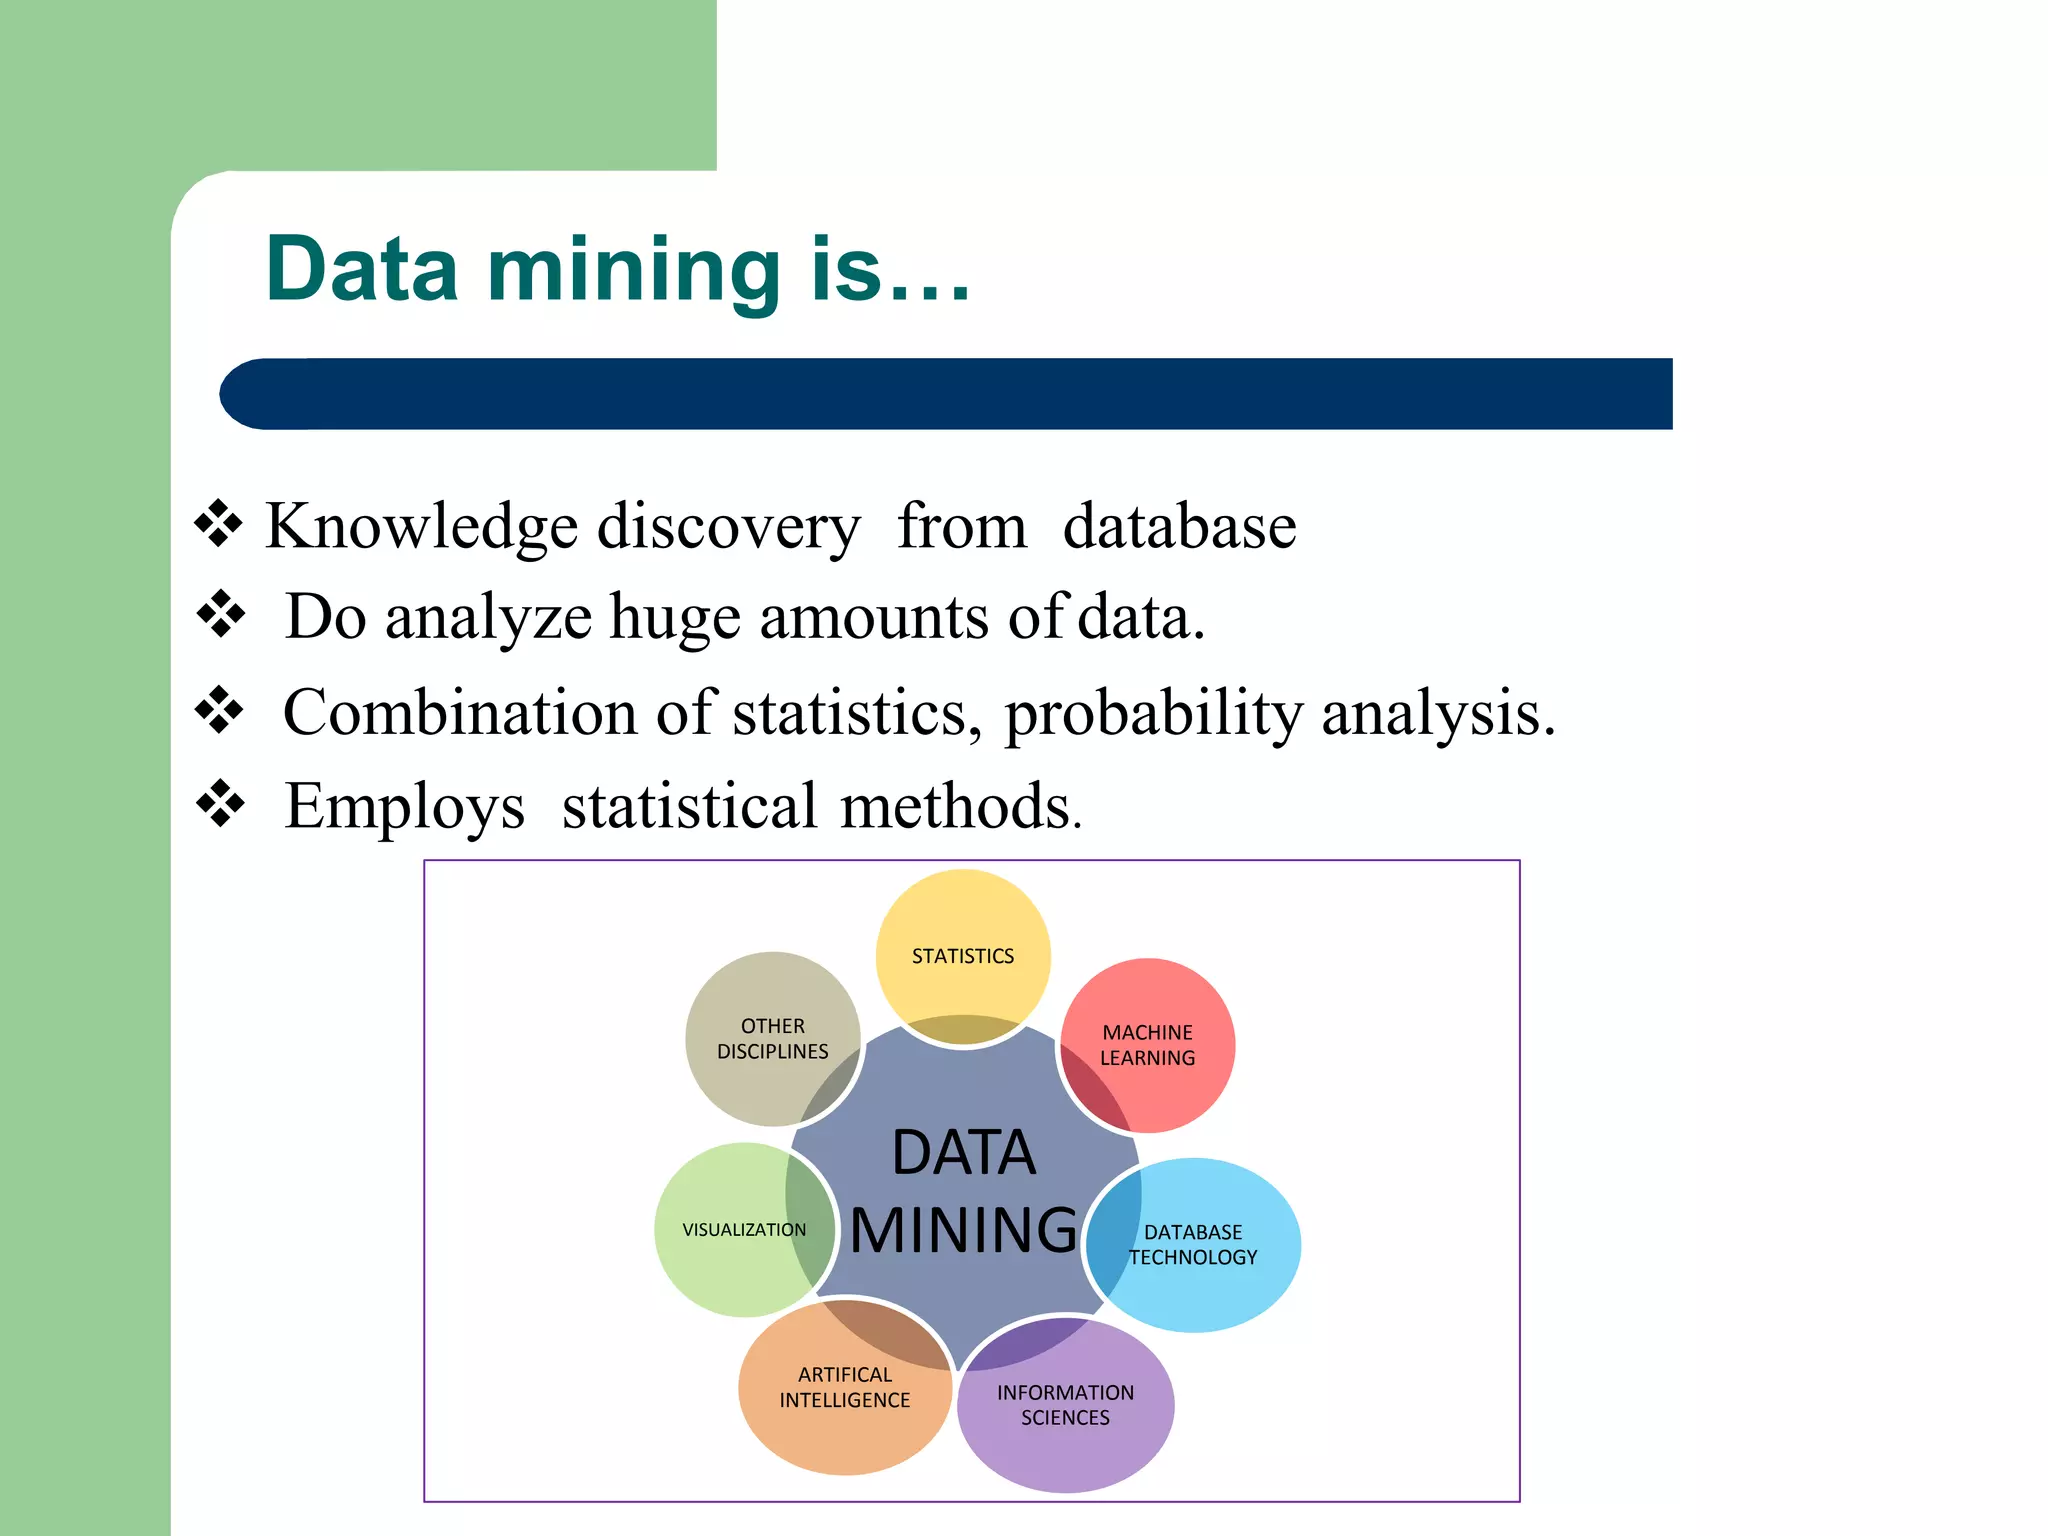
Data mining is…
Knowledge discovery from database
Do analyze huge amounts of data.
Combination of statistics, probability analysis.
Employs statistical methods.
DATA
MINING
STATISTICS
MACHINE
LEARNING
DATABASE
TECHNOLOGY
INFORMATION
SCIENCES
ARTIFICAL
INTELLIGENCE
VISUALIZATION
OTHER
DISCIPLINES
12.
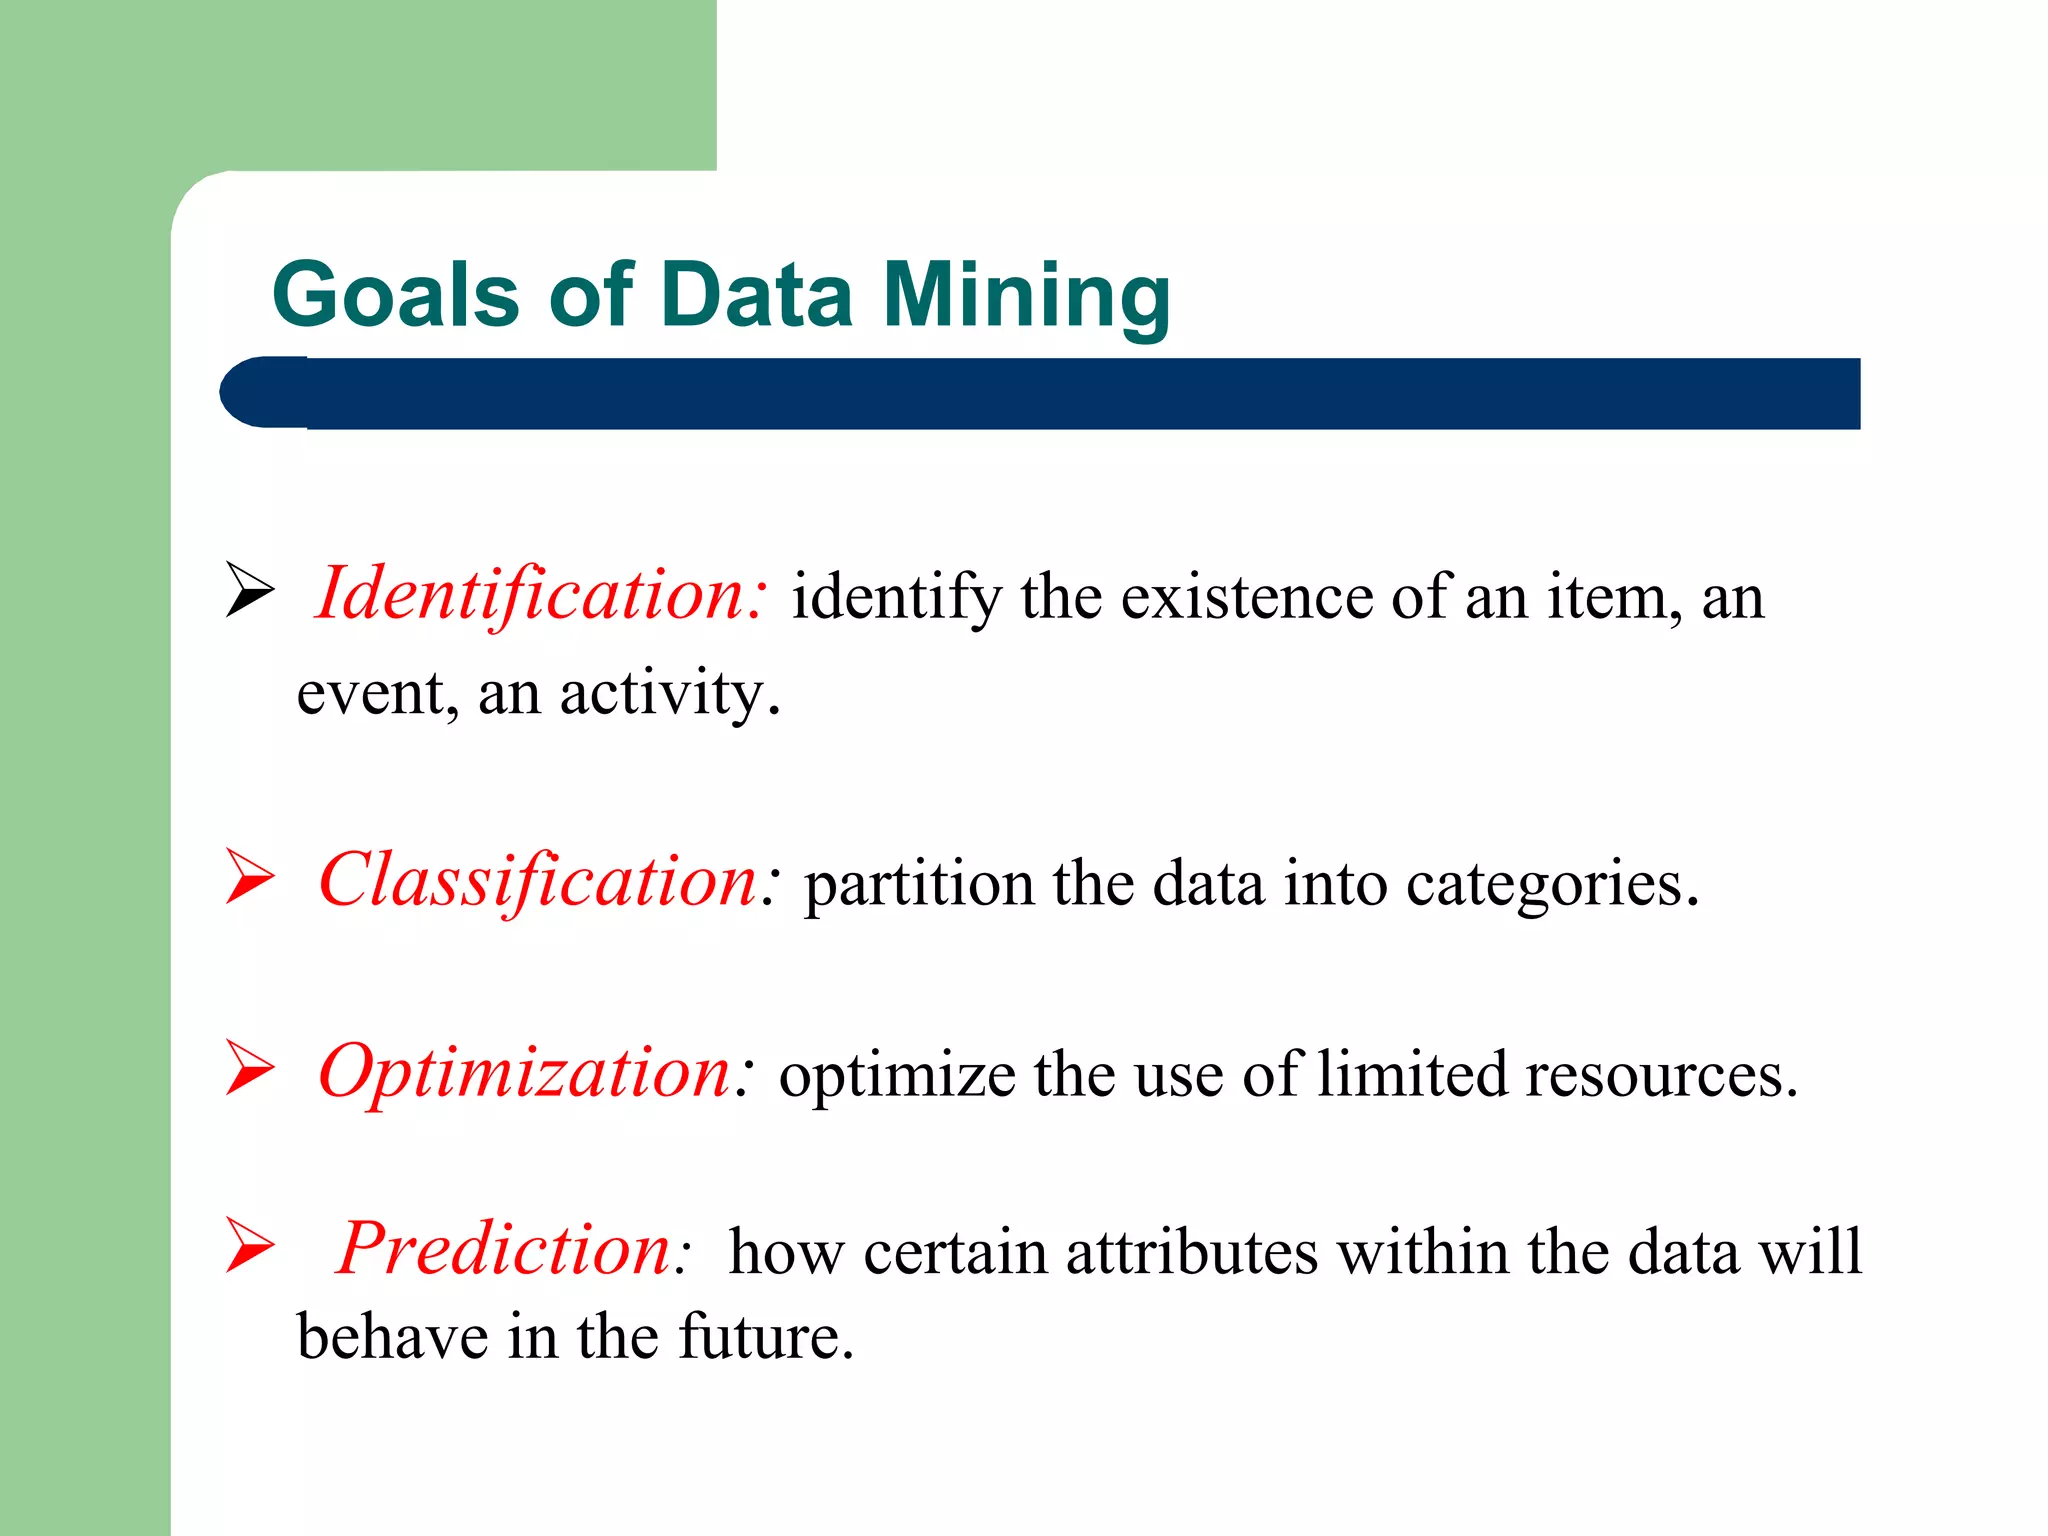
Goals of DataMining
Identification: identify the existence of an item, an
event, an activity.
Classification: partition the data into categories.
Optimization: optimize the use of limited resources.
Prediction: how certain attributes within the data will
behave in the future.
13.
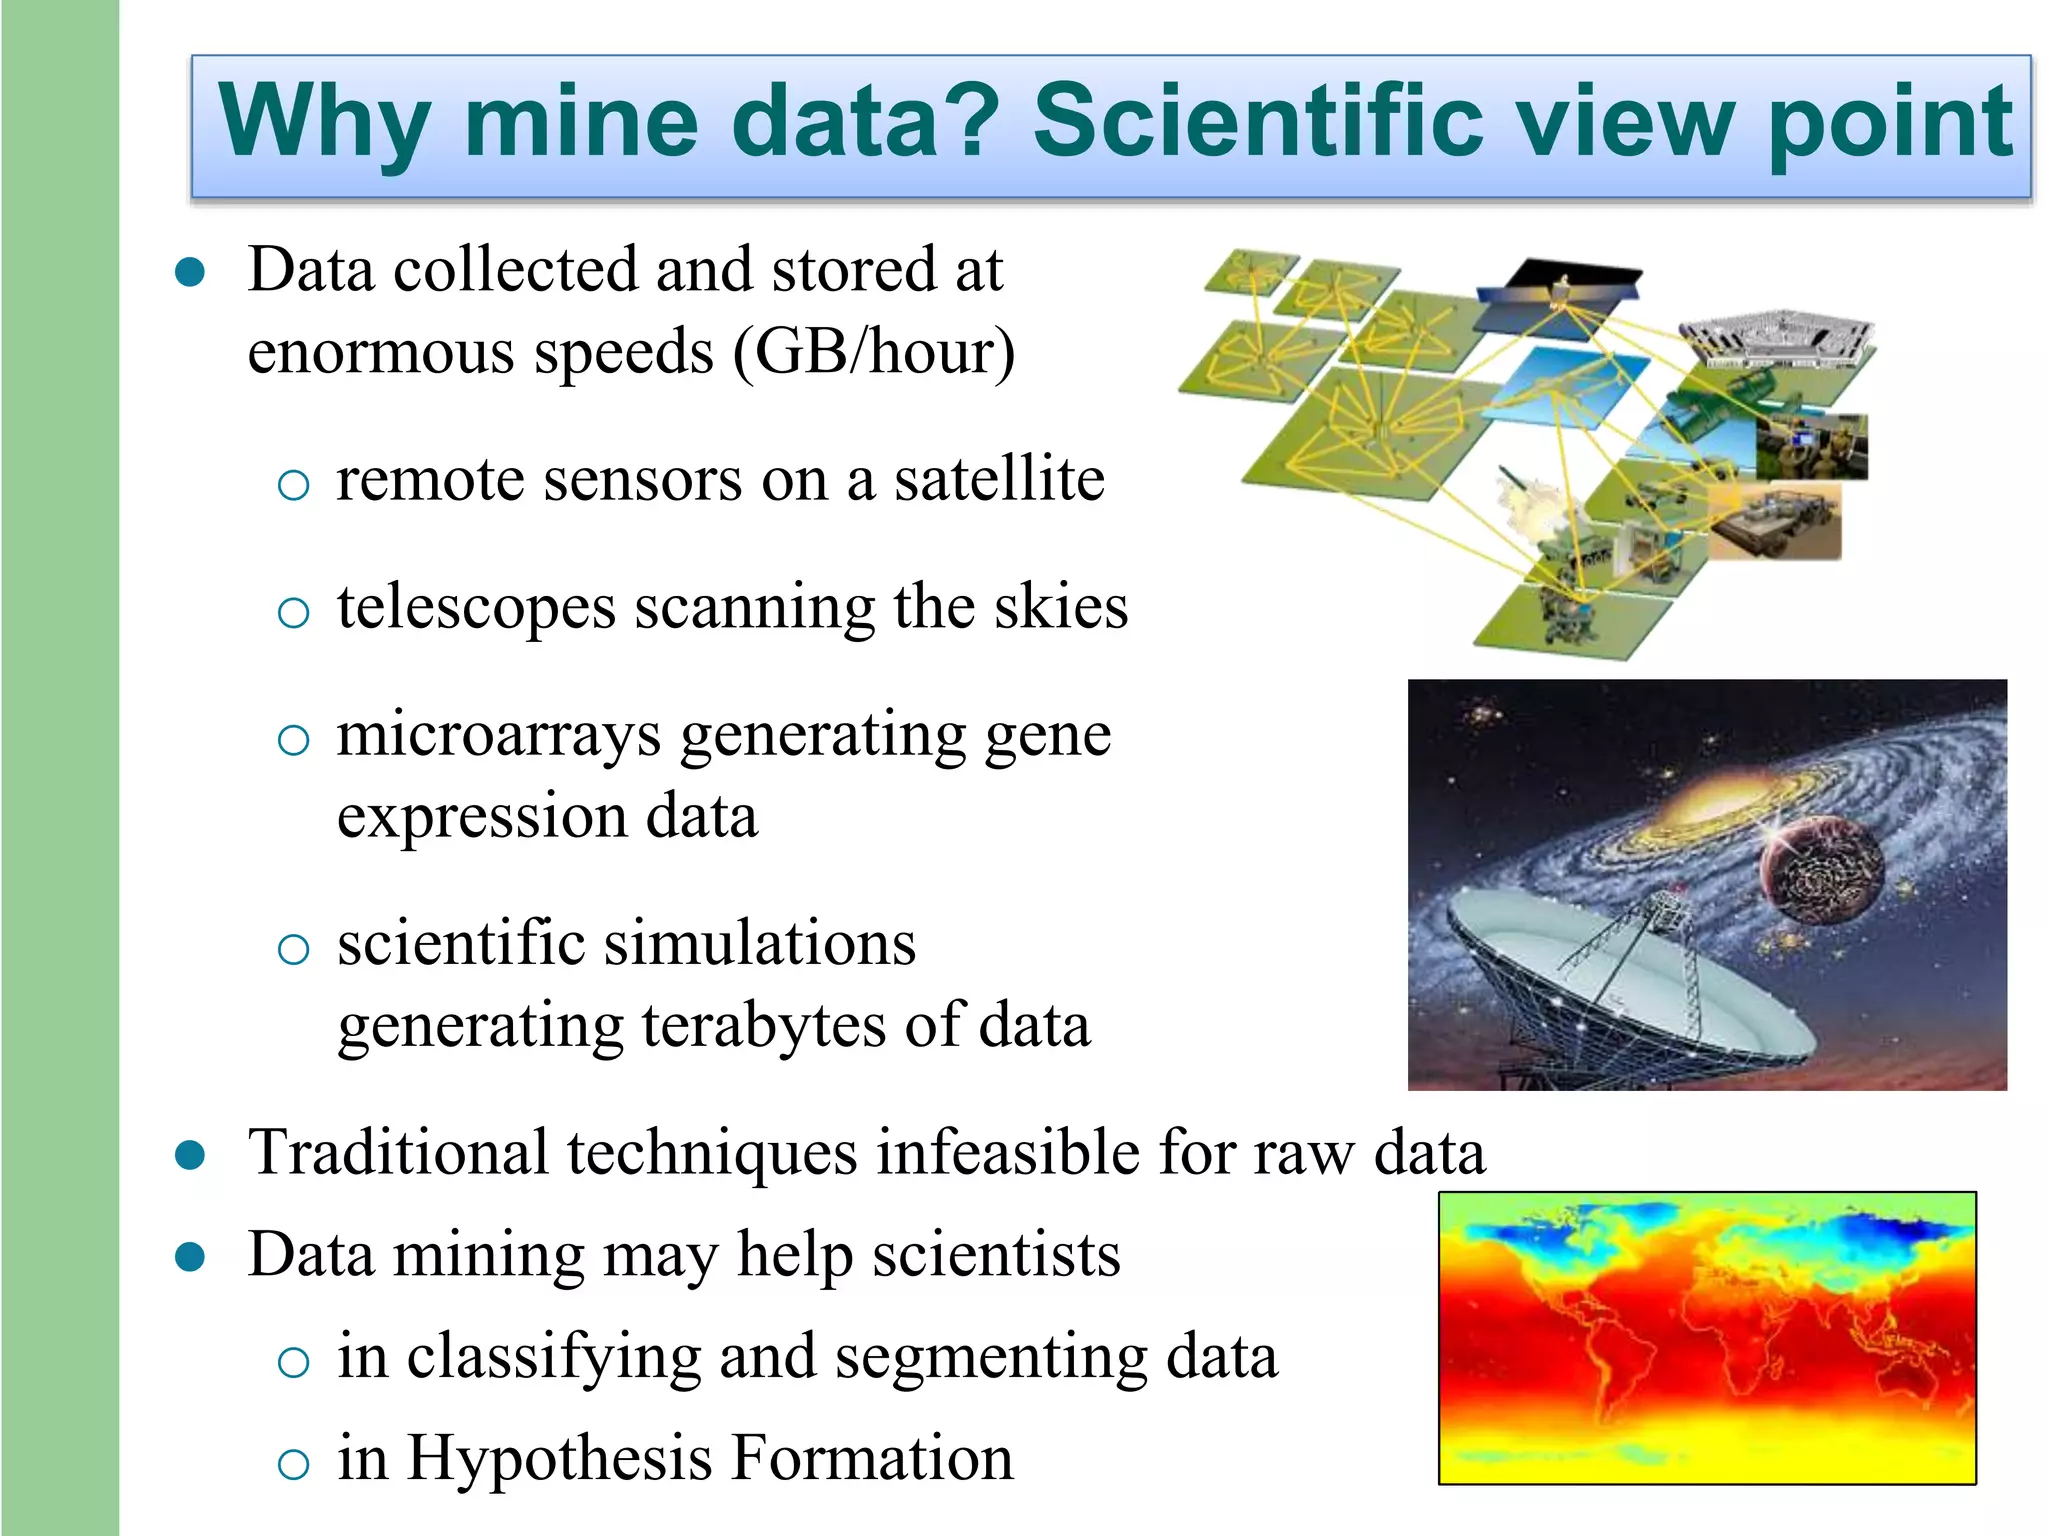
Why mine data?Scientific view point
Data collected and stored at
enormous speeds (GB/hour)
o remote sensors on a satellite
o telescopes scanning the skies
o microarrays generating gene
expression data
o scientific simulations
generating terabytes of data
Traditional techniques infeasible for raw data
Data mining may help scientists
o in classifying and segmenting data
o in Hypothesis Formation
14.
TECHNIQUES USED INDATA MINING
PATTERN RECOGNITION using MACHINE LEARNING techniques
CLASSIFICATION
CLUSTERING
ASSOCIATION RULES
PREDICTION
15.
1.CLASSIFICATION
Classification techniquesare designed for classifying
unknown samples using information provided by set of
classified samples.
Ex : classify countries based on climate, or classify cars based
on gas mileage
Presentation : decision tree, classification rule, neural network,
support vector machine
16.
2. CLUSTERING
Clustering isa partitioning a homogeneous data set of
meaningful sub-classes called clusters.
• Clustering: unsupervised classification: no predefined classes.
: supervised classification: predefined classes
A good clustering method will produce high quality clusters in
which:
• the intra-class similarity is high.
• the inter-class similarity is low.
17.
3. ASSOCIATION
Associationrule of data mining to search unseen or
desired pattern among the extent amount of data.
Association rule used to find out the elements co-occur
repeatedly within a dataset consisting of many independent
selections of elements, and discover rules.
Application of association rules mining is the market
basket analysis, Pathogen analysis(downy mildew and
powdery mildew).
18.
Regression isa data mining (machine learning) technique
used to fit an equation to a dataset.
A straight line is given by the equation y = mx + c and
determines the approximate values for m and c to calculate
the value of y based on a particular value of x.
Multiple regression, uses more than one input variable and
allows for the fitting of more complex models.
bootstrap algorithms for small sample
4. Prediction
19.
5.MACHINE LEARNING
Abilityto automatically learn to recognize complex
patterns and make intelligent decisions based on data.
DECISION TREE ANALYSIS
A decision tree is a decision support tool that uses
a tree-like graph
Relatively fast compared to other classification
models.
Obtain similar and sometimes better accuracy
compared to other models.
Can be converted into simple and easy to
understand classification rules
23.
A decision treeis constructed in two phases:
Tree Building (growing)Phase:
Repeatedly partition the training data until all the
examples in each partition belong to one class or the
partition is sufficiently small
Tree Pruning Phase:
Remove dependency on statistical noise or variation that
may be particular only to the training set
24.
NEAREST NEIGHBOR andK-NEAREST NEIGHBOR
The Nearest Neighbour rule achieves consistently high
performance, without a priori assumptions about the
distributions from which the training examples are drawn
It supervised learning technique
Classified based on weighted average votes.
K-Nearest Neighbor is considered a lazy learning algorithm
that classifies data sets based on their similarity with
neighbors.
25.
K-MEANS
This is apopular for cluster analysis in data mining. k-
means clustering aims to partition n observations
into k clusters in which each observation belongs to
the cluster with the nearest mean, serving as a prototype of
the cluster. This results in a partitioning of the data space
into Voronoi cells.
26.
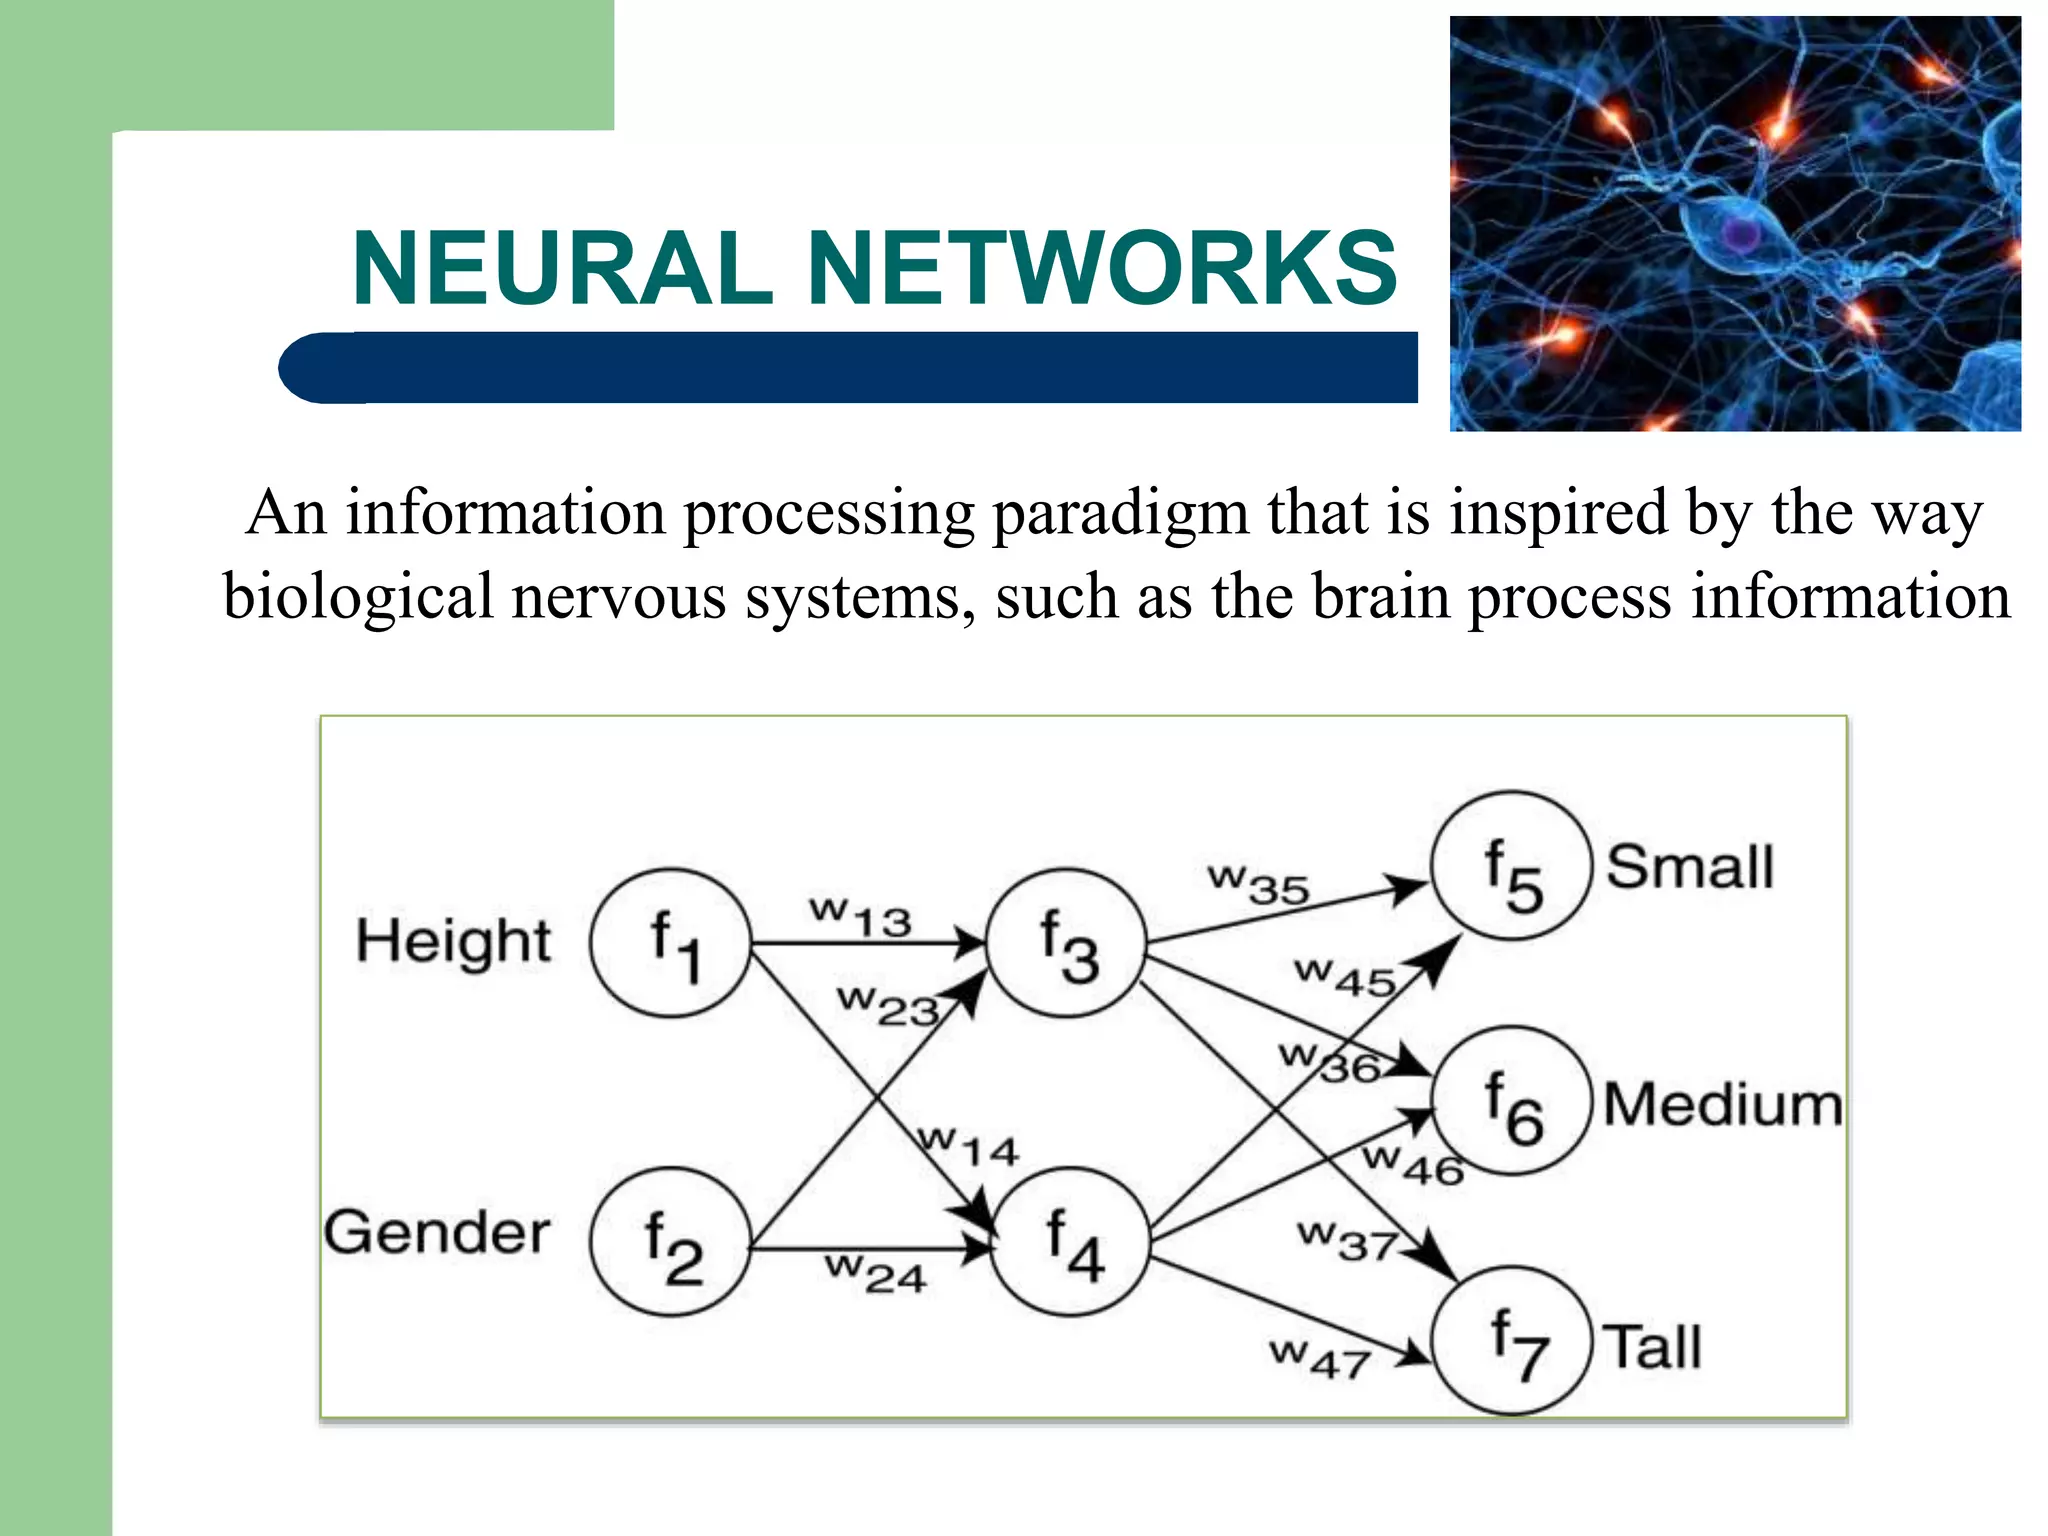
NEURAL NETWORKS
An informationprocessing paradigm that is inspired by the way
biological nervous systems, such as the brain process information
27.
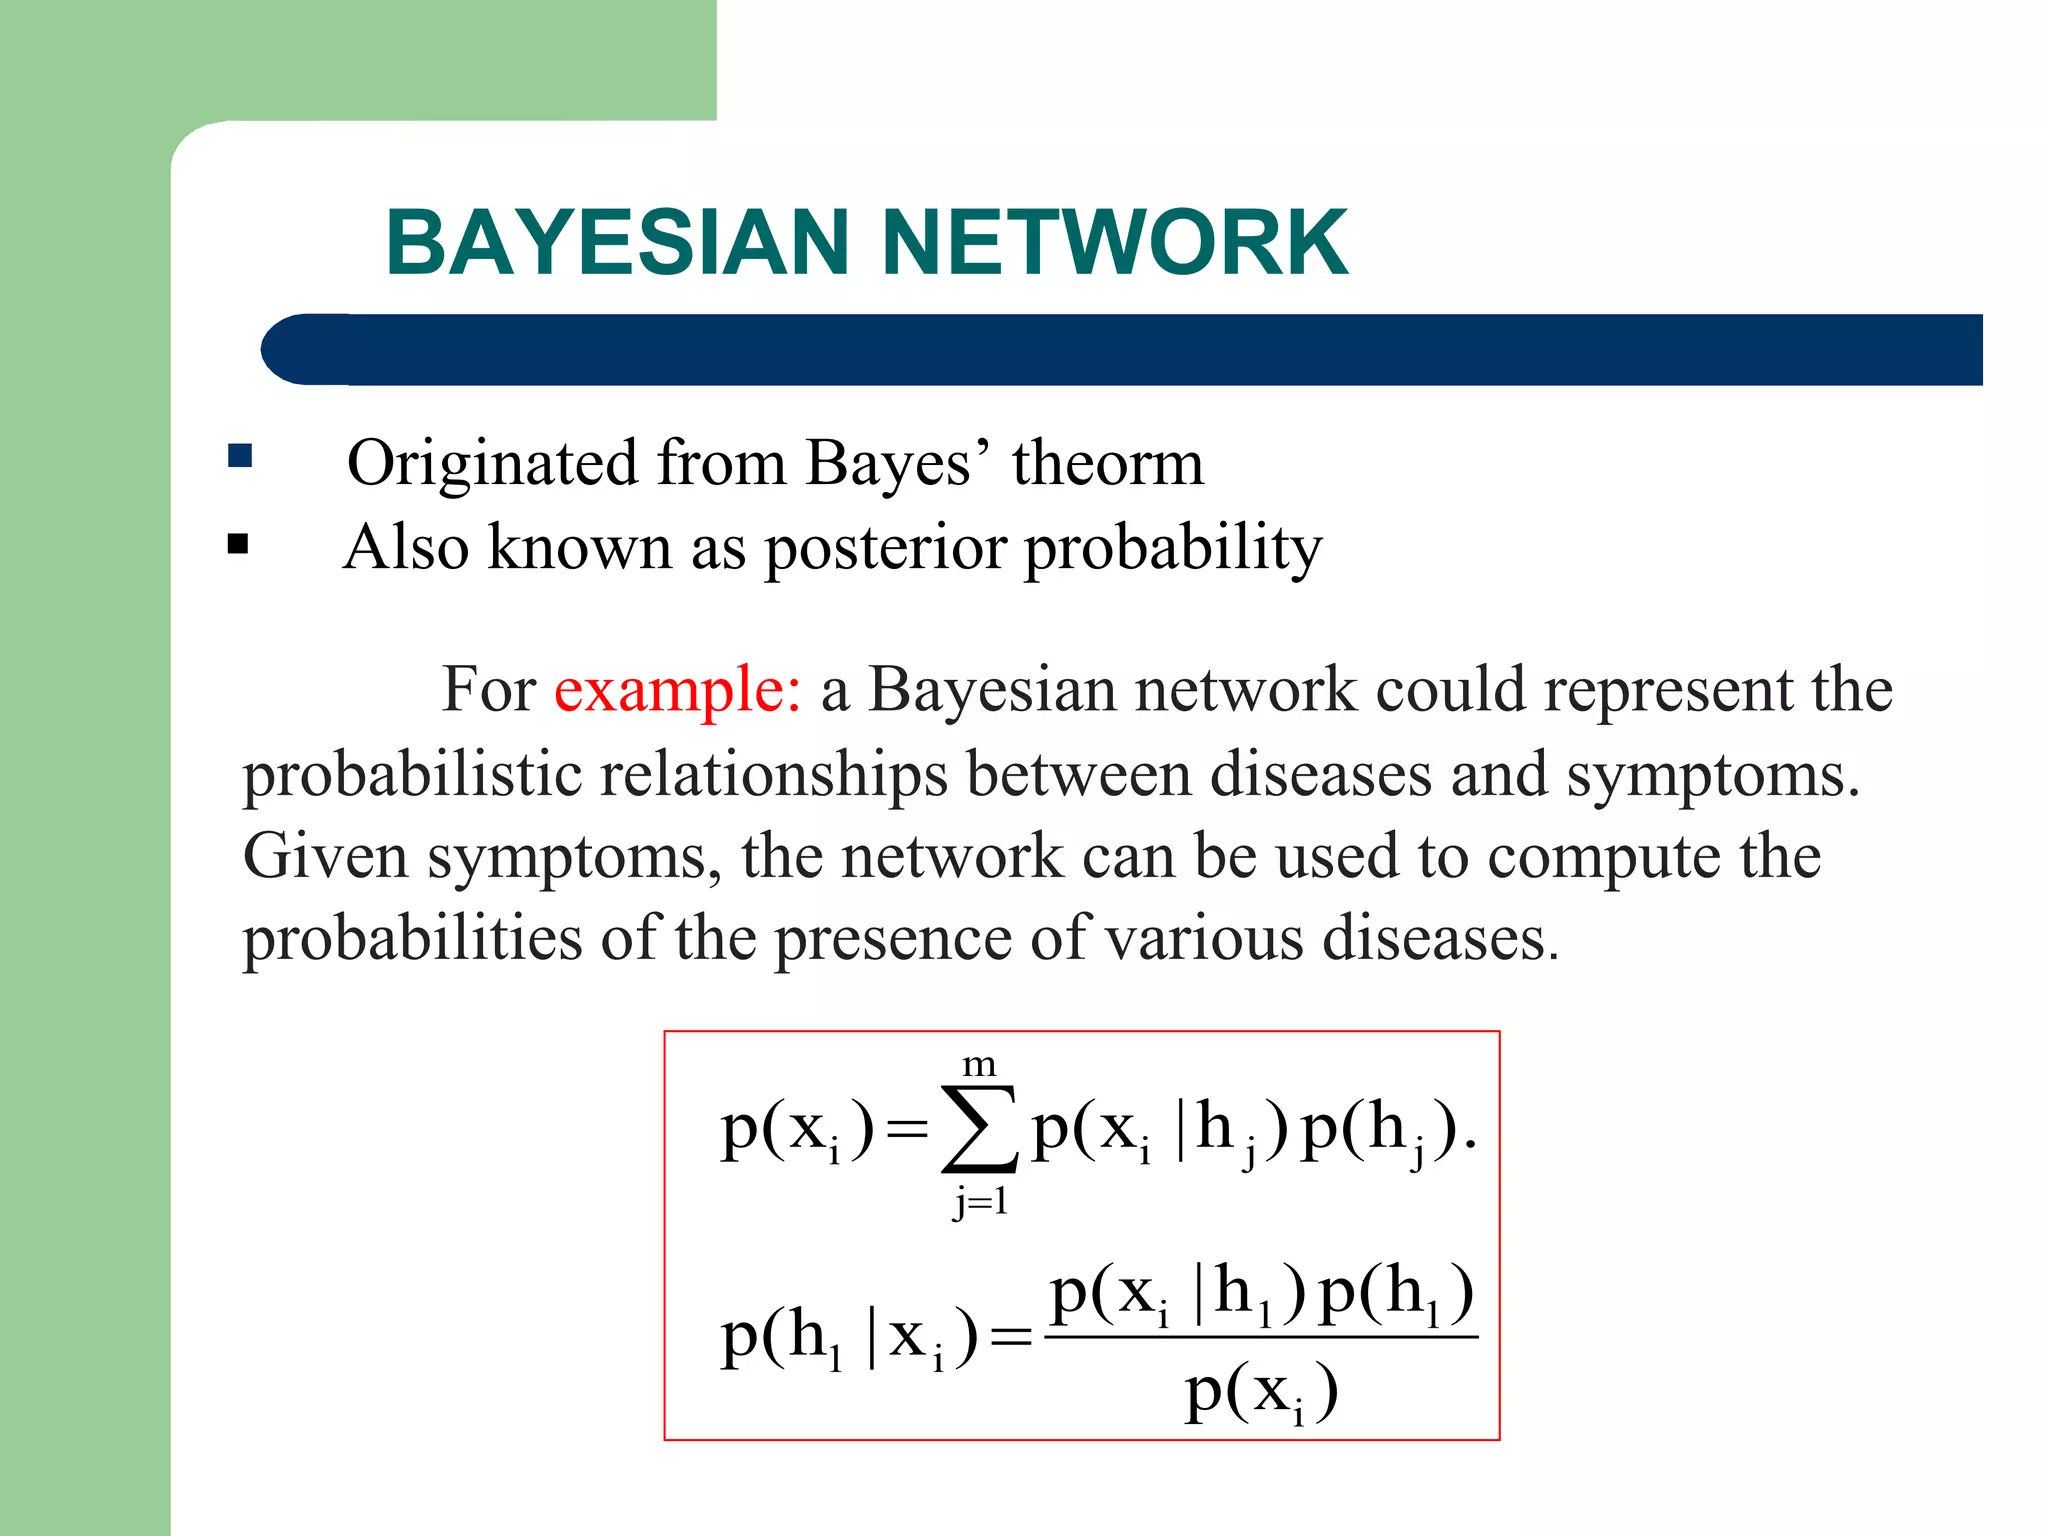
BAYESIAN NETWORK
Originatedfrom Bayes’ theorm
Also known as posterior probability
For example: a Bayesian network could represent the
probabilistic relationships between diseases and symptoms.
Given symptoms, the network can be used to compute the
probabilities of the presence of various diseases.
)p(x
)p(h)h|p(x
)x|p(h
).p(h)h|p(x)p(x
i
11i
i1
m
1j
jjii
28.
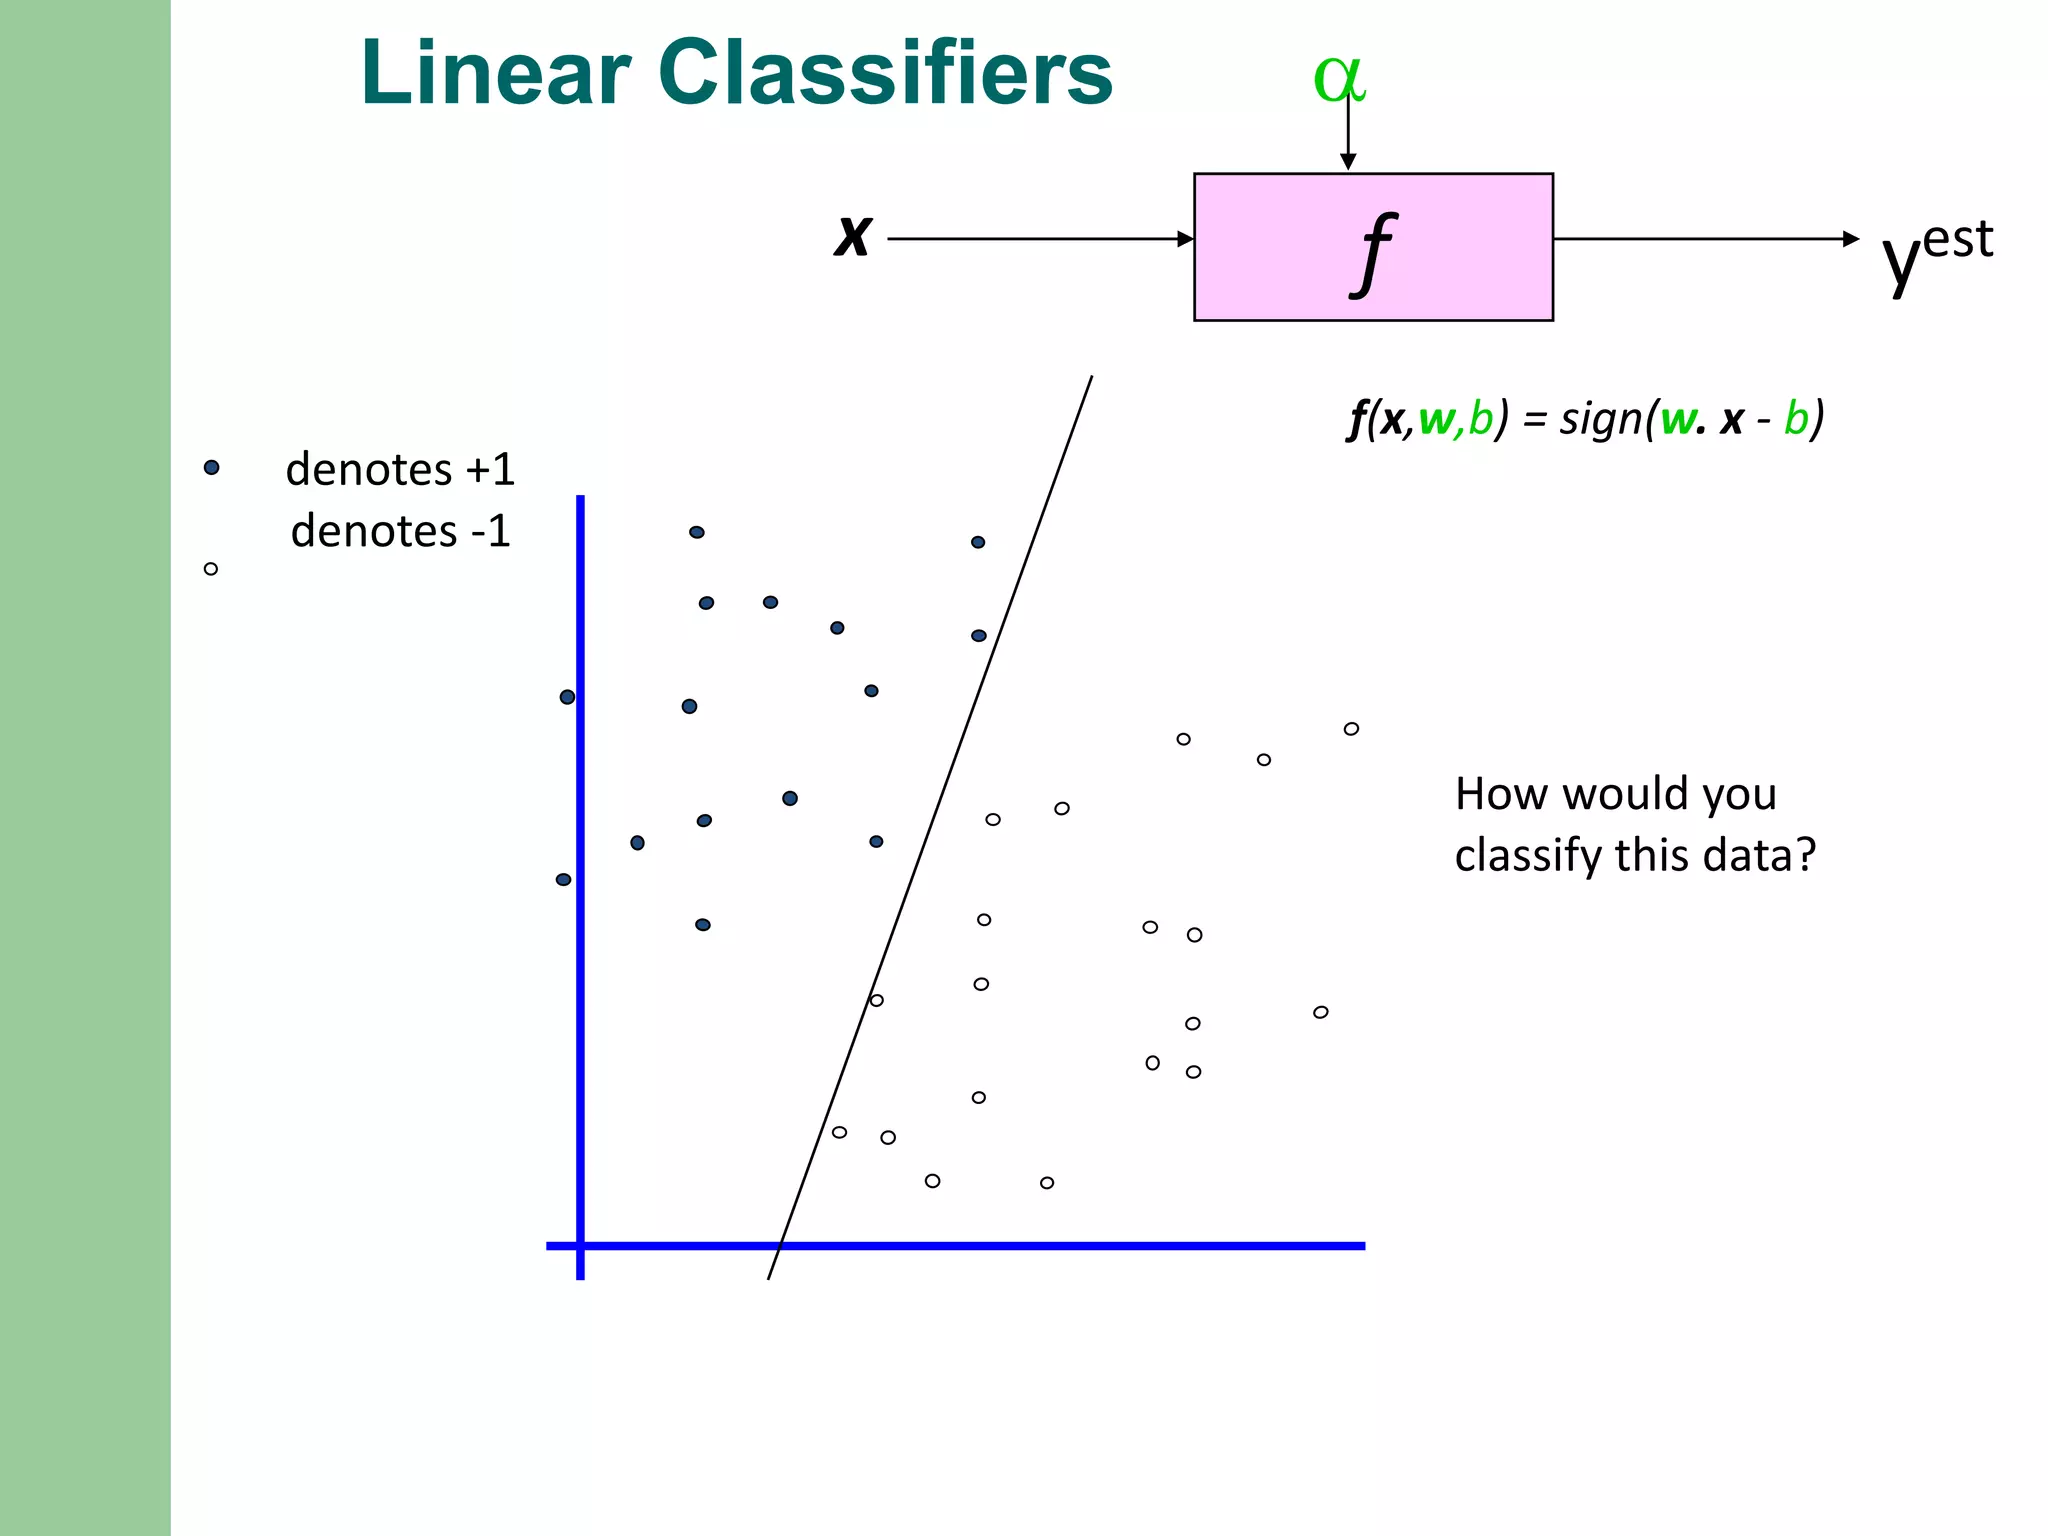
SUPPORT VECTOR MACHINE
Support Vector Machines (SVM) supervised learning
technique for solving classification and regression
problem.
Svm aims to find the hyperplane that best separates two
classes of data
SVM FOR CLASSIFICATION:
1 Linear Support Vector Machine for Separable Data
2 Linear Support Vector Machine for Non-Separable Data
3 Nonlinear Support Vector Machine
Classifier Margin
fx
a
yest
denotes +1
denotes-1
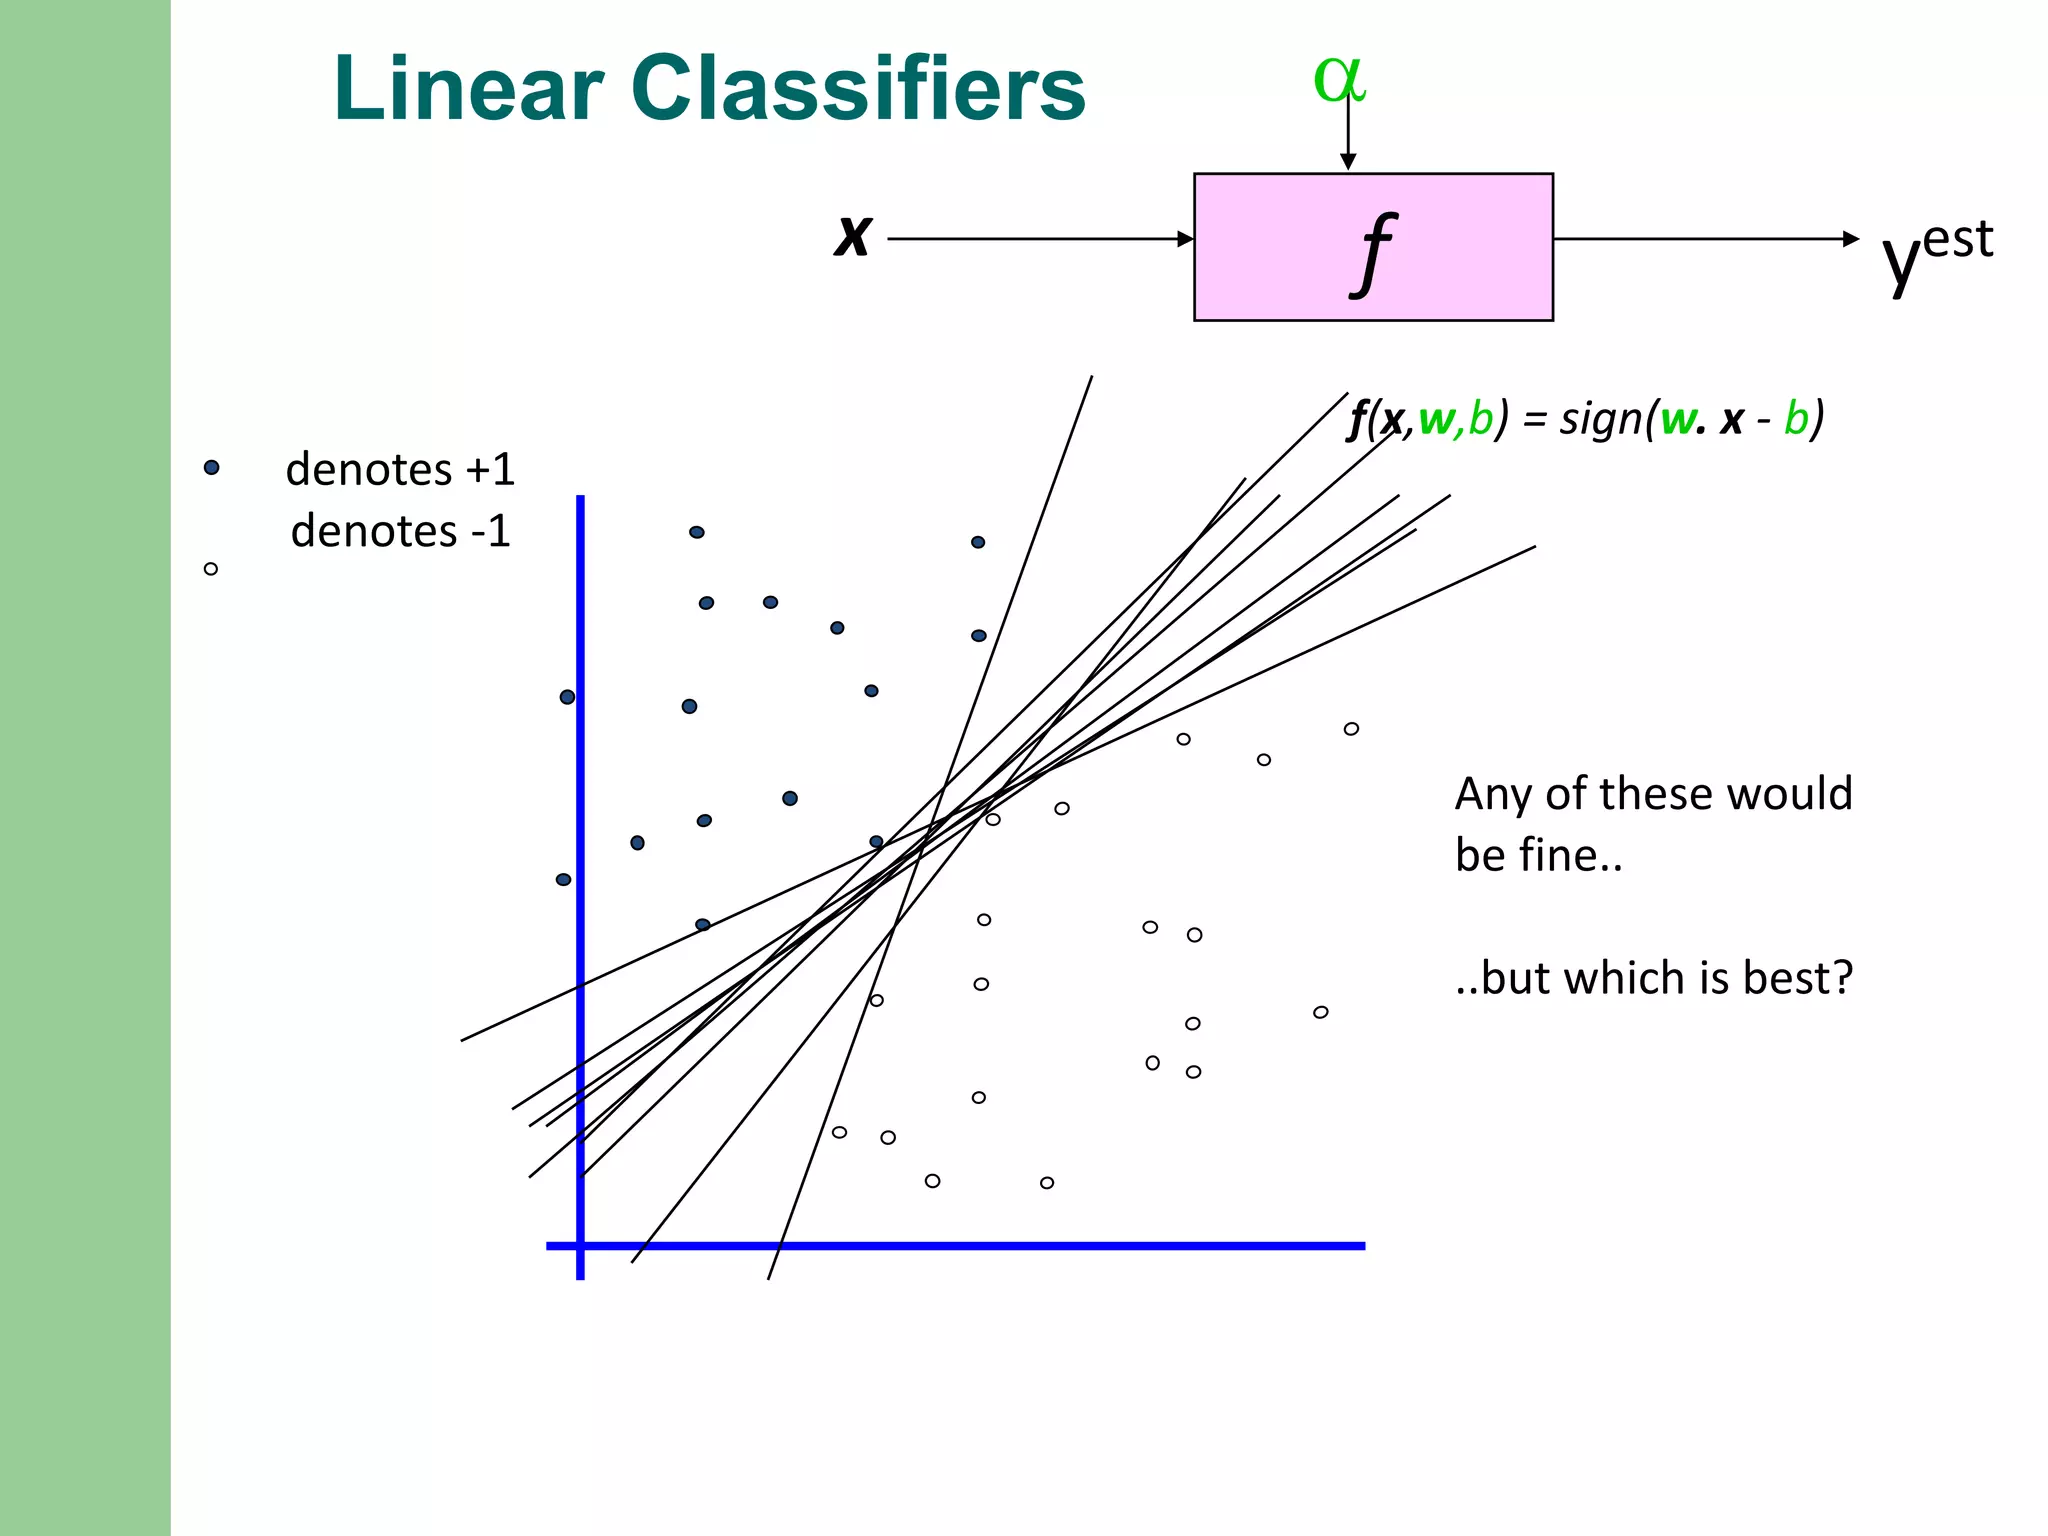
f(x,w,b) = sign(w. x - b)
Define the margin of
a linear classifier as
the width that the
boundary could be
increased by before
hitting a datapoint.
34.
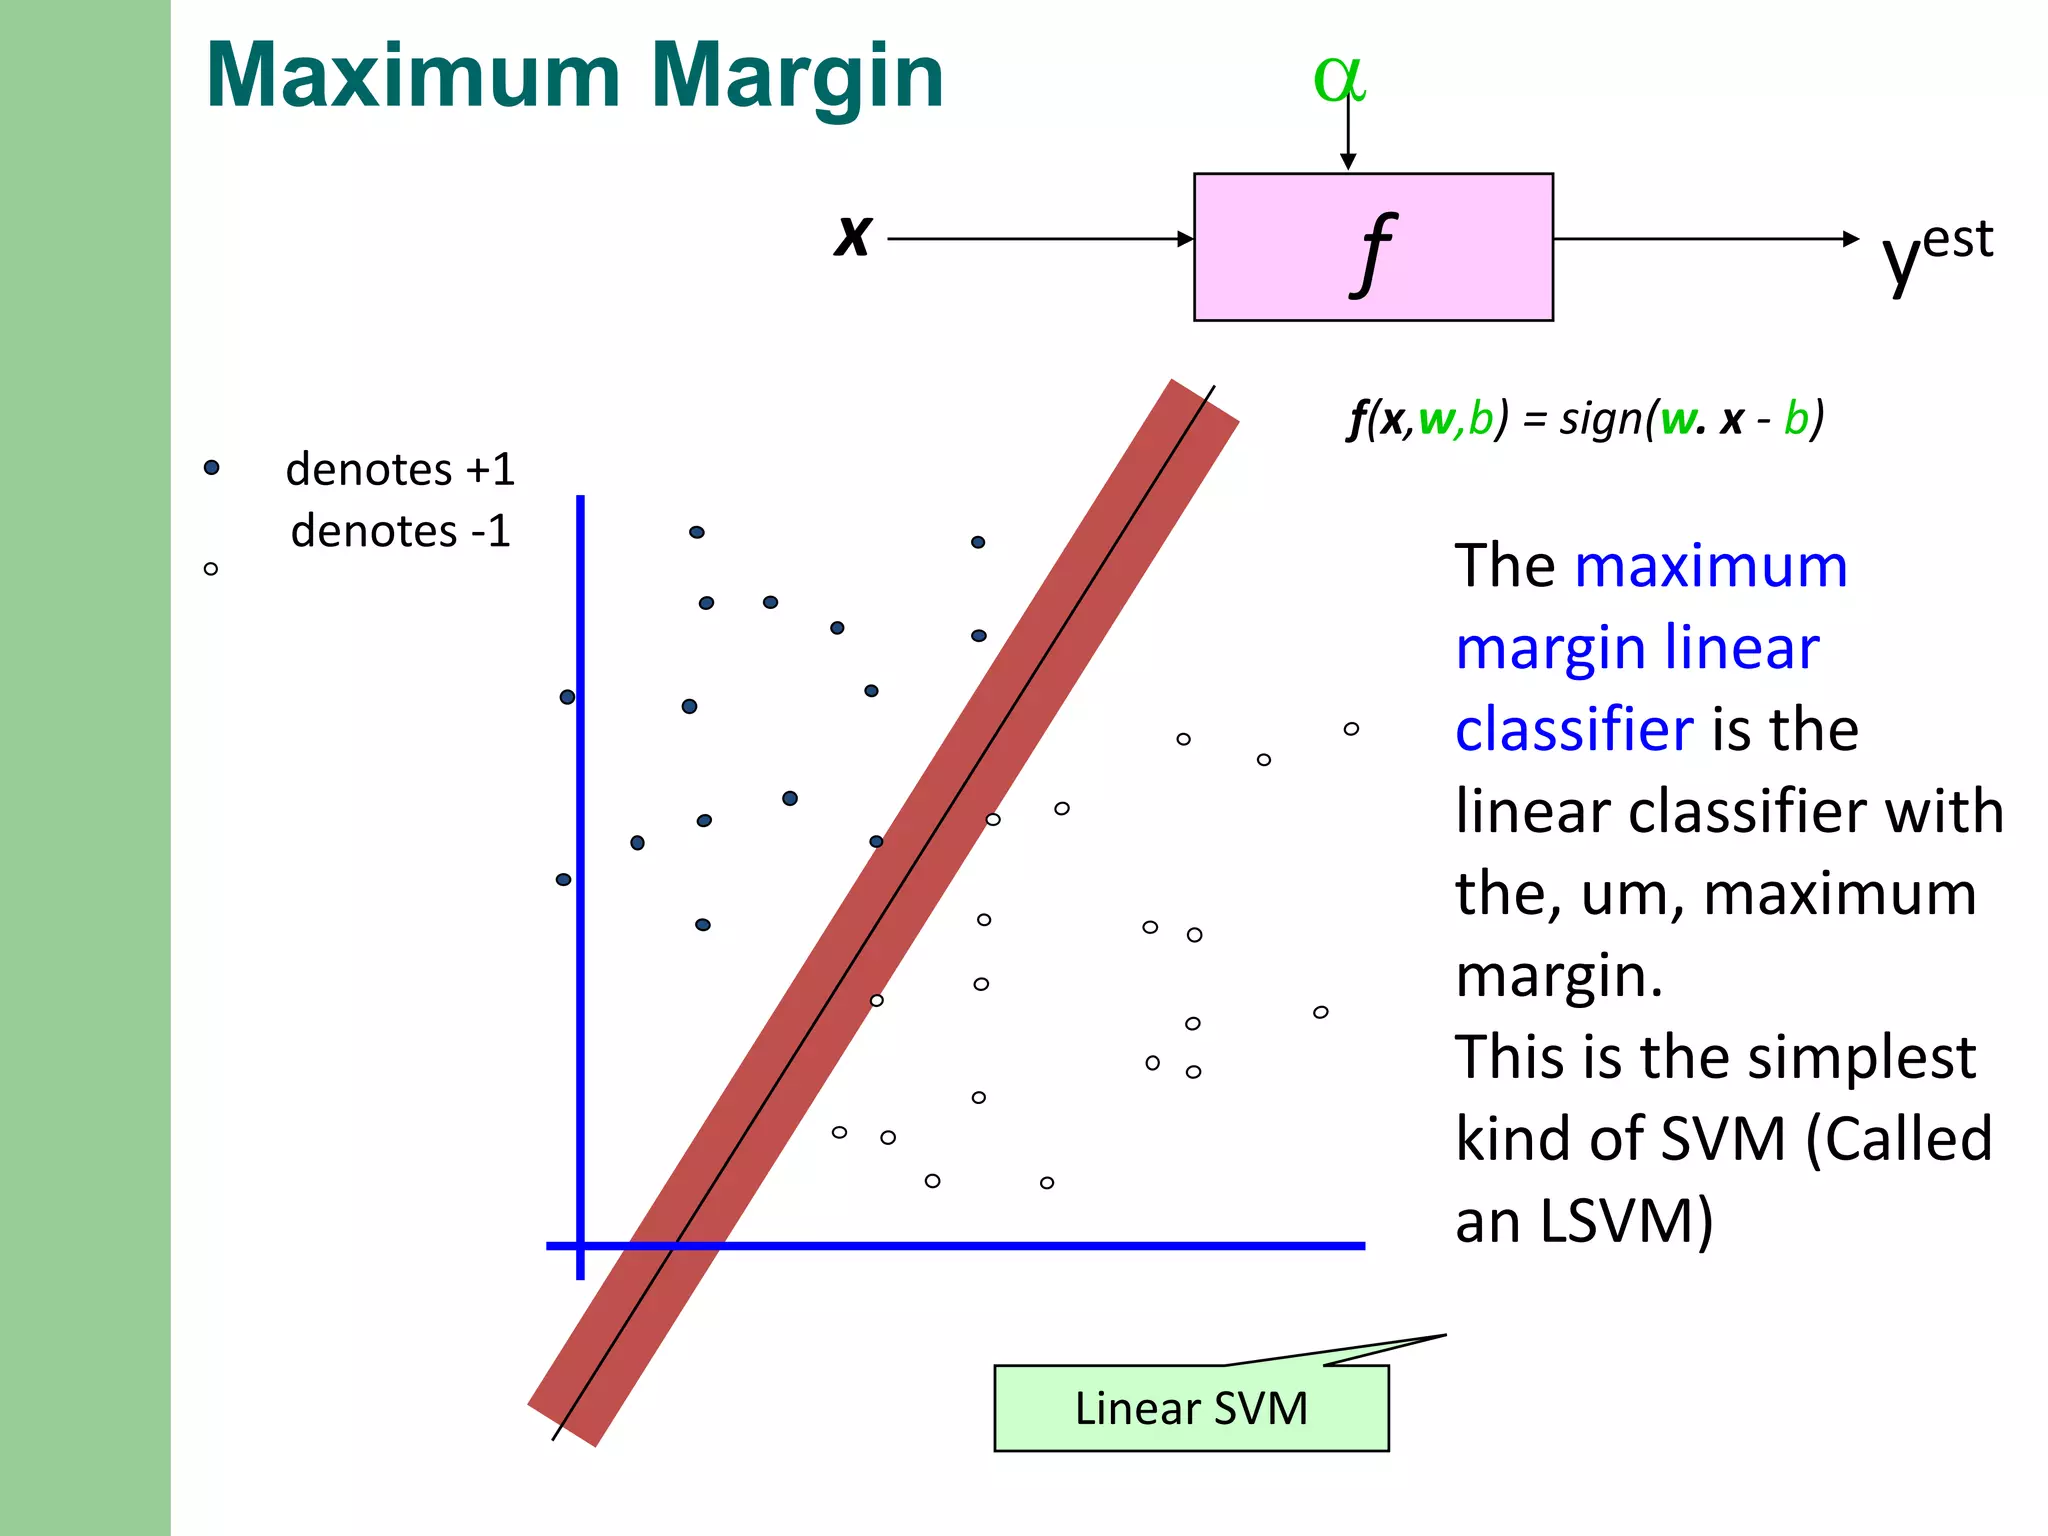
Maximum Margin
fx
a
yest
denotes +1
denotes-1
f(x,w,b) = sign(w. x - b)
The maximum
margin linear
classifier is the
linear classifier with
the, um, maximum
margin.
This is the simplest
kind of SVM (Called
an LSVM)
Linear SVM
35.
Why Maximum Margin?
denotes+1
denotes -1
f(x,w,b) = sign(w. x - b)
The maximum
margin linear
classifier is the
linear classifier with
the, um, maximum
margin.
This is the simplest
kind of SVM (Called
an LSVM)
Support Vectors are
those datapoints
that the margin
pushes up against
1. Intuitively this feels
safest.
2. If we’ve made a small
error in the location of
the boundary (it’s been
jolted in its
perpendicular
direction) this gives us
least chance of causing
a misclassification.
3. LOOCV is easy since the
model is immune to
removal of any non-
support-vector data
points.
4. There’s some theory
(using VC dimension)
that is related to (but
not the same as) the
proposition that this is
a good thing.
5. Empirically it works
very very well.
37.
FUZZY LOGIC
Fuzzylogic an approach to computing based on “degrees
of truth” rather than the usual “true (or) false”
the truth values of variables may only be the integer
values 0 or 1.
It takes probabilistic measure to quantify the parameter.
Ex: if cold is a fuzzy set, exact temperature values might be mapped to
the fuzzy set as follows:
15 degrees → 0.2 (slightly cold)
10 degrees → 0.5 (quite cold)
0 degrees → 1 (totally cold)
38.
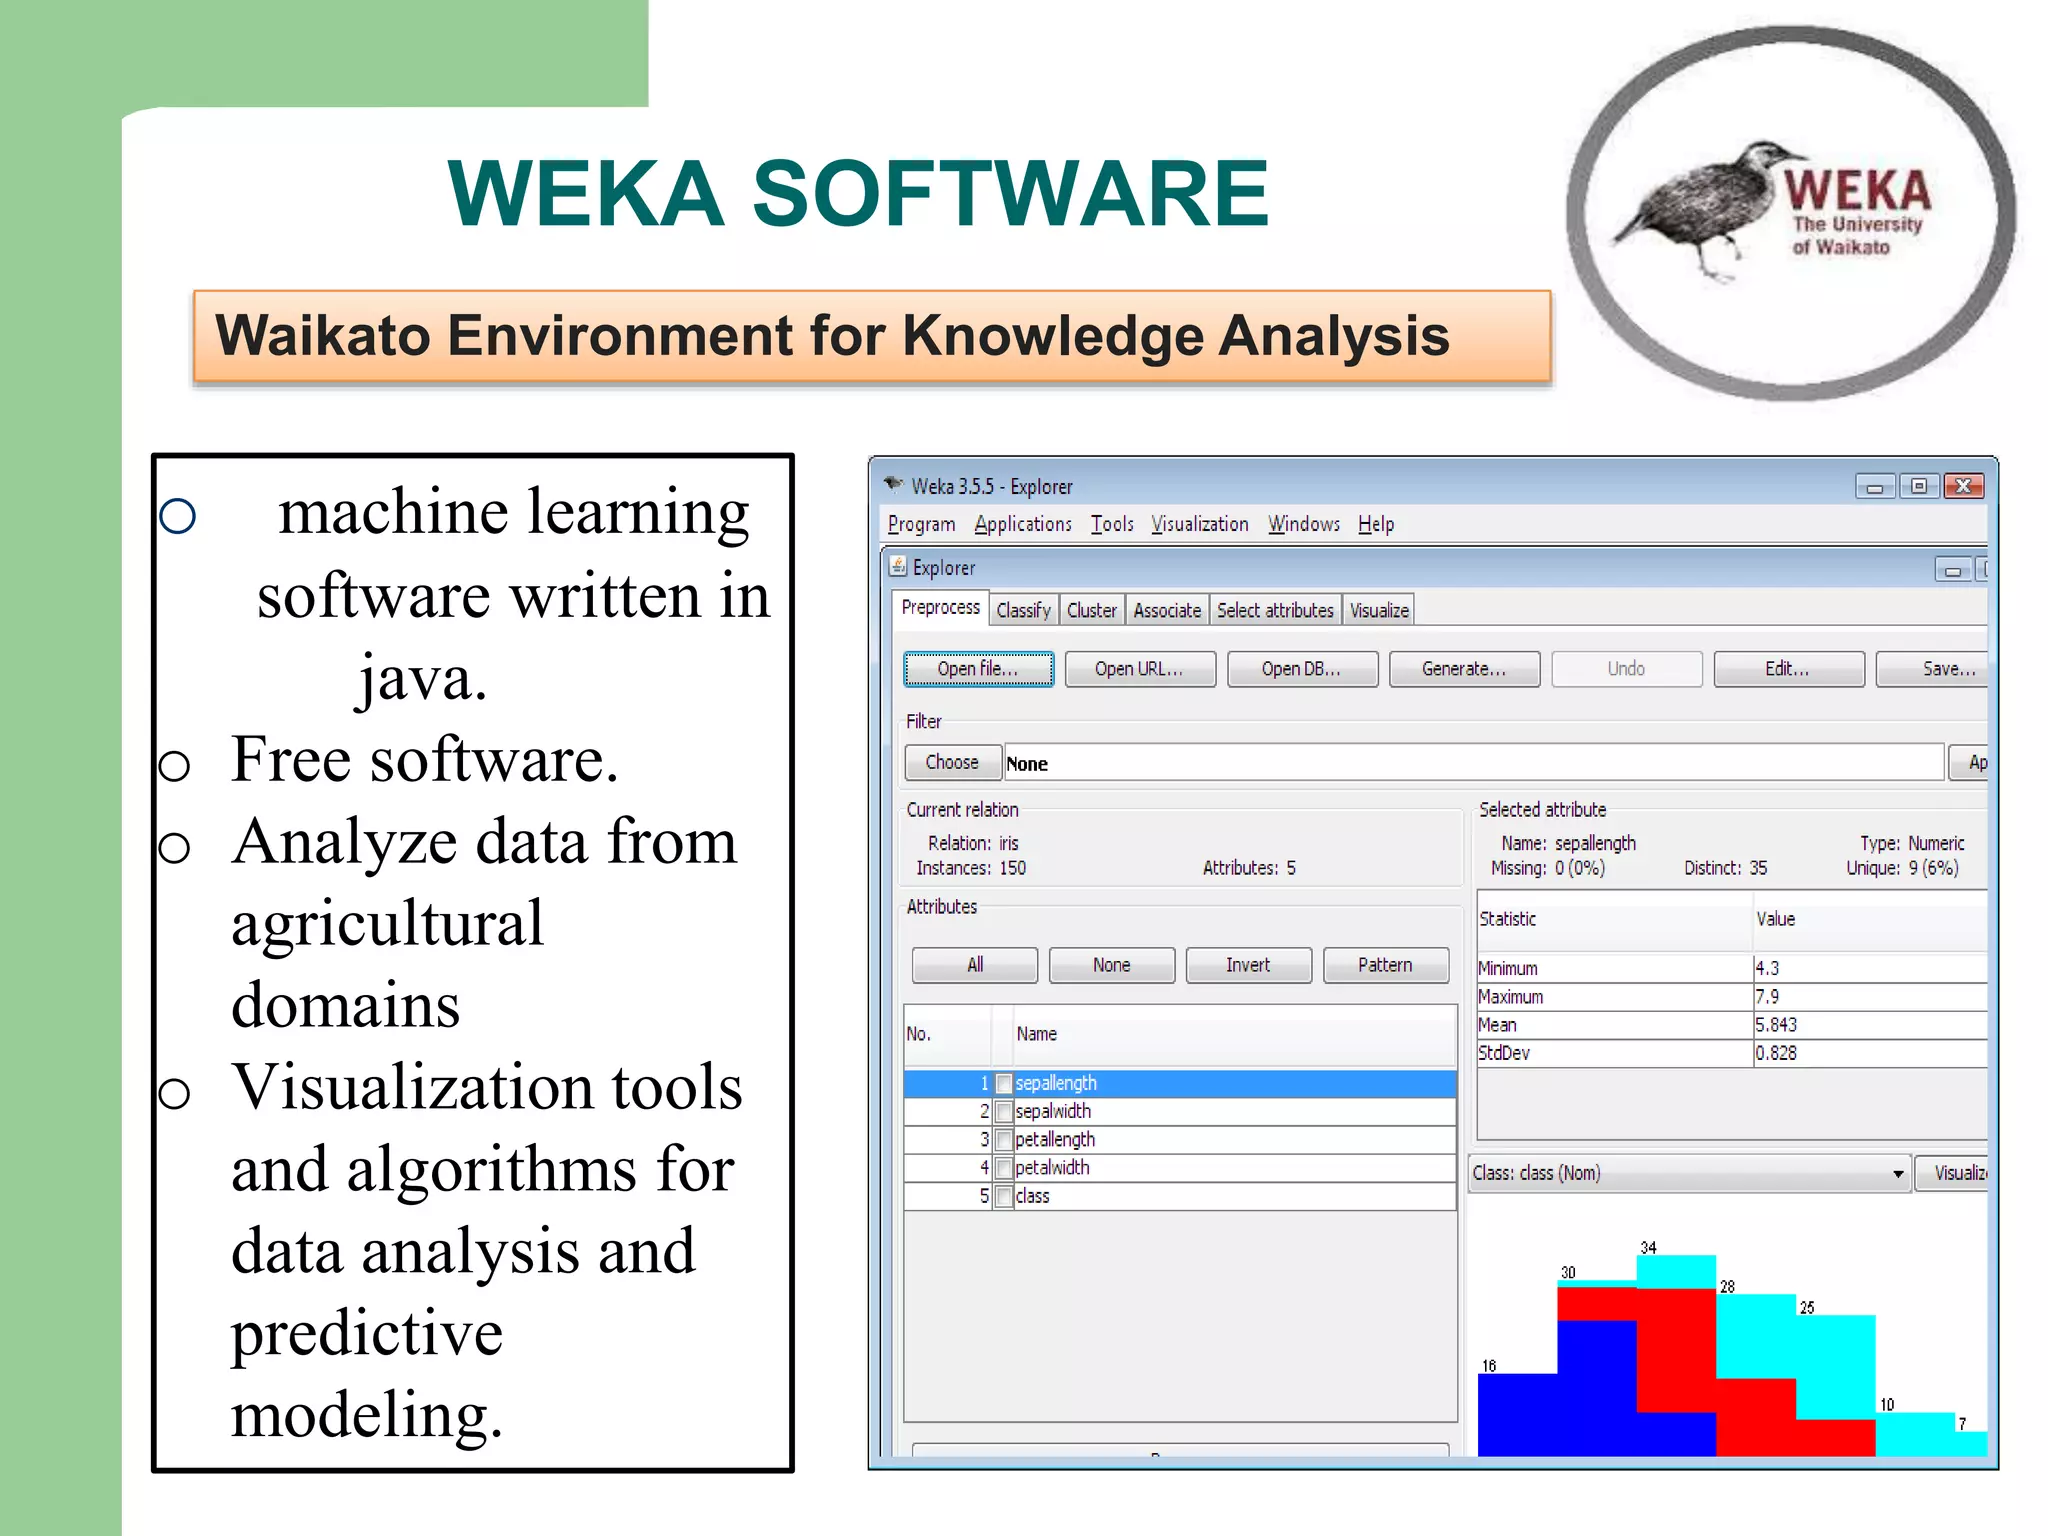
WEKA SOFTWARE
o machinelearning
software written in
java.
o Free software.
o Analyze data from
agricultural
domains
o Visualization tools
and algorithms for
data analysis and
predictive
modeling.
Waikato Environment for Knowledge Analysis
39.
ADVANTAGES OF WEKA
Runs on almost any modern computing platform.
A comprehensive collection of data preprocessing and
modeling techniques.
Ease of use due to graphical user interfaces.
Support several standard data mining tasks, more
specifically, data preprocessing, clustering, classification
regression, visualization, and feature selection.
40.
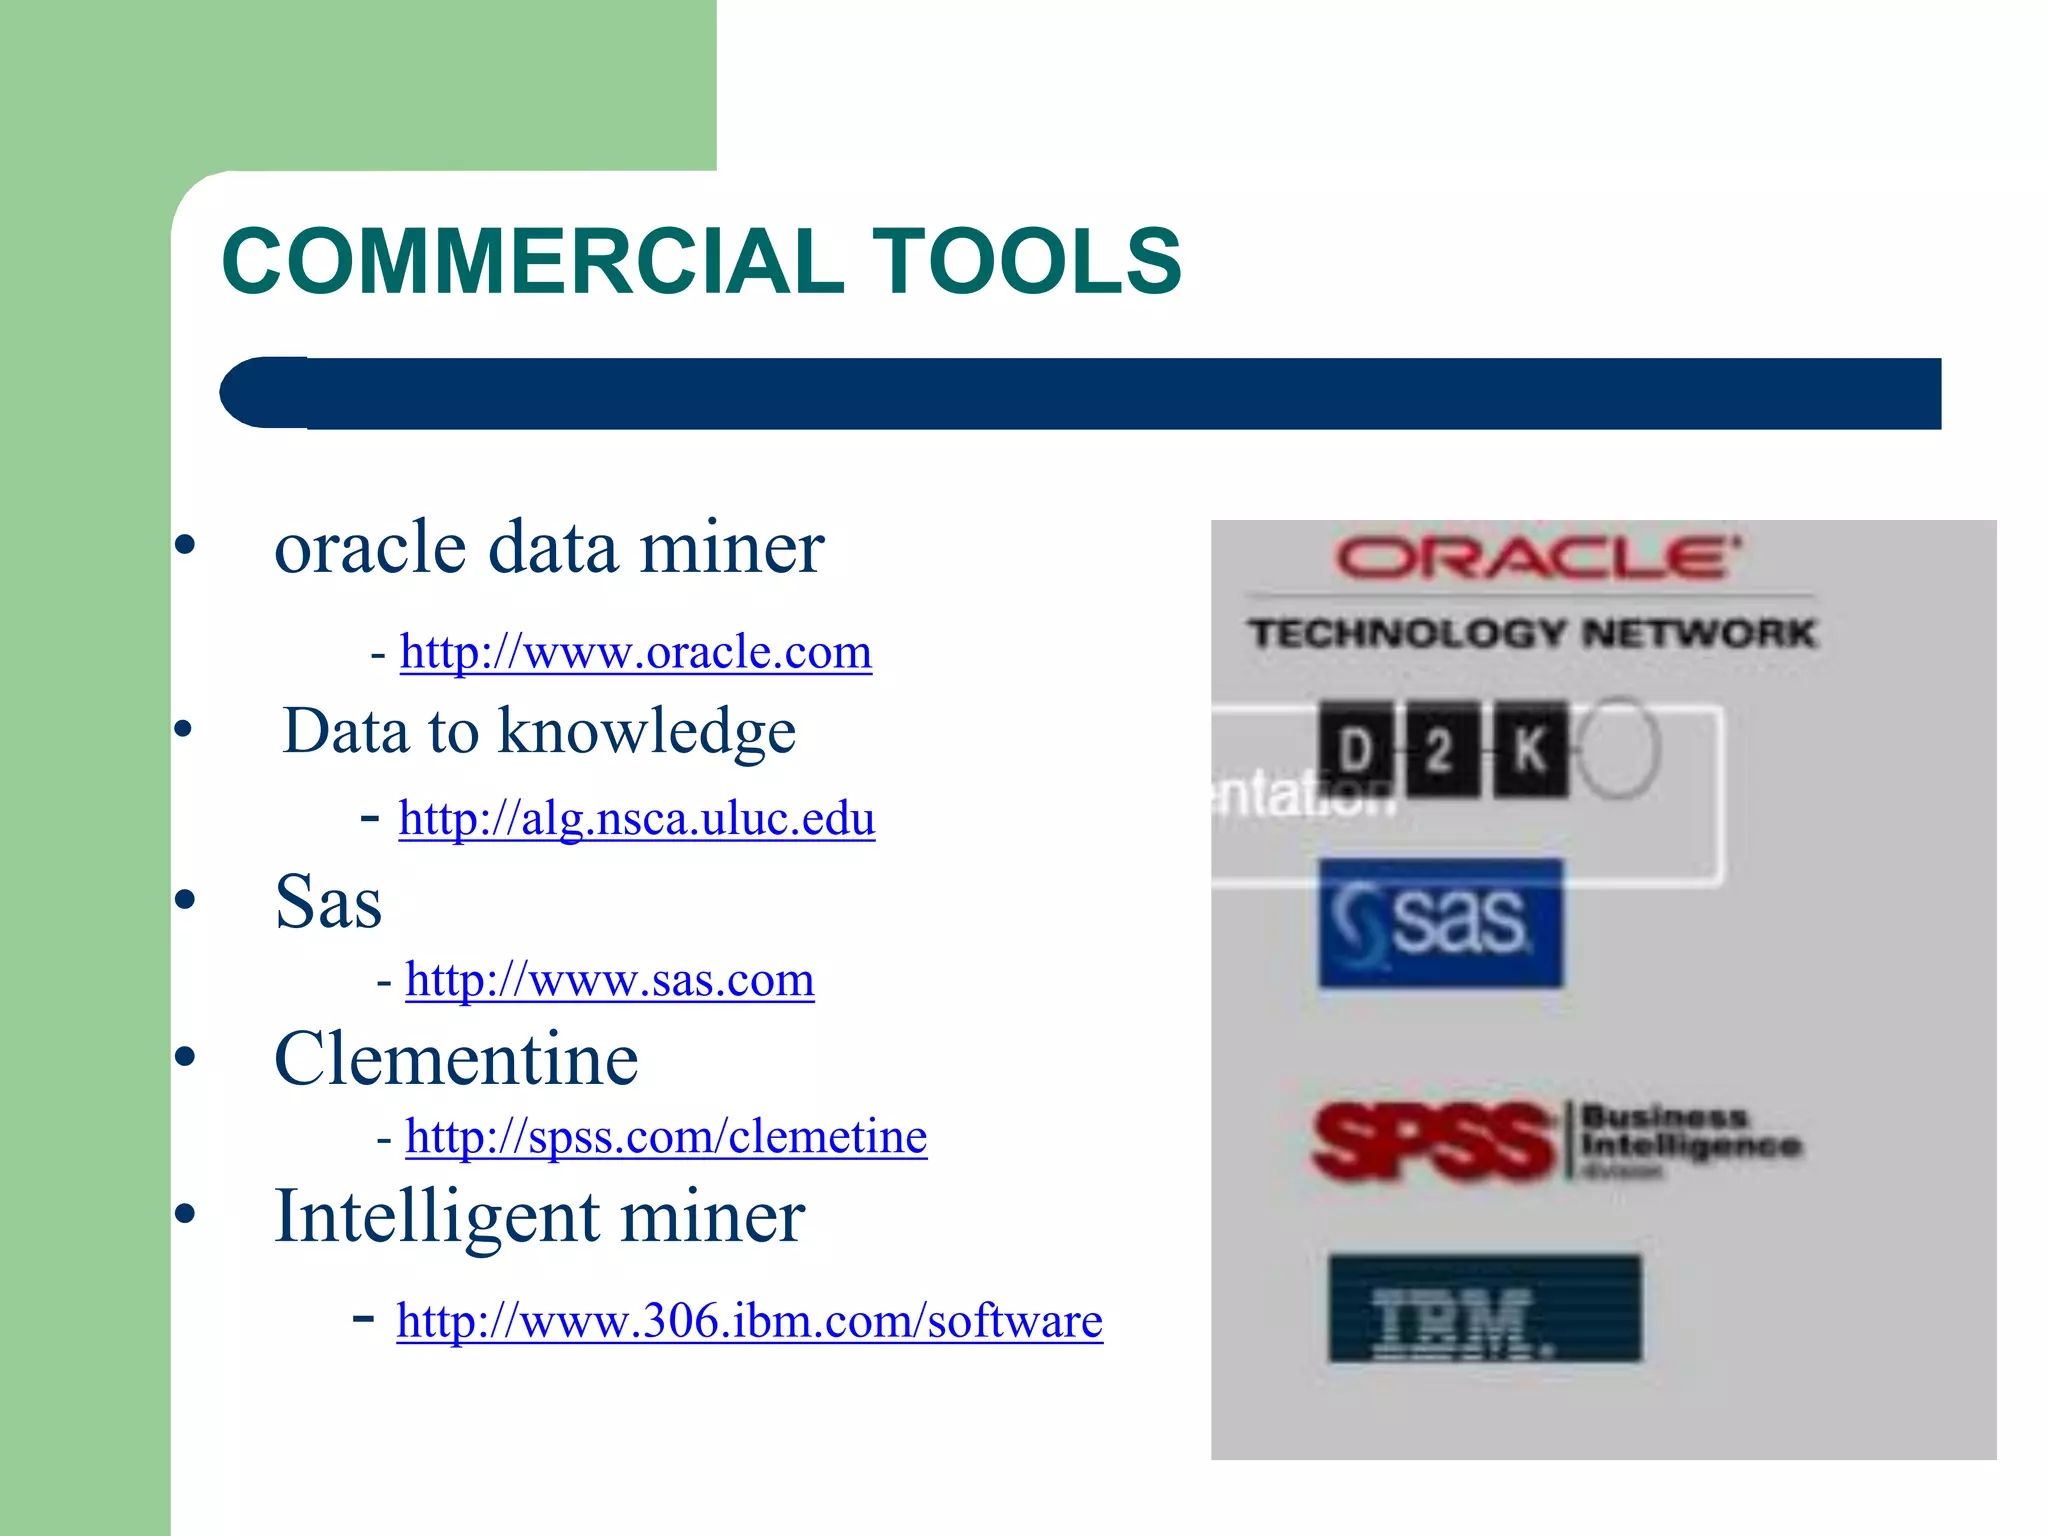
COMMERCIAL TOOLS
• oracledata miner
- http://www.oracle.com
• Data to knowledge
- http://alg.nsca.uluc.edu
• Sas
- http://www.sas.com
• Clementine
- http://spss.com/clemetine
• Intelligent miner
- http://www.306.ibm.com/software
41.
ROLE OF DATAMINING IN AGRICULTURE
o Crop yield estimation.
o Estimation of damage caused by pest.
o Mushroom grading.
o Spatial data mining reveals interesting pattern related to
agriculture.
o Crop price prediction.
o Characterize agricultural soil profiles.
42.
ROLE IN AGRICULTUREDOMAIN
Data mining methodologies application
neural networks focuses on weather
forecasts, prediction of rainfall.
K-means classifying soil in combination
with GPS, wine fermentation
problem, yield prediction.
Fuzzy set for detecting weed in precision
agriculture.
k-nearest neighbor simulating daily precipitation and
other weather condition.
Case study -1
•Data mining techniques were adopted in order to
predict crop production.
• Comparing the estimated values density-based
clustering with estimated values of multiple linear
regression values
Hyderabad Ramesh et al.,2013
45.
OVERVIEW OF DATA
•The data is used years from 1955 to 2009 for East Godavari
district of Andhra Pradesh in India.
• The information gathering process is done with three
government units like Indian Meteorological Department,
Statistical Institution and Agricultural department.
• Each area in this collection is identified by the respective
longitude and latitude of the region.
• the estimation of the crop production is analyzed with respect
to eight parameters namely Year, Rainfall, Area of Sowing,
yield, fertilizers(Nitrogen, Phosphorous, and potassium) And
yield . Cont.....
46.
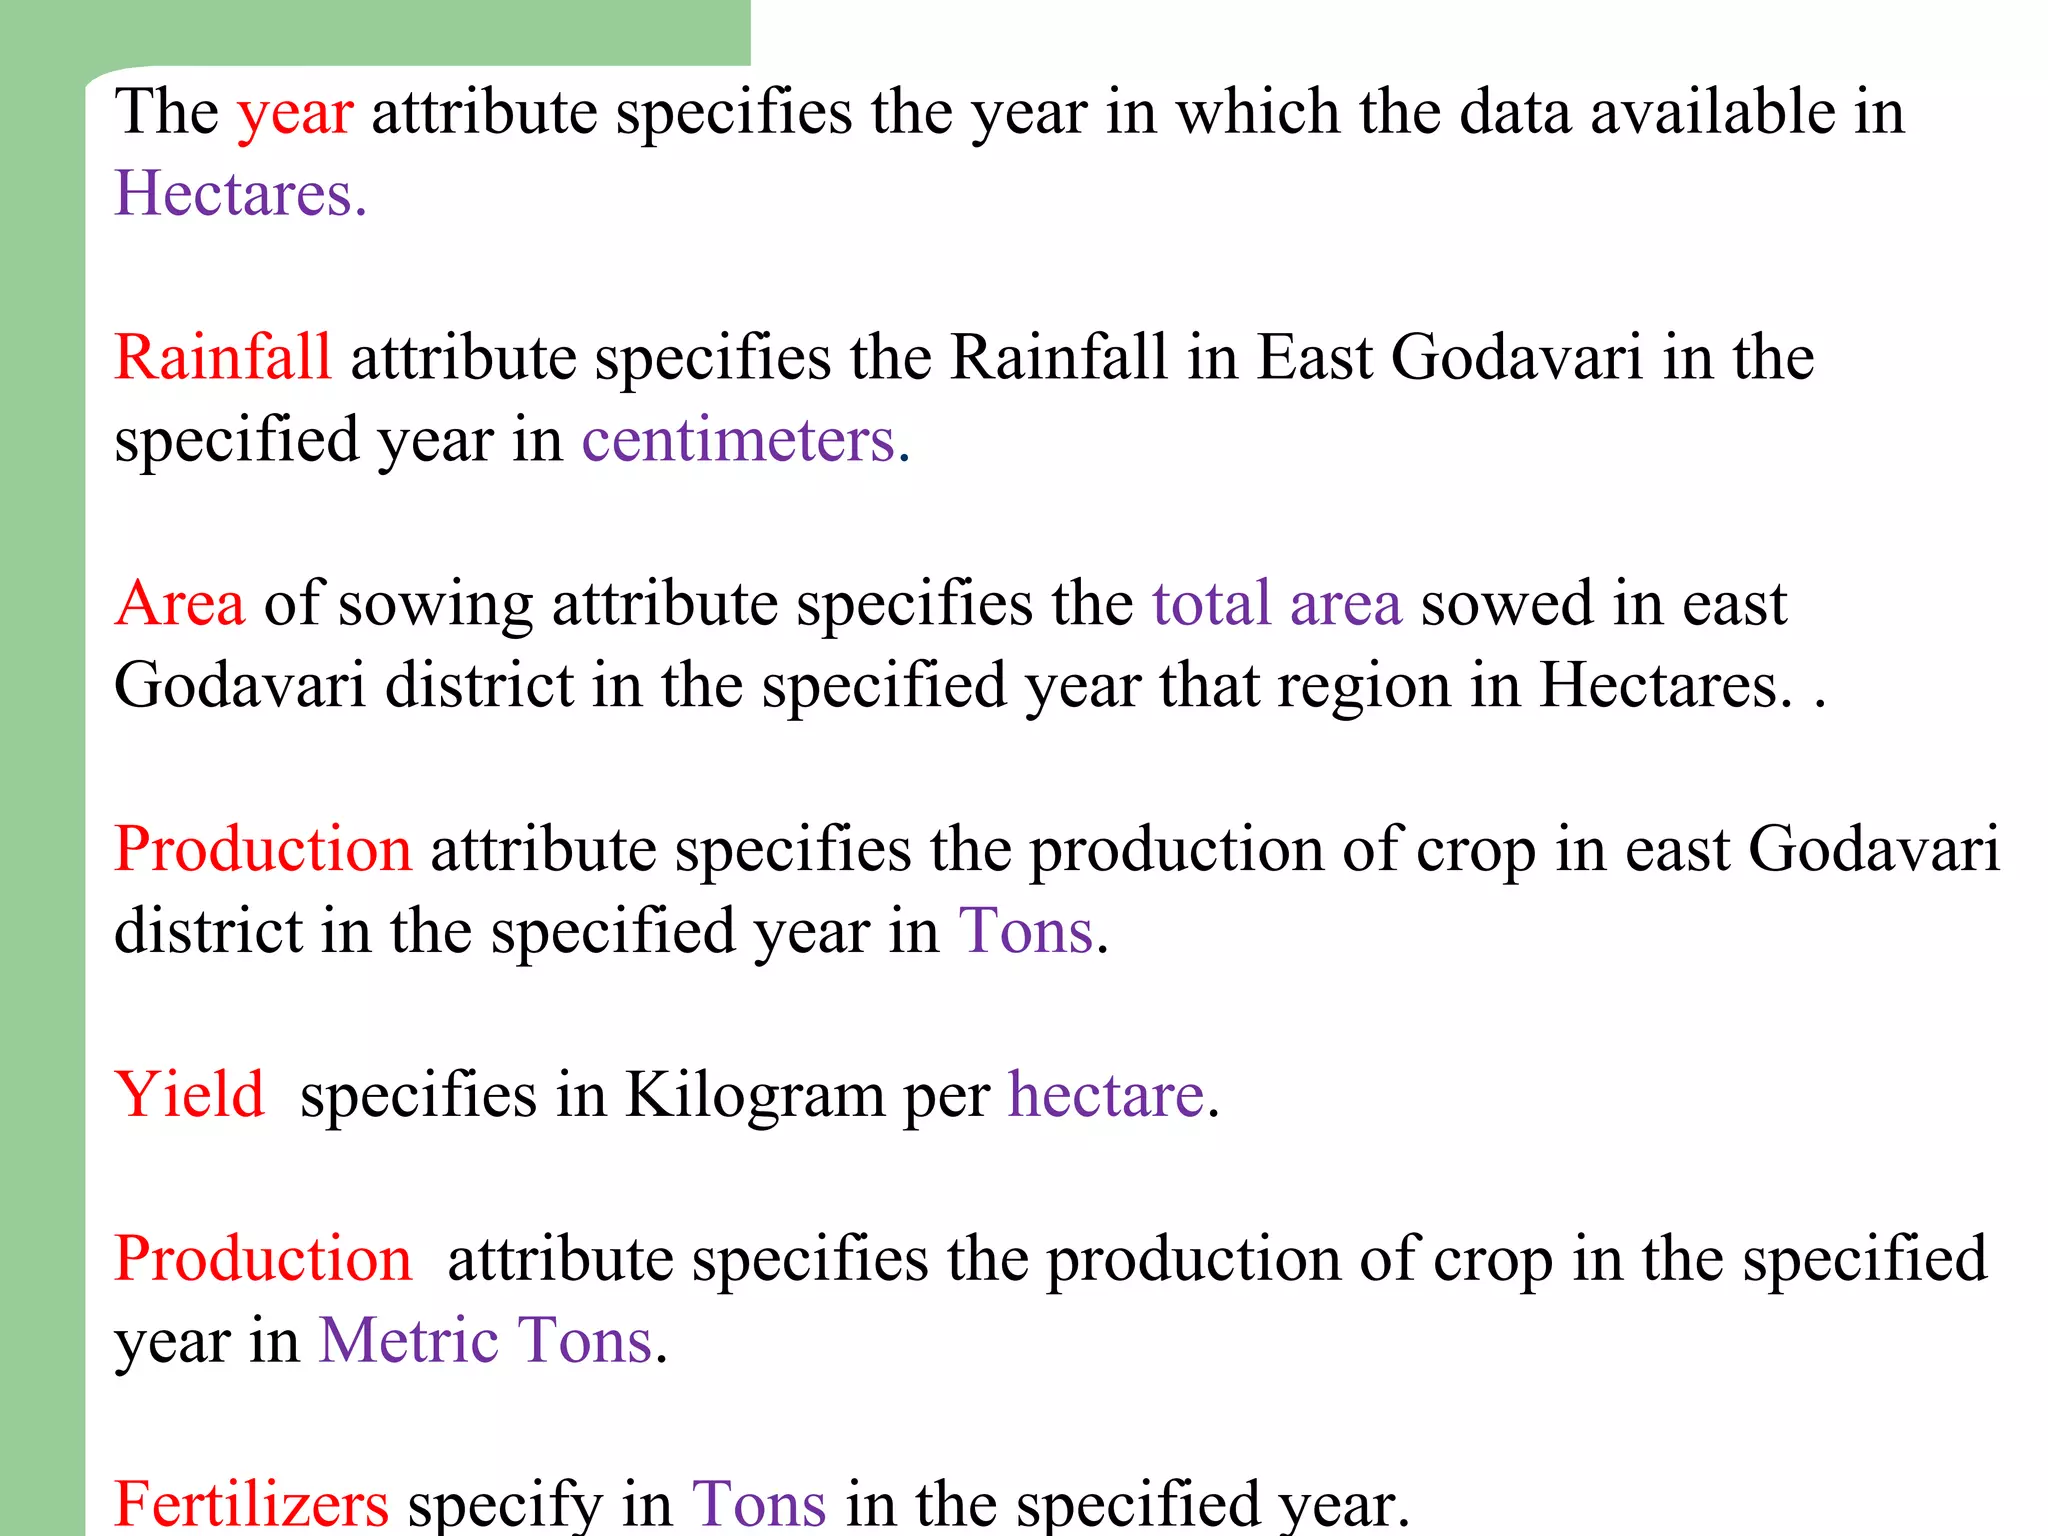
The year attributespecifies the year in which the data available in
Hectares.
Rainfall attribute specifies the Rainfall in East Godavari in the
specified year in centimeters.
Area of sowing attribute specifies the total area sowed in east
Godavari district in the specified year that region in Hectares. .
Production attribute specifies the production of crop in east Godavari
district in the specified year in Tons.
Yield specifies in Kilogram per hectare.
Production attribute specifies the production of crop in the specified
year in Metric Tons.
Fertilizers specify in Tons in the specified year.
47.
METHODOLOGY
• The statisticalmethod namely multiple linear regression
technique and data mining method namely Density-based
clustering technique were take up for the estimation of crop
production analysis.
Multiple Linear Regression:
Multiple linear regression (MLR) is the method used to model
the linear relationship between a dependent variable and one or
more independent variable(s). The dependent variable is
sometimes termed as predictant i.e. rainfall and independent
variables are called predictors i.e. Year, Area of sowing,
Production .
εXβ........XβXββY pp22110
48.
METHODOLOGY (Cont’d……)
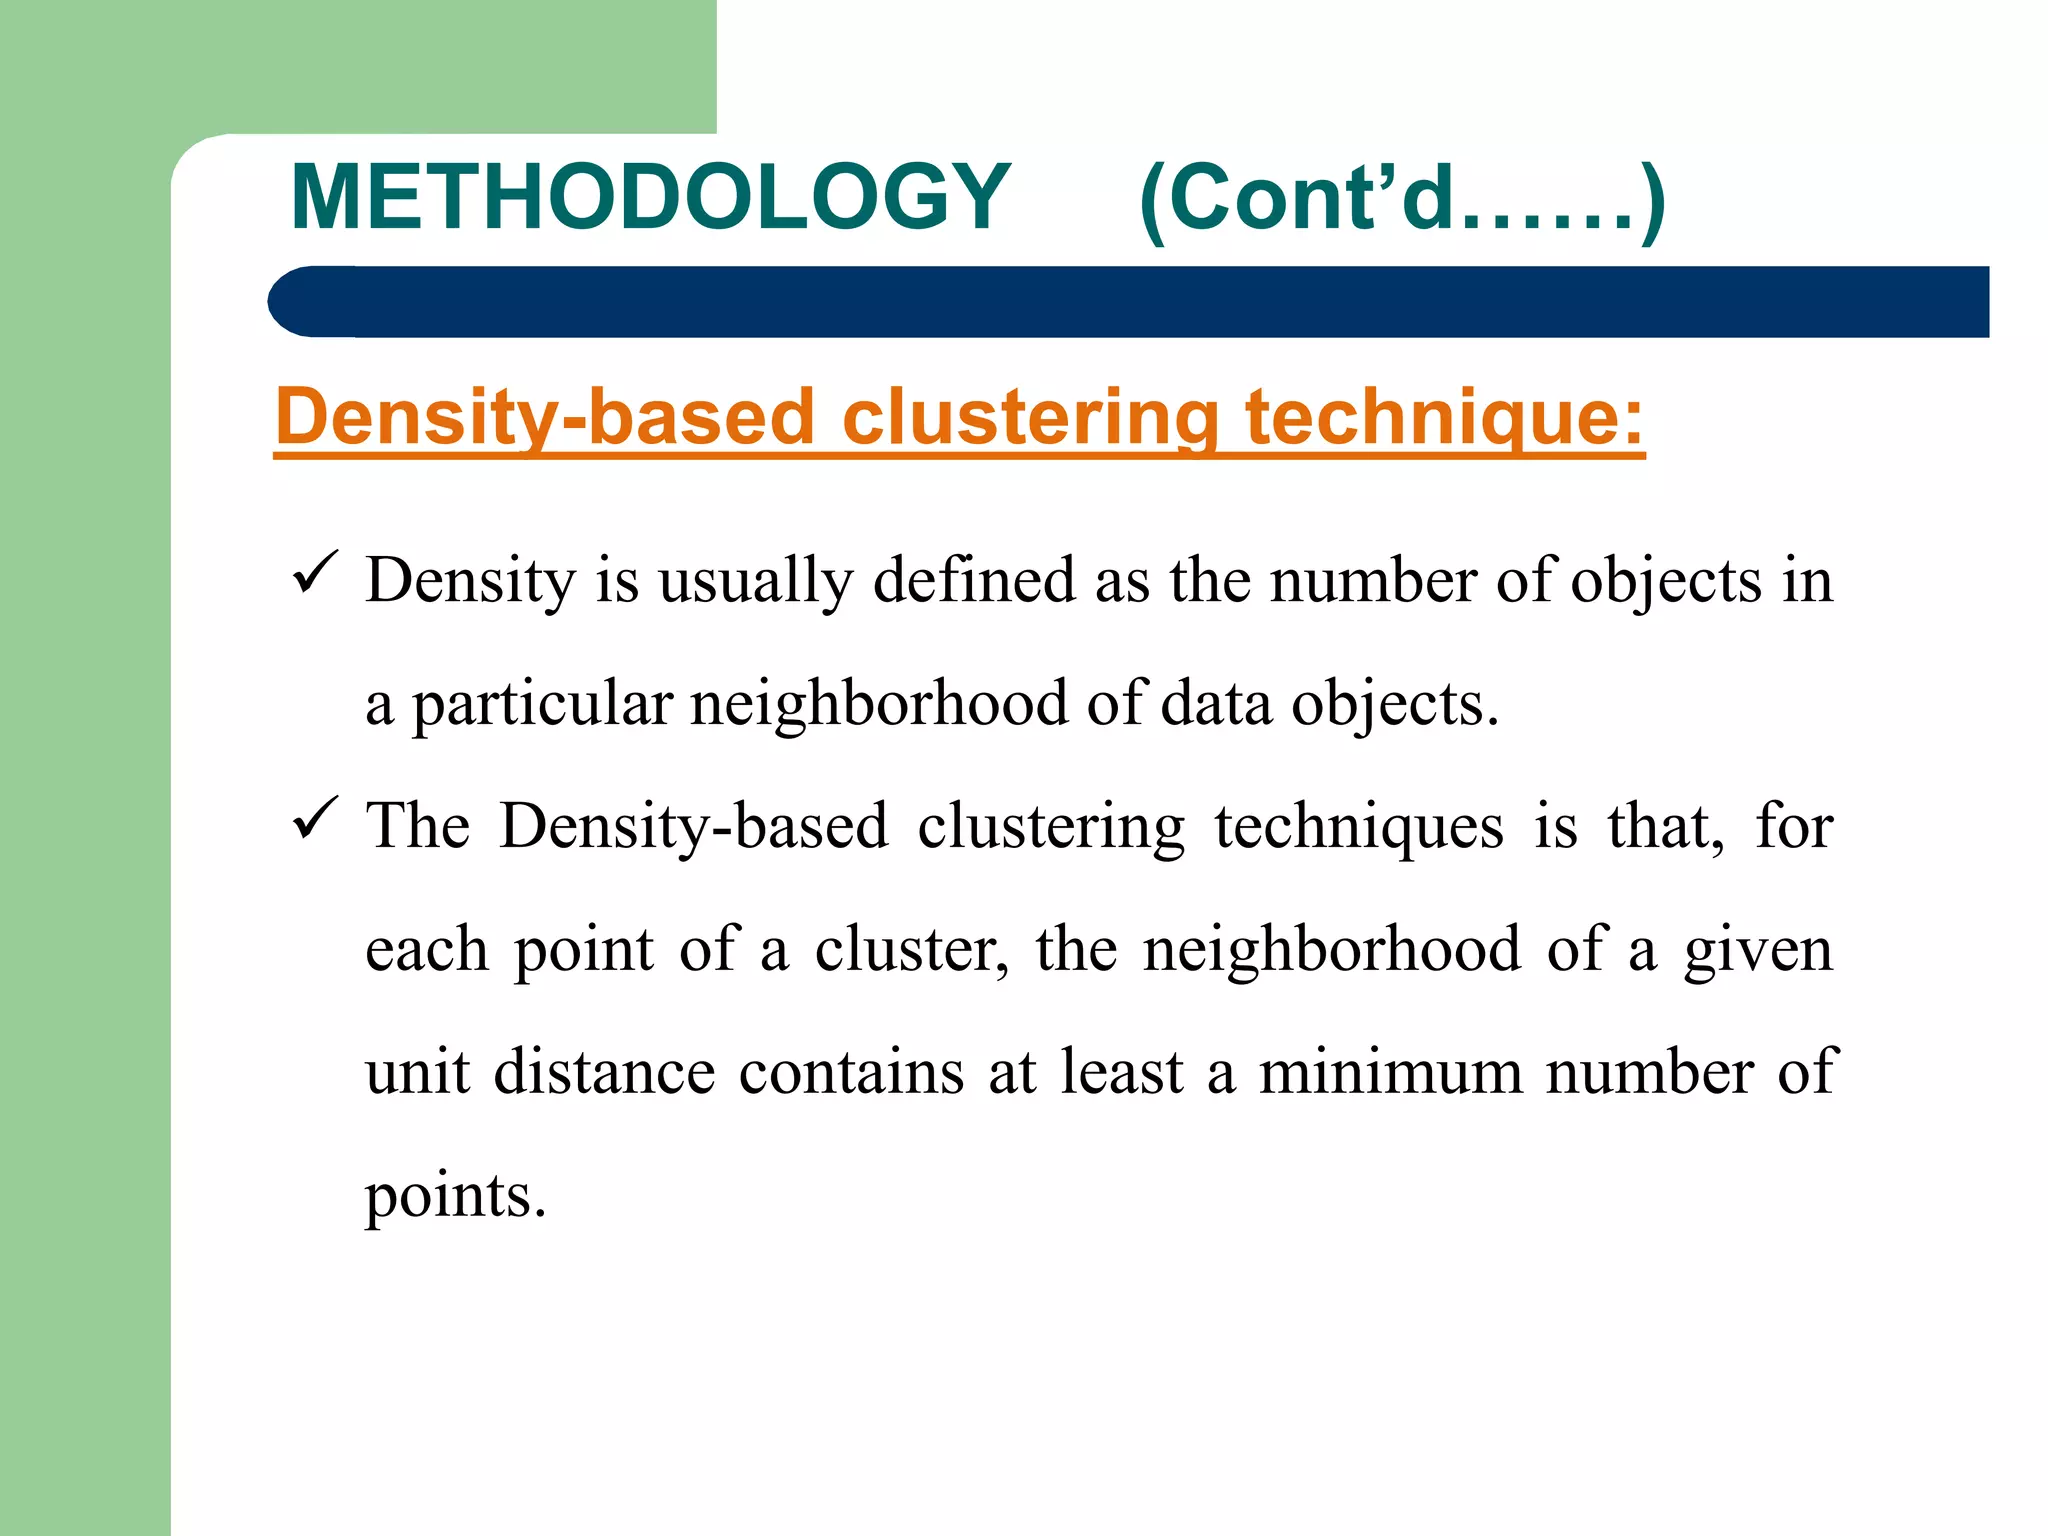
Density-based clusteringtechnique:
Density is usually defined as the number of objects in
a particular neighborhood of data objects.
The Density-based clustering techniques is that, for
each point of a cluster, the neighborhood of a given
unit distance contains at least a minimum number of
points.
49.
Table 1:Exact productionand estimated values using Multiple Linear
Regression technique.
Observation Year Production
( Exact )
40 years interval
Production
(estimation)
Percentage of difference
2000 683423 592461 13
2001 579850 566050 2
2002 551115 579433 -5
2003 762453 722638 5
2004 743614 742752 0
2005 348727 399062 -14
2006 547716 551541 -1
2007 691069 691069 3
2008 716609 697227 3
2009 616567 633494 -3
The estimated results using Multiple Linear Regression technique
which are ranging between -14% and +13% for 40 years interval.
50.
Table-2: Exact productionand Estimated values using Density-based
clustering technique.
Observation Year Production
( Exact )
6 clusters
Production
(estimation)
Percentage of difference
2000 683423 666011 3
2001 579850 651103 -12
2002 551115 566972 -3
2003 762453 703914 8
2004 743614 737897 1
2005 348727 392770 -13
2006 547716 534709 2
2007 691069 791589 -11
2008 716609 676321 6
2009 616567 695574 -13
The estimated results using Density-based clustering technique
which are ranging between -13% and +8% for 6-clusters
approximation.
51.
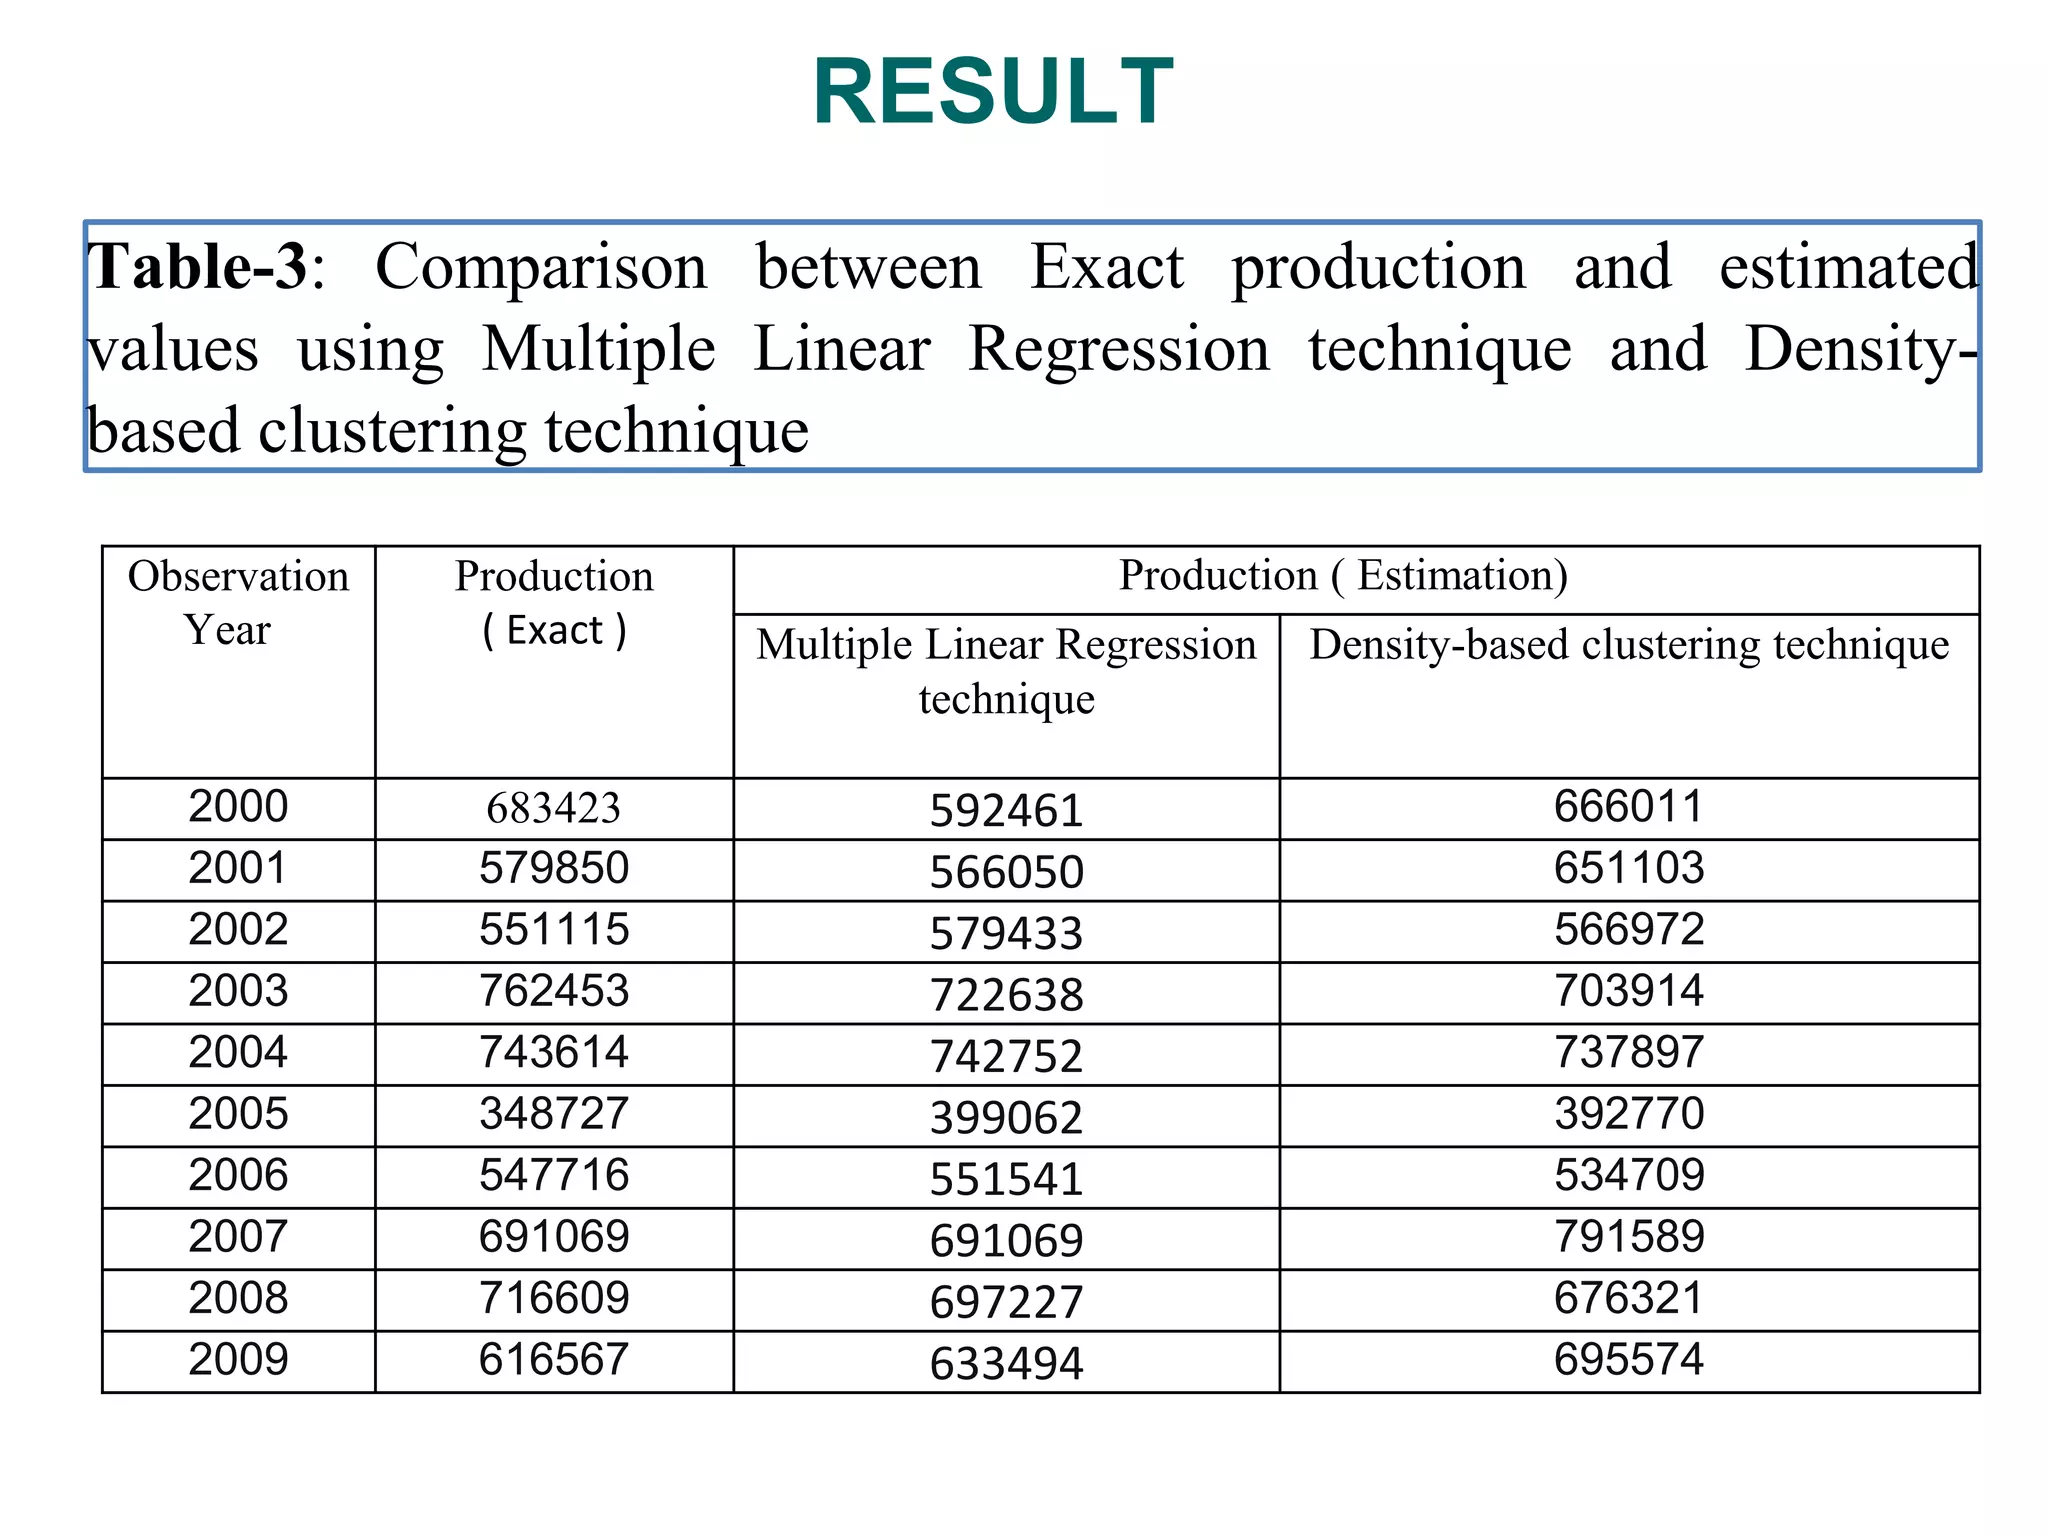
Table-3: Comparison betweenExact production and estimated
values using Multiple Linear Regression technique and Density-
based clustering technique
Observation
Year
Production
( Exact )
Production ( Estimation)
Multiple Linear Regression
technique
Density-based clustering technique
2000 683423 592461 666011
2001 579850 566050 651103
2002 551115 579433 566972
2003 762453 722638 703914
2004 743614 742752 737897
2005 348727 399062 392770
2006 547716 551541 534709
2007 691069 691069 791589
2008 716609 697227 676321
2009 616567 633494 695574
RESULT
53.
CONCLUSION
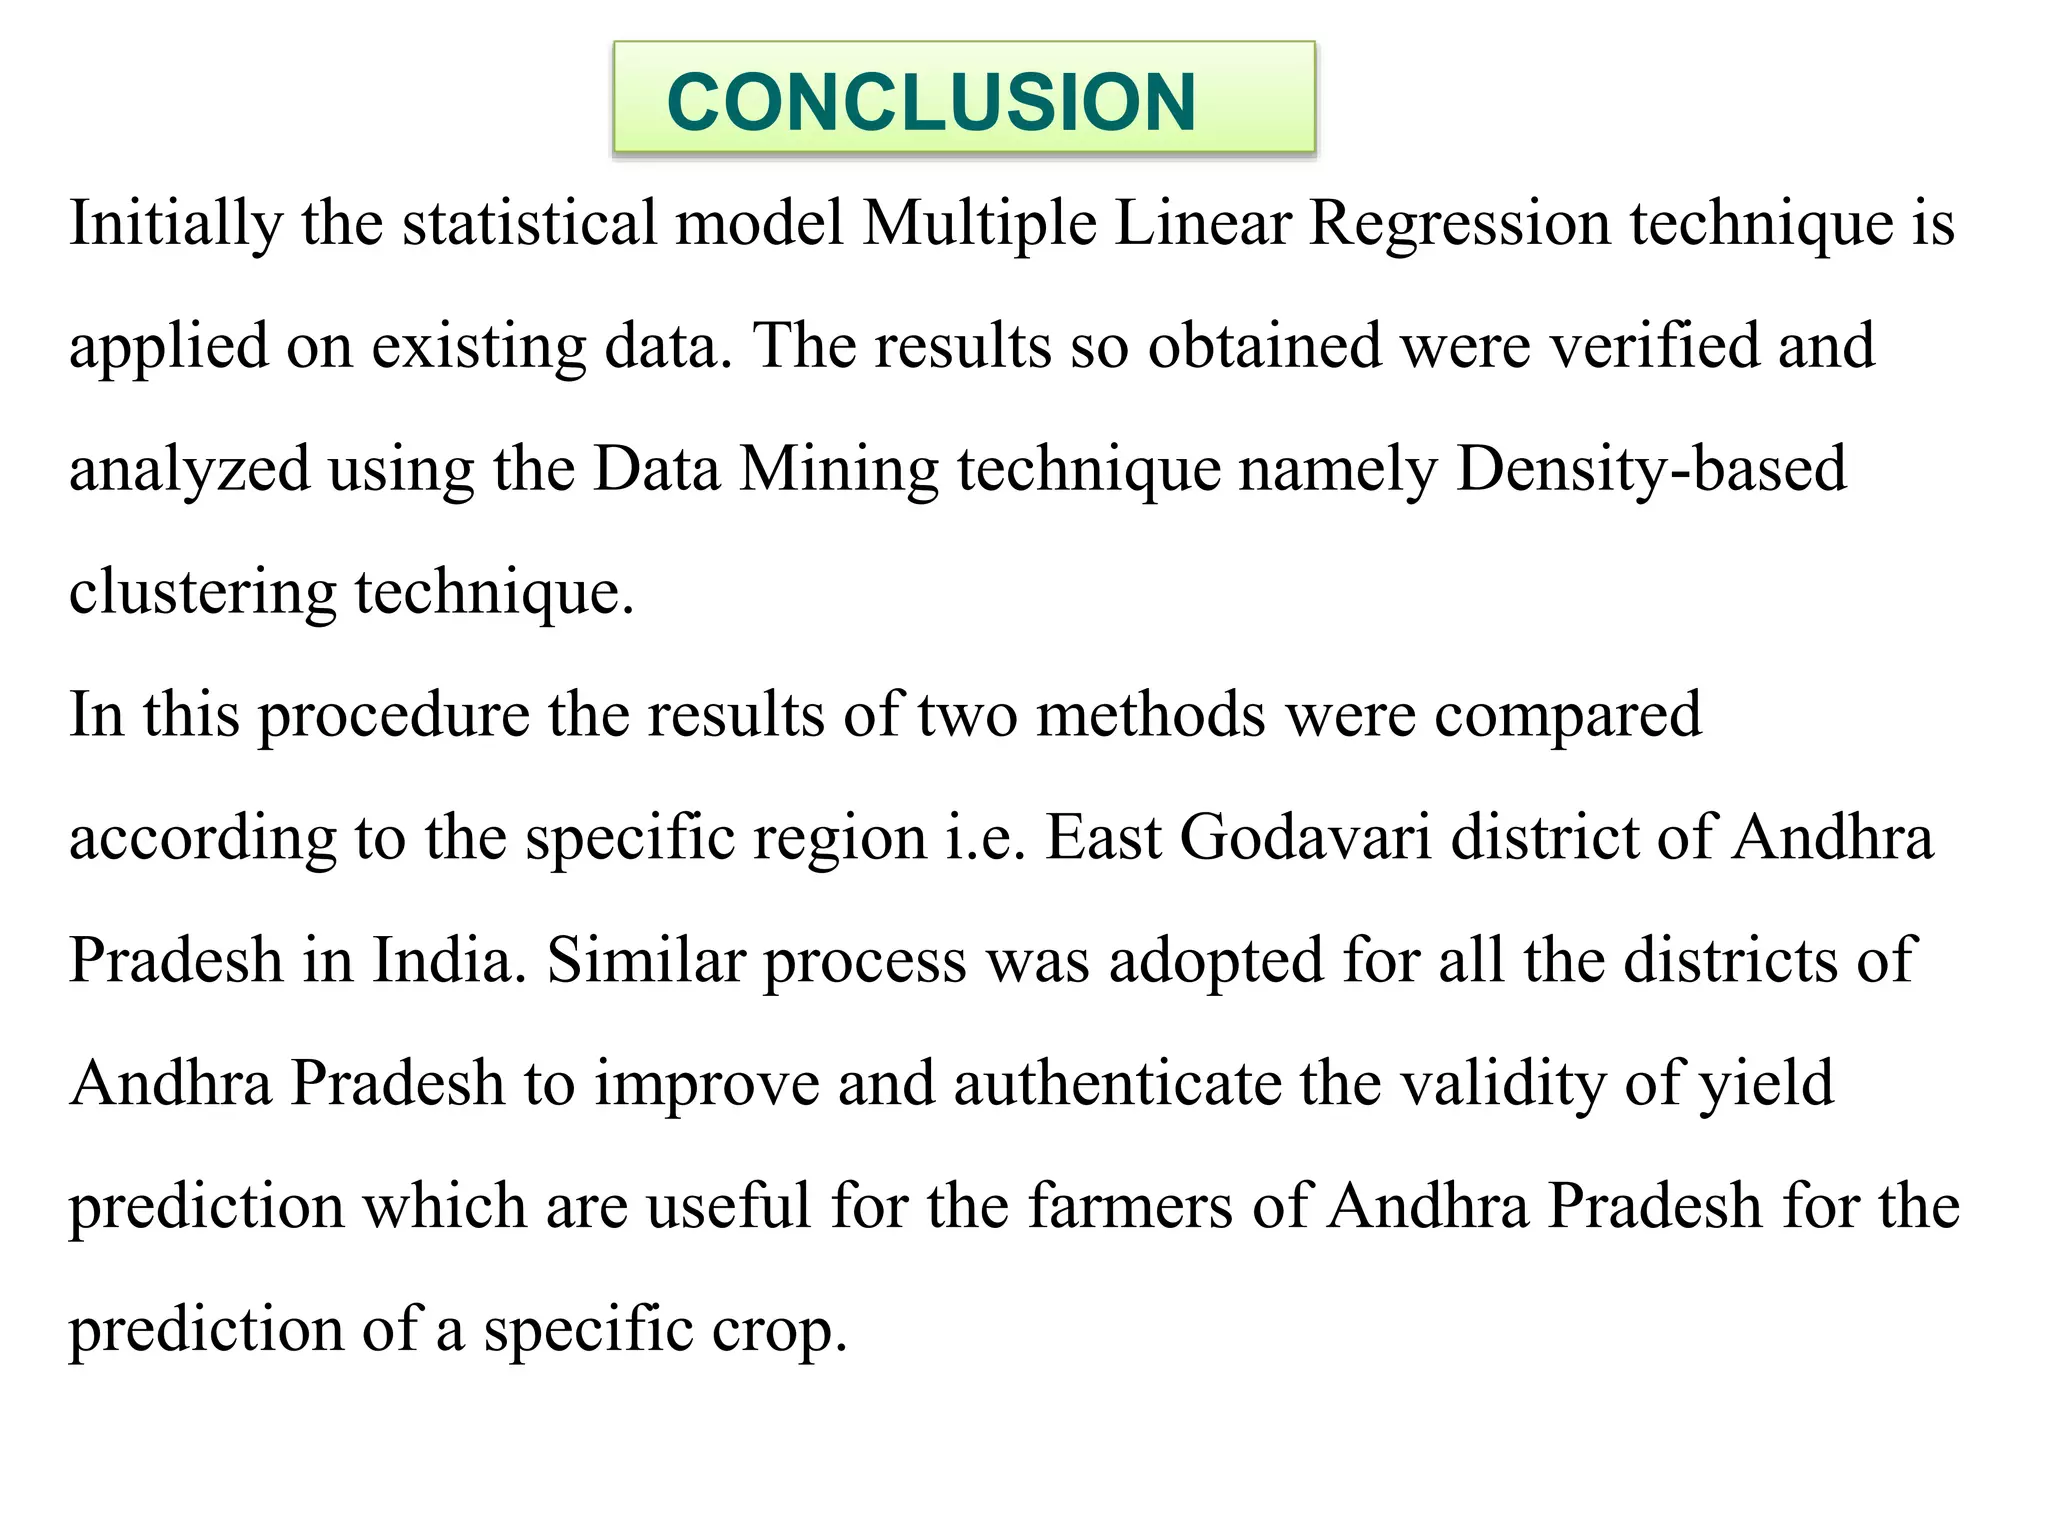
Initially the statisticalmodel Multiple Linear Regression technique is
applied on existing data. The results so obtained were verified and
analyzed using the Data Mining technique namely Density-based
clustering technique.
In this procedure the results of two methods were compared
according to the specific region i.e. East Godavari district of Andhra
Pradesh in India. Similar process was adopted for all the districts of
Andhra Pradesh to improve and authenticate the validity of yield
prediction which are useful for the farmers of Andhra Pradesh for the
prediction of a specific crop.
54.
CONCLUSION
Data miningis boon for large data in Agriculture.
Extraction of knowledge is a big challenge.
A lot of data mining techniques are developed today
to tackle the challenge.
Skill is also required to handle the tools and
techniques.
55.
REFERENCE
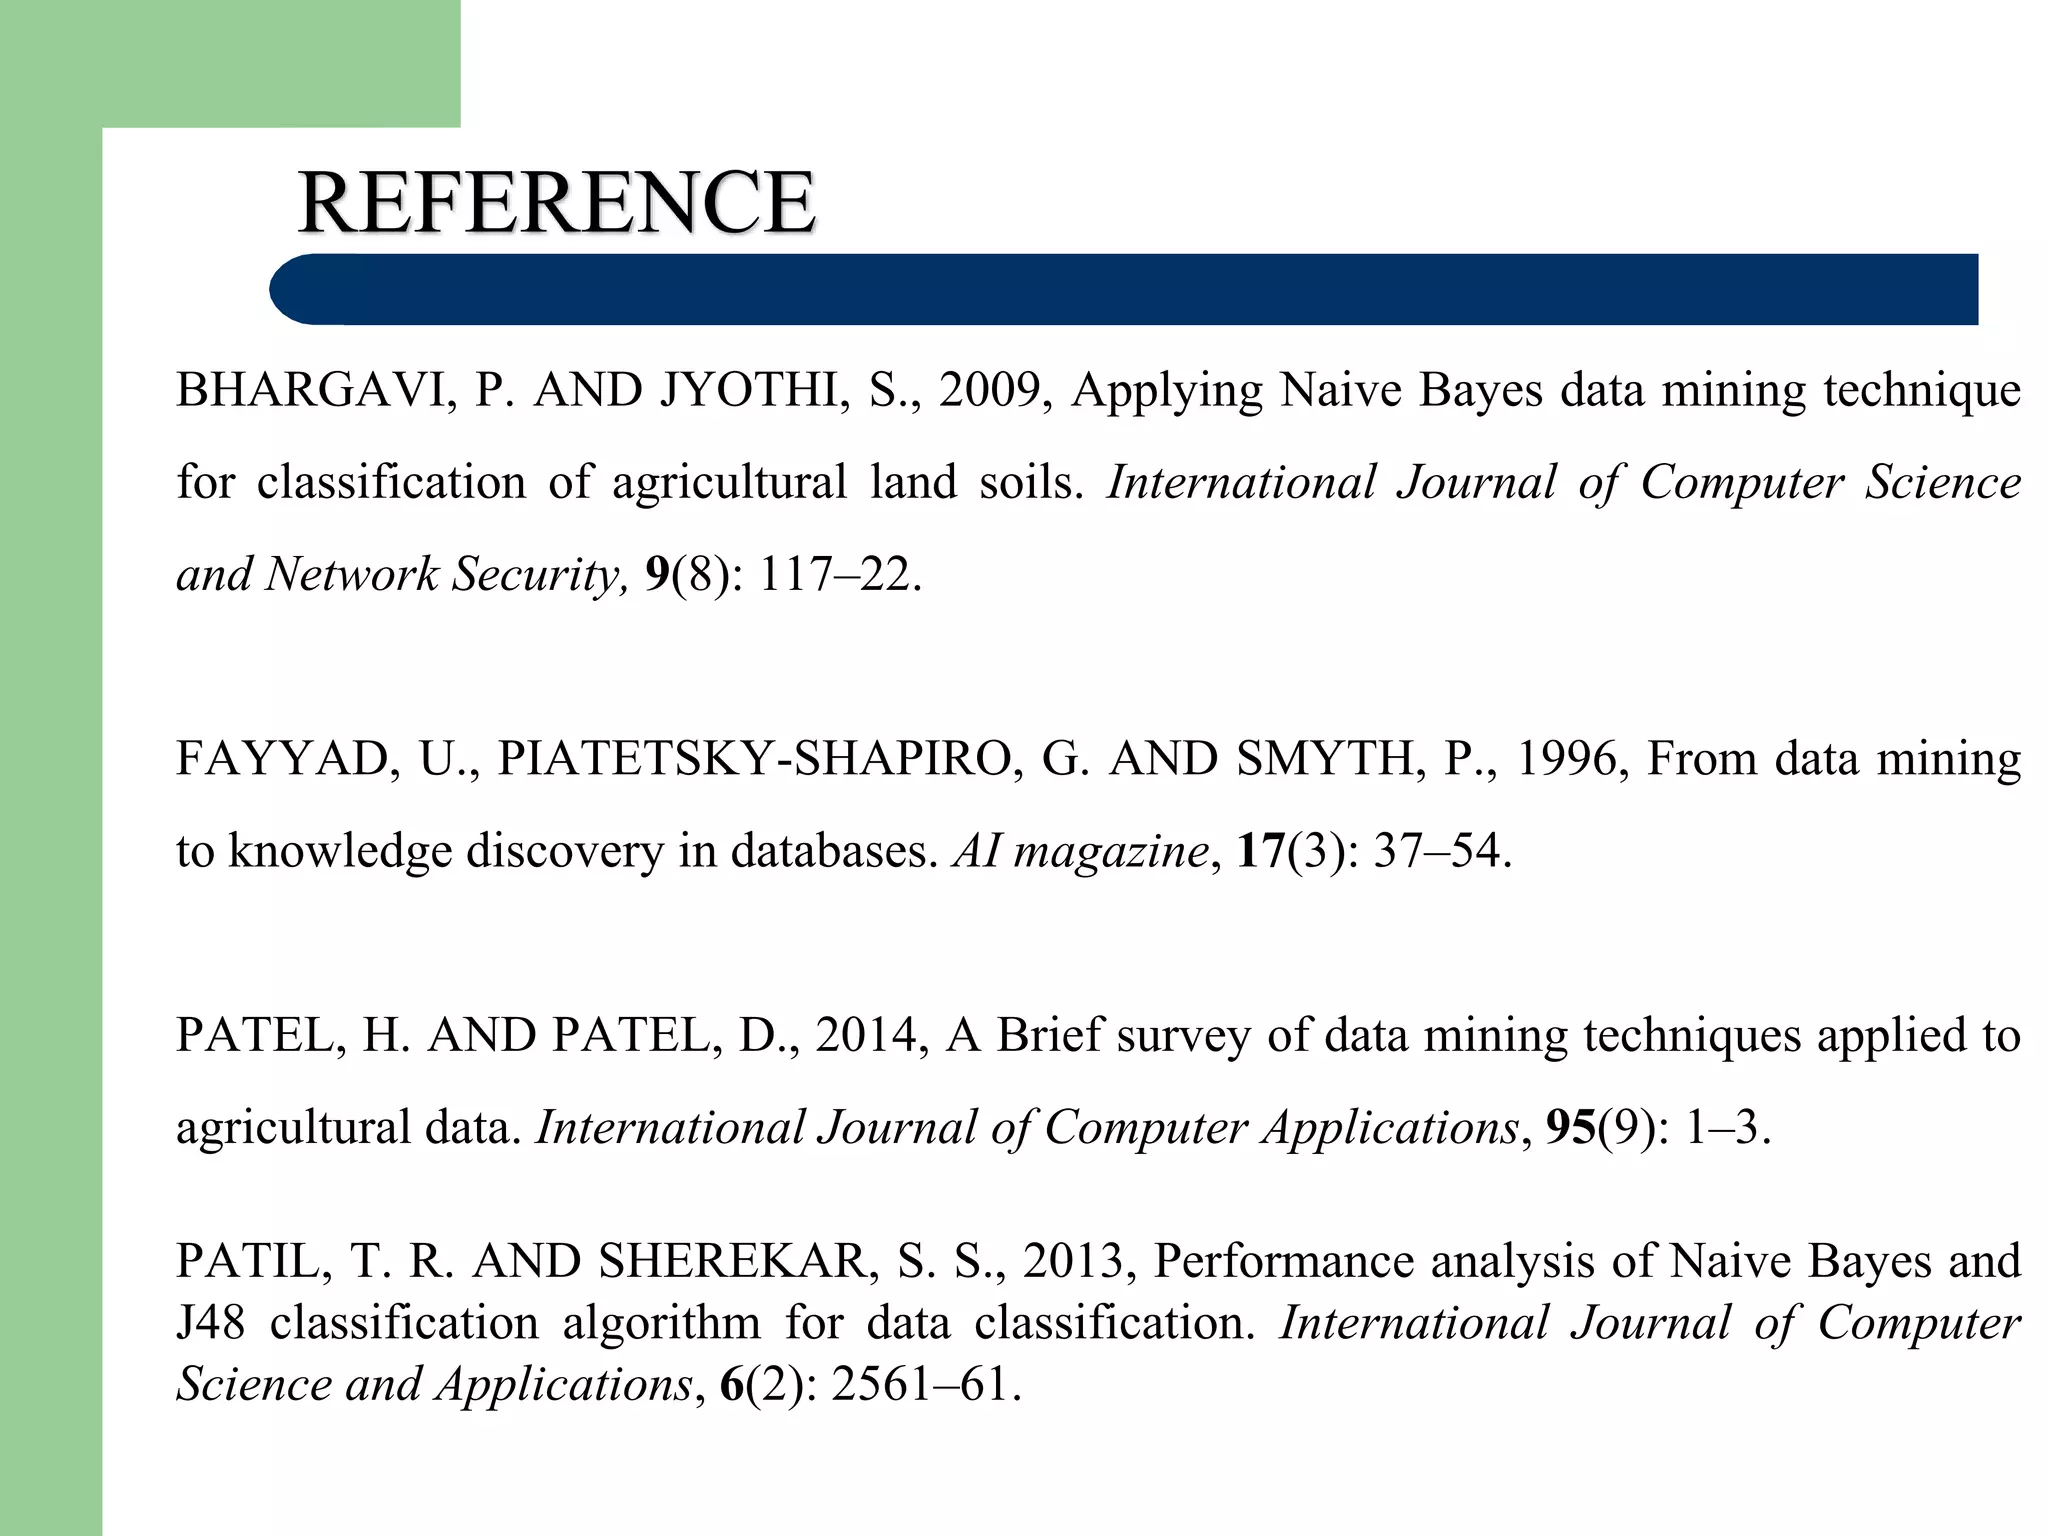
BHARGAVI, P. ANDJYOTHI, S., 2009, Applying Naive Bayes data mining technique
for classification of agricultural land soils. International Journal of Computer Science
and Network Security, 9(8): 117–22.
FAYYAD, U., PIATETSKY-SHAPIRO, G. AND SMYTH, P., 1996, From data mining
to knowledge discovery in databases. AI magazine, 17(3): 37–54.
PATEL, H. AND PATEL, D., 2014, A Brief survey of data mining techniques applied to
agricultural data. International Journal of Computer Applications, 95(9): 1–3.
PATIL, T. R. AND SHEREKAR, S. S., 2013, Performance analysis of Naive Bayes and
J48 classification algorithm for data classification. International Journal of Computer
Science and Applications, 6(2): 2561–61.
56.
RAMESH, V. ANDRAMAR, K., 2011, Classification of agricultural land soils: a
data mining approach. Agricultural Journal, 6(3): 82–6.
RAMESH, D. AND VARHADAN, V. B., 2013, Data Mining Techniques and
Applications to Agricultural Yield Data. International Journal of Advanced Research
in Computer and Communications Engineering, 2 (9): 3477-3482.
SHARMA, L. AND MEHTA, N., 2012, Data Mining Techniques: A Tool for
Knowledge Management System in Agriculture. International Journal of Scientific
and Technology Research, 1(5): 67-73.
VEENADHARI, S., MISRA, B. AND SINGH, C. D., 2011, Data mining Techniques
for Predicting Crop Productivity – A review article. International Journal of
Computer Science and Technology, 2(1): 114-118.


![[DSC Europe 25] Dragan Vucic - Building the Learning Organization - How AI Tr...](https://cdn.slidesharecdn.com/ss_thumbnails/8brigo2sbu6qur6gxrra-7-251205085715-6ae07d24-thumbnail.jpg?width=640&height=640&fit=bounds)
![[DSC Europe 25] Nikola Rajovic - Hardware Technologies Under the Hood: RISC-V...](https://cdn.slidesharecdn.com/ss_thumbnails/o2gptrmtoyqndgoshwgq-dsc2025-tenstorrent-rajovic-251205090438-814685f5-thumbnail.jpg?width=640&height=640&fit=bounds)


![[DSC Europe 25] Jim Sterne - Adopting Generative AI Capabilities Into the Ent...](https://cdn.slidesharecdn.com/ss_thumbnails/sxhpofuorcagxsaulkmt-3-251204082258-7e66bc48-thumbnail.jpg?width=640&height=640&fit=bounds)
![[DSC Europe 25] Marija Vlajkovic & Andrea Radonjanin - Integration of AI tool...](https://cdn.slidesharecdn.com/ss_thumbnails/qf1jrglttoc3bm8s3aop-final-integration-of-ai-tools-251208151905-394f3a6a-thumbnail.jpg?width=640&height=640&fit=bounds)

![[DSC Europe 25] Goran Obradovic - The Rise of Sovereign AI: Building the Regi...](https://cdn.slidesharecdn.com/ss_thumbnails/7nw2xxixrxqdxvrb5wca-6-251205085714-ab09a2ac-thumbnail.jpg?width=640&height=640&fit=bounds)


