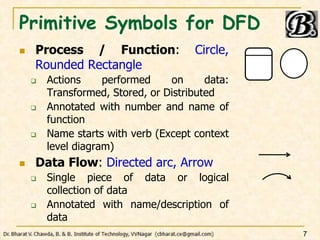
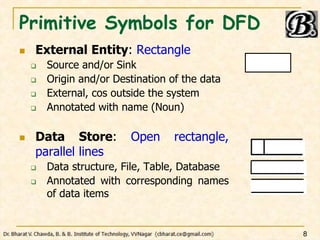
SlideShare a Scribd company logo
1 of 40
DFD:
Data Flow Diagram
by:
Dr. Bharat V. Chawda
Computer Engineering Department,
BBIT, VVNagar, Gujarat, India
1
Overview
 A Concept
 Primitive Symbols
 Context Diagram
 Level 1 Diagram
 Decomposition
 Example
 Do’s and Don’ts
 Shortcomings
2
A Concept: Simple Example
 RMS: Root Mean Square
3
RMS
Calculator
0
User
I/P Data
rms
Validate
input
1
Compute
RMS
2
Valid Data
Display
result
3
rms rms
Further Decomposition…
I/P Data
Concept
 “A graphical representation of the flow of
data through an information system, modelling
its process aspects.”
 “A hierarchical graphical model of a system
that shows –
 The different processing activities / functions that
the system performs, and
 The data interchange among those functions.”
 Also known as the Bubble Chart
4
Concept
 Shows:
 What data is Input; Who generates it: Source
 What data is O/P; Who receives it: Destination/Sink
 What processing is performed on data; by whom: Proc
 Where data come from and go to: Data Flow
 What data is stored; where: Data Store
 Does not show:
 Timing of processes: Executed in parallel or sequence
 Conditions: based on which functions may or may not
get executed
 Control flow / Algorithmic details
 That’s why: Different from Flowchart
5
Concept
 Why Popular?
 Easy to understand by technical and non-technical
persons
 Can provide high level system overview; with
boundaries and connections to other systems
 Can provide a detailed representation of system
components
 Uses limited number of primitive symbols (only four)
 Provides hierarchy of DFDs – Reduces complexity using
abstraction at each level
 Top level: Most abstract: Context Diagram / Level 0 Diagram
 Next level: Level 1 Diagram
 Further levels: Level 2, 3, 4…
6
Primitive Symbols for DFD
 Process / Function: Circle,
Rounded Rectangle
 Actions performed on data:
Transformed, Stored, or Distributed
 Annotated with number and name of
function
 Name starts with verb (Except context
level diagram)
 Data Flow: Directed arc, Arrow
 Single piece of data or logical
collection of data
 Annotated with name/description of
data
7
Primitive Symbols for DFD
 External Entity: Rectangle
 Source and/or Sink
 Origin and/or Destination of the data
 External, cos outside the system
 Annotated with name (Noun)
 Data Store: Open rectangle,
parallel lines
 Data structure, File, Table, Database
 Annotated with corresponding names
of data items
8
Context or Level 0 Diagram
 Concept:
Most abstract representation of the system
Highest level or simplest representation of system
Entire system as single bubble – annotated with
software name (noun is used for naming bubble)
Represents the context in which system would
exist – external entities, data input to the system,
data output from the system
9
Context or Level 0 Diagram
 Main steps:
Identify where data is captured from: Source
Identify where data is distributed to: Destination
Describe the overall process
Map these out in a diagram using the correct
symbols
Link them with data flows that are labelled
10
Level 1 Diagram
 Concept:
Represents high level functions of the system –
derived based on functional requirements from
SRS
3 to 7 bubbles – each representing single high
level function
Input data to these functions
Output data from these functions
External entities can be avoided
Data store can be introduced at this level or at
next levels
11
Level 1 Diagram
 Main steps:
 Identify and draw the processes that make up the Level 0
process: High level functions
 Allocate descriptions to these processes
 Lay out the sources/sinks and data flows from the
Level 0 diagram
 Draw in any data stores used in the process
 Link the new processes and data stores with named data
links: Data flows
12
Decomposition
 Concept:
Also knows as factoring or exploding a bubble
Bubbles are decomposed into sub-functions at
the successive levels of the DFD model
Decomposition into 3 to 7 bubbles
Too few: superfluous, redundant, trivial
Too many: makes DFD model hard to understand
How far: until function can be described using
simple algorithm or instructions
13
Decomposition
 Numbering:
Numbering:
Context Level DFD: 0
Level 1 DFD: 1,2,3…
Level 2 DFD: 1.1, 1.2,…, 2.1,2.2,…
 Balancing:
The data that flow into or out of a bubble must
match the data flow at the next level of DFD.
14
Decomposition/Level ‘n’ Diagram
 Main steps:
 Identify and draw the processes that make up the Level
n-1 process
 Allocate descriptions to these processes
 Lay out all the data flows from the Level n-1 diagram
 Draw in any data stores used in the process
 Link the new processes and data stores with named data
links: Data flows
15
Ex: Food Order System
 Description
 Customer provides order.
 System produces receipt by referring order and gives to
customer.
 Order is also sent to kitchen department.
 Based on order, “Goods sold” and “Inventory” files are
updated.
 Reports for the top management regarding sales,
inventory depletion (income, expenditure) are generated.
16
Context or Level 0 Diagram
 Main steps:
Identify where data is captured from
Identify where data is distributed to
Describe the overall process
Map these out in a diagram using the
correct symbols
Link them with data flows that are labelled
17
Context or Level 0 Diagram
18
CUSTOMER
Context or Level 0 Diagram
 Main steps:
Identify where data is captured from
Identify where data is distributed to
Describe the overall process
Map these out in a diagram using the
correct symbols
Link them with data flows that are labelled
19
Context or Level 0 Diagram
20
CUSTOMER KITCHEN
RESTAURANT
MANAGER
Context or Level 0 Diagram
 Main steps:
Identify where data is captured from
Identify where data is distributed to
Describe the overall process
Map these out in a diagram using the
correct symbols
Link them with data flows that are labelled
21
Context or Level 0 Diagram
22
Food
Ordering
System
0
CUSTOMER KITCHEN
RESTAURANT
MANAGER
Context or Level 0 Diagram
 Main steps:
Identify where data is captured from
Identify where data is distributed to
Describe the overall process
Map these out in a diagram using the
correct symbols
Link them with data flows that are
labelled
23
Disclaimer
24
Food
Ordering
System
0
CUSTOMER KITCHEN
RESTAURANT
MANAGER
Receipt
Food Order
Management
Reports
Customer Order
Level 1 Diagram
 Main steps:
 Identify and draw the processes that make up the
Level 0 process
 Allocate descriptions to these processes
 Lay out the sources/sinks and data flows from the Level 0
diagram
 Draw in any data stores used in the process
 Link the new processes and data stores with named data
links
25
Level 1 Diagram
26
1.0
Receive and
transform
Customer
Food Order
3.0
Update
Inventory
file
2.0
Update
Goods Sold
file
4.0
Produce
Management
Reports
Level 1 Diagram
 Main steps:
 Identify and draw the processes that make up the Level 0
process
 Allocate descriptions to these processes
 Lay out the sources/sinks and data flows from the
Level 0 diagram
 Draw in any data stores used in the process
 Link the new processes and data stores with named data
links
27
Level 1 Diagram
28
1.0
Receive and
transform
Customer
Food Order
3.0
Update
Inventory
file
2.0
Update
Goods Sold
file
4.0
Produce
Management
Reports
Receipt
Customer Order
CUSTOMER KITCHEN
Food Order
RESTAURANT
MANAGER
Management
Reports
Level 1 Diagram
 Main steps:
 Identify and draw the processes that make up the Level 0
process
 Allocate descriptions to these processes
 Lay out the sources/sinks and data flows from the Level 0
diagram
 Draw in any data stores used in the process
 Link the new processes and data stores with named data
links
29
Level 1 Diagram
30
1.0
Receive and
transform
Customer
Food Order
3.0
Update
Inventory
file
2.0
Update
Goods Sold
file
4.0
Produce
Management
Reports
Receipt
Customer Order
CUSTOMER KITCHEN
Food Order
RESTAURANT
MANAGER
Management
Reports
D1 Goods Sold File D2 Inventory File
Level 1 Diagram
 Main steps:
 Identify and draw the processes that make up the Level 0
process
 Allocate descriptions to these processes
 Lay out the sources/sinks and data flows from the Level 0
diagram
 Draw in any data stores used in the process
 Link the new processes and data stores with
named data links
31
Level 1 Diagram
32
1.0
Receive and
transform
Customer
Food Order
3.0
Update
Inventory
file
2.0
Update
Goods Sold
file
4.0
Produce
Management
Reports
Receipt
Customer Order
CUSTOMER KITCHEN
Food Order
RESTAURANT
MANAGER
Management
Reports
Goods
Sold
Inventory
Data
Goods
Sold Data
Inventory
Data
Daily Goods Sold Amount Daily Inventory Depletion Amount
D1 Goods Sold File D2 Inventory File
Level ‘n’ Diagram
 Main steps:
 Identify and draw the processes that make up the Level
n-1 process
 Allocate descriptions to these processes
 Lay out the sources/sinks and data flows from the Level
n-1 diagram
 Draw in any data stores used in the process
 Link the new processes and data stores with named data
links
33
Level 2 Diagram
34
4.0
Produce
Management
Reports
Management
Reports
Daily Goods Sold Amount Daily Inventory Depletion Amount
4.1
Access Goods
Sold and
Inventory Data
4.2
Aggregate
Goods Sold
and Inventory
Data
4.3
Prepare
Management
Reports
Daily
Goods
Sold
Amount
Daily Inventory
Depletion Amount
Goods
Sold data
Inventory
Data
Aggregated
Data
Management
Reports
Level 3 Diagram
35
4.3
Prepare
Management
Reports
Aggregated
Data
Management
Reports
4.3.1
Format
Management
Reports
Aggregated
Data
4.3.2
Print
Management
Reports
Formatted
Data
Management
Reports
Do’s and Don’ts
36


Processes must have both Inputs and Outputs
No process can have only Inputs or only Outputs
Do’s and Don’ts
37

 All flows to Data store must move through a
Process

Do’s and Don’ts
38

 All flows to External Entity must move through
a Process

Shortcomings of DFD
 Can be Imprecise
 May not capture the entire functionality
 What happens if inputs are wrong; if book not found
 Control aspects not defined
 Order: inputs are consumed, output r produced: X
 Order: different processes are executed: X
 Decomposition: Subjective
 How to arrive at successive level; Up to how much level:
subjective; depends upon analyst
 Same problem  Multiple DFDs possible
 Decomposition: No specific guidance
39
To be continued…
40

More Related Content

Similar to SE2023 0202 DFD.pptx

Similar to SE2023 0202 DFD.pptx (20)

Dfd mechanics
Dfd mechanicsDfd mechanics
Dfd mechanics
 
Dfd mechanics
Dfd mechanicsDfd mechanics
Dfd mechanics
 
Using data flow diagrams
Using data flow diagramsUsing data flow diagrams
Using data flow diagrams
 
DFD.ppt
DFD.pptDFD.ppt
DFD.ppt
 
DFD_Context-_zero-level.ppt
DFD_Context-_zero-level.pptDFD_Context-_zero-level.ppt
DFD_Context-_zero-level.ppt
 
Dfd final
Dfd finalDfd final
Dfd final
 
dtata flow digram
dtata flow digramdtata flow digram
dtata flow digram
 
DFD
DFDDFD
DFD
 
208-dataflowdgm_5.ppt
208-dataflowdgm_5.ppt208-dataflowdgm_5.ppt
208-dataflowdgm_5.ppt
 
208-dataflowdgm.ppt
208-dataflowdgm.ppt208-dataflowdgm.ppt
208-dataflowdgm.ppt
 
data flow diagram power point presentation
data flow diagram power point presentationdata flow diagram power point presentation
data flow diagram power point presentation
 
DFD Slides
DFD SlidesDFD Slides
DFD Slides
 
Dfd 3
Dfd 3Dfd 3
Dfd 3
 
Chapter08 structuring system requirements
Chapter08 structuring system requirementsChapter08 structuring system requirements
Chapter08 structuring system requirements
 
Data Flow Diagram (Risath)
Data Flow Diagram (Risath)Data Flow Diagram (Risath)
Data Flow Diagram (Risath)
 
Data Flow Diagram
Data Flow DiagramData Flow Diagram
Data Flow Diagram
 
DFD1.ppt
DFD1.pptDFD1.ppt
DFD1.ppt
 
Dfd over flowcharts
Dfd over flowcharts Dfd over flowcharts
Dfd over flowcharts
 
ISAD 313-3_ MODELS.pptx
ISAD 313-3_ MODELS.pptxISAD 313-3_ MODELS.pptx
ISAD 313-3_ MODELS.pptx
 
Chapter 7software engneeringand system development life cycle.ppt
Chapter 7software engneeringand system development life cycle.pptChapter 7software engneeringand system development life cycle.ppt
Chapter 7software engneeringand system development life cycle.ppt
 

More from Bharat Chawda

SE2023 0102 SDLC Models.pdf
SE2023 0102 SDLC Models.pdfSE2023 0102 SDLC Models.pdf
SE2023 0102 SDLC Models.pdfBharat Chawda
 
SE2023 0401 Software Coding and Testing.pptx
SE2023 0401 Software Coding and Testing.pptxSE2023 0401 Software Coding and Testing.pptx
SE2023 0401 Software Coding and Testing.pptxBharat Chawda
 
SE2023 0301 Software Project Management.pptx
SE2023 0301 Software Project Management.pptxSE2023 0301 Software Project Management.pptx
SE2023 0301 Software Project Management.pptxBharat Chawda
 
SE2023 0207 Software Architectural Design.pptx
SE2023 0207 Software Architectural Design.pptxSE2023 0207 Software Architectural Design.pptx
SE2023 0207 Software Architectural Design.pptxBharat Chawda
 
SE2023 0206 Use Case Diagram.pptx
SE2023 0206 Use Case Diagram.pptxSE2023 0206 Use Case Diagram.pptx
SE2023 0206 Use Case Diagram.pptxBharat Chawda
 
SE2023 0205 Activity Diagram.pptx
SE2023 0205 Activity Diagram.pptxSE2023 0205 Activity Diagram.pptx
SE2023 0205 Activity Diagram.pptxBharat Chawda
 
SE2023 0204 Data Modeling.pptx
SE2023 0204 Data Modeling.pptxSE2023 0204 Data Modeling.pptx
SE2023 0204 Data Modeling.pptxBharat Chawda
 
SE2023 0203 Inventory System.pptx
SE2023 0203 Inventory System.pptxSE2023 0203 Inventory System.pptx
SE2023 0203 Inventory System.pptxBharat Chawda
 
SE2023 0201 Software Analysis and Design.pptx
SE2023 0201 Software Analysis and Design.pptxSE2023 0201 Software Analysis and Design.pptx
SE2023 0201 Software Analysis and Design.pptxBharat Chawda
 
SE2023 0101 Software Development Process.pptx
SE2023 0101 Software Development Process.pptxSE2023 0101 Software Development Process.pptx
SE2023 0101 Software Development Process.pptxBharat Chawda
 
Book Store Management System - Functional Requirements - 2021
Book Store Management System - Functional Requirements - 2021Book Store Management System - Functional Requirements - 2021
Book Store Management System - Functional Requirements - 2021Bharat Chawda
 
Book Store Management System - Database Design - 2021
Book Store Management System - Database Design - 2021Book Store Management System - Database Design - 2021
Book Store Management System - Database Design - 2021Bharat Chawda
 
ECHM - Ecology and environment
ECHM - Ecology and environmentECHM - Ecology and environment
ECHM - Ecology and environmentBharat Chawda
 

More from Bharat Chawda (13)

SE2023 0102 SDLC Models.pdf
SE2023 0102 SDLC Models.pdfSE2023 0102 SDLC Models.pdf
SE2023 0102 SDLC Models.pdf
 
SE2023 0401 Software Coding and Testing.pptx
SE2023 0401 Software Coding and Testing.pptxSE2023 0401 Software Coding and Testing.pptx
SE2023 0401 Software Coding and Testing.pptx
 
SE2023 0301 Software Project Management.pptx
SE2023 0301 Software Project Management.pptxSE2023 0301 Software Project Management.pptx
SE2023 0301 Software Project Management.pptx
 
SE2023 0207 Software Architectural Design.pptx
SE2023 0207 Software Architectural Design.pptxSE2023 0207 Software Architectural Design.pptx
SE2023 0207 Software Architectural Design.pptx
 
SE2023 0206 Use Case Diagram.pptx
SE2023 0206 Use Case Diagram.pptxSE2023 0206 Use Case Diagram.pptx
SE2023 0206 Use Case Diagram.pptx
 
SE2023 0205 Activity Diagram.pptx
SE2023 0205 Activity Diagram.pptxSE2023 0205 Activity Diagram.pptx
SE2023 0205 Activity Diagram.pptx
 
SE2023 0204 Data Modeling.pptx
SE2023 0204 Data Modeling.pptxSE2023 0204 Data Modeling.pptx
SE2023 0204 Data Modeling.pptx
 
SE2023 0203 Inventory System.pptx
SE2023 0203 Inventory System.pptxSE2023 0203 Inventory System.pptx
SE2023 0203 Inventory System.pptx
 
SE2023 0201 Software Analysis and Design.pptx
SE2023 0201 Software Analysis and Design.pptxSE2023 0201 Software Analysis and Design.pptx
SE2023 0201 Software Analysis and Design.pptx
 
SE2023 0101 Software Development Process.pptx
SE2023 0101 Software Development Process.pptxSE2023 0101 Software Development Process.pptx
SE2023 0101 Software Development Process.pptx
 
Book Store Management System - Functional Requirements - 2021
Book Store Management System - Functional Requirements - 2021Book Store Management System - Functional Requirements - 2021
Book Store Management System - Functional Requirements - 2021
 
Book Store Management System - Database Design - 2021
Book Store Management System - Database Design - 2021Book Store Management System - Database Design - 2021
Book Store Management System - Database Design - 2021
 
ECHM - Ecology and environment
ECHM - Ecology and environmentECHM - Ecology and environment
ECHM - Ecology and environment
 

Recently uploaded

Slack Application Development 101 Slides
Slack Application Development 101 SlidesSlack Application Development 101 Slides
Slack Application Development 101 Slidespraypatel2
 
Swan(sea) Song – personal research during my six years at Swansea ... and bey...
Swan(sea) Song – personal research during my six years at Swansea ... and bey...Swan(sea) Song – personal research during my six years at Swansea ... and bey...
Swan(sea) Song – personal research during my six years at Swansea ... and bey...Alan Dix
 
Presentation on how to chat with PDF using ChatGPT code interpreter
Presentation on how to chat with PDF using ChatGPT code interpreterPresentation on how to chat with PDF using ChatGPT code interpreter
Presentation on how to chat with PDF using ChatGPT code interpreternaman860154
 
My Hashitalk Indonesia April 2024 Presentation
My Hashitalk Indonesia April 2024 PresentationMy Hashitalk Indonesia April 2024 Presentation
My Hashitalk Indonesia April 2024 PresentationRidwan Fadjar
 
Key Features Of Token Development (1).pptx
Key  Features Of Token  Development (1).pptxKey  Features Of Token  Development (1).pptx
Key Features Of Token Development (1).pptxLBM Solutions
 
Hyderabad Call Girls Khairatabad ✨ 7001305949 ✨ Cheap Price Your Budget
Hyderabad Call Girls Khairatabad ✨ 7001305949 ✨ Cheap Price Your BudgetHyderabad Call Girls Khairatabad ✨ 7001305949 ✨ Cheap Price Your Budget
Hyderabad Call Girls Khairatabad ✨ 7001305949 ✨ Cheap Price Your BudgetEnjoy Anytime
 
AI as an Interface for Commercial Buildings
AI as an Interface for Commercial BuildingsAI as an Interface for Commercial Buildings
AI as an Interface for Commercial BuildingsMemoori
 
08448380779 Call Girls In Civil Lines Women Seeking Men
08448380779 Call Girls In Civil Lines Women Seeking Men08448380779 Call Girls In Civil Lines Women Seeking Men
08448380779 Call Girls In Civil Lines Women Seeking MenDelhi Call girls
 
Enhancing Worker Digital Experience: A Hands-on Workshop for Partners
Enhancing Worker Digital Experience: A Hands-on Workshop for PartnersEnhancing Worker Digital Experience: A Hands-on Workshop for Partners
Enhancing Worker Digital Experience: A Hands-on Workshop for PartnersThousandEyes
 
Transcript: #StandardsGoals for 2024: What’s new for BISAC - Tech Forum 2024
Transcript: #StandardsGoals for 2024: What’s new for BISAC - Tech Forum 2024Transcript: #StandardsGoals for 2024: What’s new for BISAC - Tech Forum 2024
Transcript: #StandardsGoals for 2024: What’s new for BISAC - Tech Forum 2024BookNet Canada
 
08448380779 Call Girls In Greater Kailash - I Women Seeking Men
08448380779 Call Girls In Greater Kailash - I Women Seeking Men08448380779 Call Girls In Greater Kailash - I Women Seeking Men
08448380779 Call Girls In Greater Kailash - I Women Seeking MenDelhi Call girls
 
GenCyber Cyber Security Day Presentation
GenCyber Cyber Security Day PresentationGenCyber Cyber Security Day Presentation
GenCyber Cyber Security Day PresentationMichael W. Hawkins
 
Advanced Test Driven-Development @ php[tek] 2024
Advanced Test Driven-Development @ php[tek] 2024Advanced Test Driven-Development @ php[tek] 2024
Advanced Test Driven-Development @ php[tek] 2024Scott Keck-Warren
 
Snow Chain-Integrated Tire for a Safe Drive on Winter Roads
Snow Chain-Integrated Tire for a Safe Drive on Winter RoadsSnow Chain-Integrated Tire for a Safe Drive on Winter Roads
Snow Chain-Integrated Tire for a Safe Drive on Winter RoadsHyundai Motor Group
 
Maximizing Board Effectiveness 2024 Webinar.pptx
Maximizing Board Effectiveness 2024 Webinar.pptxMaximizing Board Effectiveness 2024 Webinar.pptx
Maximizing Board Effectiveness 2024 Webinar.pptxOnBoard
 
Transforming Data Streams with Kafka Connect: An Introduction to Single Messa...
Transforming Data Streams with Kafka Connect: An Introduction to Single Messa...Transforming Data Streams with Kafka Connect: An Introduction to Single Messa...
Transforming Data Streams with Kafka Connect: An Introduction to Single Messa...HostedbyConfluent
 
Pigging Solutions Piggable Sweeping Elbows
Pigging Solutions Piggable Sweeping ElbowsPigging Solutions Piggable Sweeping Elbows
Pigging Solutions Piggable Sweeping ElbowsPigging Solutions
 
Kotlin Multiplatform & Compose Multiplatform - Starter kit for pragmatics
Kotlin Multiplatform & Compose Multiplatform - Starter kit for pragmaticsKotlin Multiplatform & Compose Multiplatform - Starter kit for pragmatics
Kotlin Multiplatform & Compose Multiplatform - Starter kit for pragmaticscarlostorres15106
 
The Codex of Business Writing Software for Real-World Solutions 2.pptx
The Codex of Business Writing Software for Real-World Solutions 2.pptxThe Codex of Business Writing Software for Real-World Solutions 2.pptx
The Codex of Business Writing Software for Real-World Solutions 2.pptxMalak Abu Hammad
 
Azure Monitor & Application Insight to monitor Infrastructure & Application
Azure Monitor & Application Insight to monitor Infrastructure & ApplicationAzure Monitor & Application Insight to monitor Infrastructure & Application
Azure Monitor & Application Insight to monitor Infrastructure & ApplicationAndikSusilo4
 

Recently uploaded (20)

Slack Application Development 101 Slides
Slack Application Development 101 SlidesSlack Application Development 101 Slides
Slack Application Development 101 Slides
 
Swan(sea) Song – personal research during my six years at Swansea ... and bey...
Swan(sea) Song – personal research during my six years at Swansea ... and bey...Swan(sea) Song – personal research during my six years at Swansea ... and bey...
Swan(sea) Song – personal research during my six years at Swansea ... and bey...
 
Presentation on how to chat with PDF using ChatGPT code interpreter
Presentation on how to chat with PDF using ChatGPT code interpreterPresentation on how to chat with PDF using ChatGPT code interpreter
Presentation on how to chat with PDF using ChatGPT code interpreter
 
My Hashitalk Indonesia April 2024 Presentation
My Hashitalk Indonesia April 2024 PresentationMy Hashitalk Indonesia April 2024 Presentation
My Hashitalk Indonesia April 2024 Presentation
 
Key Features Of Token Development (1).pptx
Key  Features Of Token  Development (1).pptxKey  Features Of Token  Development (1).pptx
Key Features Of Token Development (1).pptx
 
Hyderabad Call Girls Khairatabad ✨ 7001305949 ✨ Cheap Price Your Budget
Hyderabad Call Girls Khairatabad ✨ 7001305949 ✨ Cheap Price Your BudgetHyderabad Call Girls Khairatabad ✨ 7001305949 ✨ Cheap Price Your Budget
Hyderabad Call Girls Khairatabad ✨ 7001305949 ✨ Cheap Price Your Budget
 
AI as an Interface for Commercial Buildings
AI as an Interface for Commercial BuildingsAI as an Interface for Commercial Buildings
AI as an Interface for Commercial Buildings
 
08448380779 Call Girls In Civil Lines Women Seeking Men
08448380779 Call Girls In Civil Lines Women Seeking Men08448380779 Call Girls In Civil Lines Women Seeking Men
08448380779 Call Girls In Civil Lines Women Seeking Men
 
Enhancing Worker Digital Experience: A Hands-on Workshop for Partners
Enhancing Worker Digital Experience: A Hands-on Workshop for PartnersEnhancing Worker Digital Experience: A Hands-on Workshop for Partners
Enhancing Worker Digital Experience: A Hands-on Workshop for Partners
 
Transcript: #StandardsGoals for 2024: What’s new for BISAC - Tech Forum 2024
Transcript: #StandardsGoals for 2024: What’s new for BISAC - Tech Forum 2024Transcript: #StandardsGoals for 2024: What’s new for BISAC - Tech Forum 2024
Transcript: #StandardsGoals for 2024: What’s new for BISAC - Tech Forum 2024
 
08448380779 Call Girls In Greater Kailash - I Women Seeking Men
08448380779 Call Girls In Greater Kailash - I Women Seeking Men08448380779 Call Girls In Greater Kailash - I Women Seeking Men
08448380779 Call Girls In Greater Kailash - I Women Seeking Men
 
GenCyber Cyber Security Day Presentation
GenCyber Cyber Security Day PresentationGenCyber Cyber Security Day Presentation
GenCyber Cyber Security Day Presentation
 
Advanced Test Driven-Development @ php[tek] 2024
Advanced Test Driven-Development @ php[tek] 2024Advanced Test Driven-Development @ php[tek] 2024
Advanced Test Driven-Development @ php[tek] 2024
 
Snow Chain-Integrated Tire for a Safe Drive on Winter Roads
Snow Chain-Integrated Tire for a Safe Drive on Winter RoadsSnow Chain-Integrated Tire for a Safe Drive on Winter Roads
Snow Chain-Integrated Tire for a Safe Drive on Winter Roads
 
Maximizing Board Effectiveness 2024 Webinar.pptx
Maximizing Board Effectiveness 2024 Webinar.pptxMaximizing Board Effectiveness 2024 Webinar.pptx
Maximizing Board Effectiveness 2024 Webinar.pptx
 
Transforming Data Streams with Kafka Connect: An Introduction to Single Messa...
Transforming Data Streams with Kafka Connect: An Introduction to Single Messa...Transforming Data Streams with Kafka Connect: An Introduction to Single Messa...
Transforming Data Streams with Kafka Connect: An Introduction to Single Messa...
 
Pigging Solutions Piggable Sweeping Elbows
Pigging Solutions Piggable Sweeping ElbowsPigging Solutions Piggable Sweeping Elbows
Pigging Solutions Piggable Sweeping Elbows
 
Kotlin Multiplatform & Compose Multiplatform - Starter kit for pragmatics
Kotlin Multiplatform & Compose Multiplatform - Starter kit for pragmaticsKotlin Multiplatform & Compose Multiplatform - Starter kit for pragmatics
Kotlin Multiplatform & Compose Multiplatform - Starter kit for pragmatics
 
The Codex of Business Writing Software for Real-World Solutions 2.pptx
The Codex of Business Writing Software for Real-World Solutions 2.pptxThe Codex of Business Writing Software for Real-World Solutions 2.pptx
The Codex of Business Writing Software for Real-World Solutions 2.pptx
 
Azure Monitor & Application Insight to monitor Infrastructure & Application
Azure Monitor & Application Insight to monitor Infrastructure & ApplicationAzure Monitor & Application Insight to monitor Infrastructure & Application
Azure Monitor & Application Insight to monitor Infrastructure & Application
 

SE2023 0202 DFD.pptx

  • 1. DFD: Data Flow Diagram by: Dr. Bharat V. Chawda Computer Engineering Department, BBIT, VVNagar, Gujarat, India 1
  • 2. Overview  A Concept  Primitive Symbols  Context Diagram  Level 1 Diagram  Decomposition  Example  Do’s and Don’ts  Shortcomings 2
  • 3. A Concept: Simple Example  RMS: Root Mean Square 3 RMS Calculator 0 User I/P Data rms Validate input 1 Compute RMS 2 Valid Data Display result 3 rms rms Further Decomposition… I/P Data
  • 4. Concept  “A graphical representation of the flow of data through an information system, modelling its process aspects.”  “A hierarchical graphical model of a system that shows –  The different processing activities / functions that the system performs, and  The data interchange among those functions.”  Also known as the Bubble Chart 4
  • 5. Concept  Shows:  What data is Input; Who generates it: Source  What data is O/P; Who receives it: Destination/Sink  What processing is performed on data; by whom: Proc  Where data come from and go to: Data Flow  What data is stored; where: Data Store  Does not show:  Timing of processes: Executed in parallel or sequence  Conditions: based on which functions may or may not get executed  Control flow / Algorithmic details  That’s why: Different from Flowchart 5
  • 6. Concept  Why Popular?  Easy to understand by technical and non-technical persons  Can provide high level system overview; with boundaries and connections to other systems  Can provide a detailed representation of system components  Uses limited number of primitive symbols (only four)  Provides hierarchy of DFDs – Reduces complexity using abstraction at each level  Top level: Most abstract: Context Diagram / Level 0 Diagram  Next level: Level 1 Diagram  Further levels: Level 2, 3, 4… 6
  • 7. Primitive Symbols for DFD  Process / Function: Circle, Rounded Rectangle  Actions performed on data: Transformed, Stored, or Distributed  Annotated with number and name of function  Name starts with verb (Except context level diagram)  Data Flow: Directed arc, Arrow  Single piece of data or logical collection of data  Annotated with name/description of data 7
  • 8. Primitive Symbols for DFD  External Entity: Rectangle  Source and/or Sink  Origin and/or Destination of the data  External, cos outside the system  Annotated with name (Noun)  Data Store: Open rectangle, parallel lines  Data structure, File, Table, Database  Annotated with corresponding names of data items 8
  • 9. Context or Level 0 Diagram  Concept: Most abstract representation of the system Highest level or simplest representation of system Entire system as single bubble – annotated with software name (noun is used for naming bubble) Represents the context in which system would exist – external entities, data input to the system, data output from the system 9
  • 10. Context or Level 0 Diagram  Main steps: Identify where data is captured from: Source Identify where data is distributed to: Destination Describe the overall process Map these out in a diagram using the correct symbols Link them with data flows that are labelled 10
  • 11. Level 1 Diagram  Concept: Represents high level functions of the system – derived based on functional requirements from SRS 3 to 7 bubbles – each representing single high level function Input data to these functions Output data from these functions External entities can be avoided Data store can be introduced at this level or at next levels 11
  • 12. Level 1 Diagram  Main steps:  Identify and draw the processes that make up the Level 0 process: High level functions  Allocate descriptions to these processes  Lay out the sources/sinks and data flows from the Level 0 diagram  Draw in any data stores used in the process  Link the new processes and data stores with named data links: Data flows 12
  • 13. Decomposition  Concept: Also knows as factoring or exploding a bubble Bubbles are decomposed into sub-functions at the successive levels of the DFD model Decomposition into 3 to 7 bubbles Too few: superfluous, redundant, trivial Too many: makes DFD model hard to understand How far: until function can be described using simple algorithm or instructions 13
  • 14. Decomposition  Numbering: Numbering: Context Level DFD: 0 Level 1 DFD: 1,2,3… Level 2 DFD: 1.1, 1.2,…, 2.1,2.2,…  Balancing: The data that flow into or out of a bubble must match the data flow at the next level of DFD. 14
  • 15. Decomposition/Level ‘n’ Diagram  Main steps:  Identify and draw the processes that make up the Level n-1 process  Allocate descriptions to these processes  Lay out all the data flows from the Level n-1 diagram  Draw in any data stores used in the process  Link the new processes and data stores with named data links: Data flows 15
  • 16. Ex: Food Order System  Description  Customer provides order.  System produces receipt by referring order and gives to customer.  Order is also sent to kitchen department.  Based on order, “Goods sold” and “Inventory” files are updated.  Reports for the top management regarding sales, inventory depletion (income, expenditure) are generated. 16
  • 17. Context or Level 0 Diagram  Main steps: Identify where data is captured from Identify where data is distributed to Describe the overall process Map these out in a diagram using the correct symbols Link them with data flows that are labelled 17
  • 18. Context or Level 0 Diagram 18 CUSTOMER
  • 19. Context or Level 0 Diagram  Main steps: Identify where data is captured from Identify where data is distributed to Describe the overall process Map these out in a diagram using the correct symbols Link them with data flows that are labelled 19
  • 20. Context or Level 0 Diagram 20 CUSTOMER KITCHEN RESTAURANT MANAGER
  • 21. Context or Level 0 Diagram  Main steps: Identify where data is captured from Identify where data is distributed to Describe the overall process Map these out in a diagram using the correct symbols Link them with data flows that are labelled 21
  • 22. Context or Level 0 Diagram 22 Food Ordering System 0 CUSTOMER KITCHEN RESTAURANT MANAGER
  • 23. Context or Level 0 Diagram  Main steps: Identify where data is captured from Identify where data is distributed to Describe the overall process Map these out in a diagram using the correct symbols Link them with data flows that are labelled 23
  • 25. Level 1 Diagram  Main steps:  Identify and draw the processes that make up the Level 0 process  Allocate descriptions to these processes  Lay out the sources/sinks and data flows from the Level 0 diagram  Draw in any data stores used in the process  Link the new processes and data stores with named data links 25
  • 26. Level 1 Diagram 26 1.0 Receive and transform Customer Food Order 3.0 Update Inventory file 2.0 Update Goods Sold file 4.0 Produce Management Reports
  • 27. Level 1 Diagram  Main steps:  Identify and draw the processes that make up the Level 0 process  Allocate descriptions to these processes  Lay out the sources/sinks and data flows from the Level 0 diagram  Draw in any data stores used in the process  Link the new processes and data stores with named data links 27
  • 28. Level 1 Diagram 28 1.0 Receive and transform Customer Food Order 3.0 Update Inventory file 2.0 Update Goods Sold file 4.0 Produce Management Reports Receipt Customer Order CUSTOMER KITCHEN Food Order RESTAURANT MANAGER Management Reports
  • 29. Level 1 Diagram  Main steps:  Identify and draw the processes that make up the Level 0 process  Allocate descriptions to these processes  Lay out the sources/sinks and data flows from the Level 0 diagram  Draw in any data stores used in the process  Link the new processes and data stores with named data links 29
  • 30. Level 1 Diagram 30 1.0 Receive and transform Customer Food Order 3.0 Update Inventory file 2.0 Update Goods Sold file 4.0 Produce Management Reports Receipt Customer Order CUSTOMER KITCHEN Food Order RESTAURANT MANAGER Management Reports D1 Goods Sold File D2 Inventory File
  • 31. Level 1 Diagram  Main steps:  Identify and draw the processes that make up the Level 0 process  Allocate descriptions to these processes  Lay out the sources/sinks and data flows from the Level 0 diagram  Draw in any data stores used in the process  Link the new processes and data stores with named data links 31
  • 32. Level 1 Diagram 32 1.0 Receive and transform Customer Food Order 3.0 Update Inventory file 2.0 Update Goods Sold file 4.0 Produce Management Reports Receipt Customer Order CUSTOMER KITCHEN Food Order RESTAURANT MANAGER Management Reports Goods Sold Inventory Data Goods Sold Data Inventory Data Daily Goods Sold Amount Daily Inventory Depletion Amount D1 Goods Sold File D2 Inventory File
  • 33. Level ‘n’ Diagram  Main steps:  Identify and draw the processes that make up the Level n-1 process  Allocate descriptions to these processes  Lay out the sources/sinks and data flows from the Level n-1 diagram  Draw in any data stores used in the process  Link the new processes and data stores with named data links 33
  • 34. Level 2 Diagram 34 4.0 Produce Management Reports Management Reports Daily Goods Sold Amount Daily Inventory Depletion Amount 4.1 Access Goods Sold and Inventory Data 4.2 Aggregate Goods Sold and Inventory Data 4.3 Prepare Management Reports Daily Goods Sold Amount Daily Inventory Depletion Amount Goods Sold data Inventory Data Aggregated Data Management Reports
  • 36. Do’s and Don’ts 36   Processes must have both Inputs and Outputs No process can have only Inputs or only Outputs
  • 37. Do’s and Don’ts 37   All flows to Data store must move through a Process 
  • 38. Do’s and Don’ts 38   All flows to External Entity must move through a Process 
  • 39. Shortcomings of DFD  Can be Imprecise  May not capture the entire functionality  What happens if inputs are wrong; if book not found  Control aspects not defined  Order: inputs are consumed, output r produced: X  Order: different processes are executed: X  Decomposition: Subjective  How to arrive at successive level; Up to how much level: subjective; depends upon analyst  Same problem  Multiple DFDs possible  Decomposition: No specific guidance 39