Download to read offline

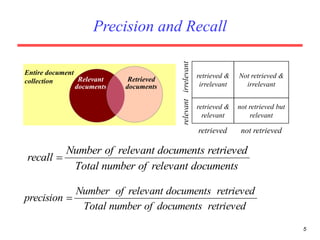
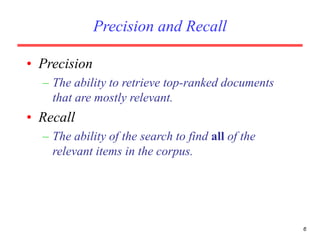
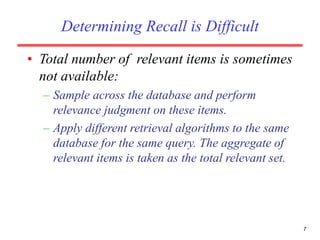
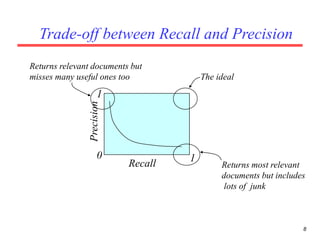
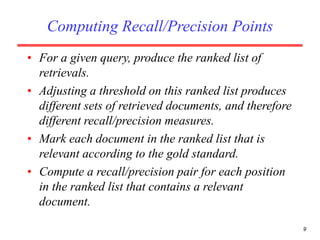
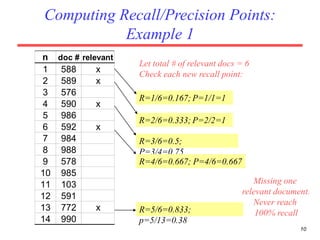
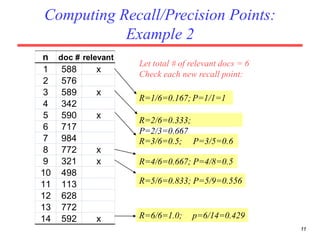
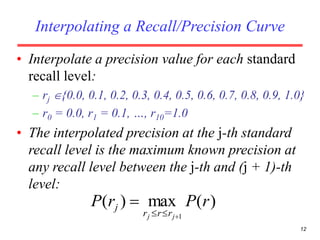
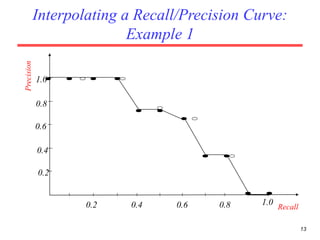
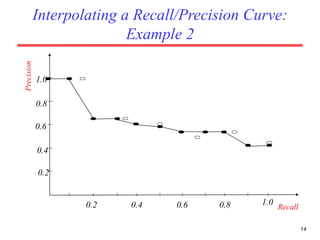
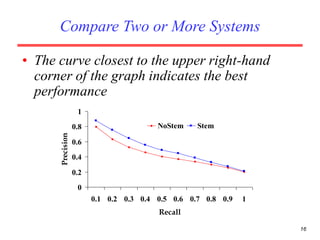
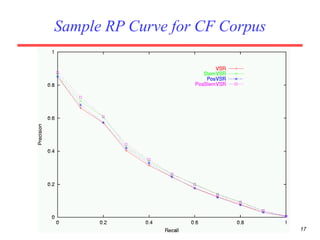
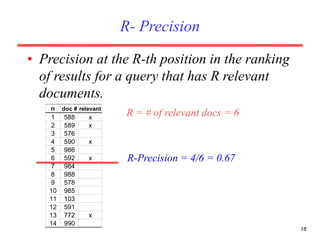
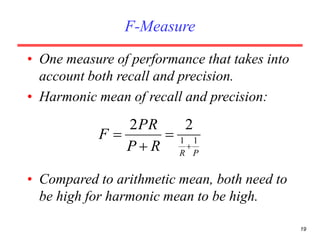
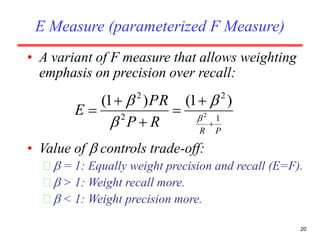
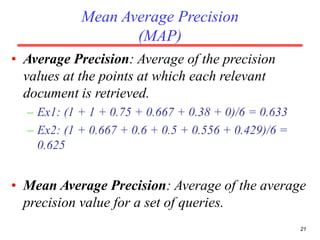
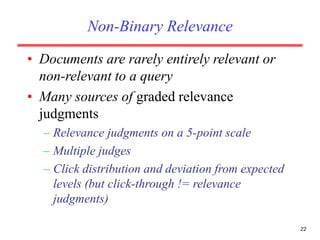
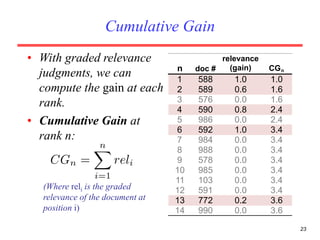
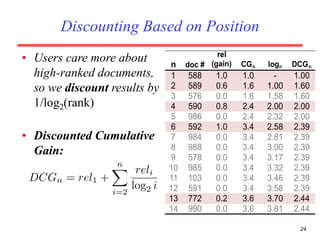
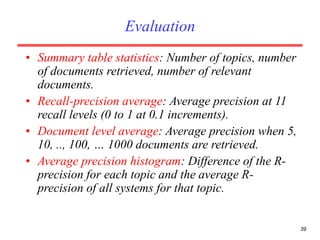
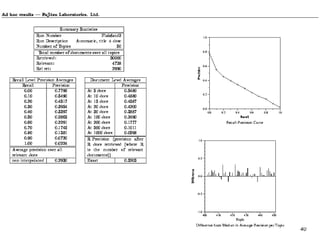


There are several challenges in evaluating information retrieval systems, including the subjectivity and dynamic nature of relevancy judgments. Common evaluation metrics include precision, recall, F-measure, mean average precision, discounted cumulative gain, and normalized discounted cumulative gain. These metrics are calculated using test collections consisting of queries, relevant documents, and system rankings to measure how closely systems can match human relevance assessments at different levels of a ranked list.