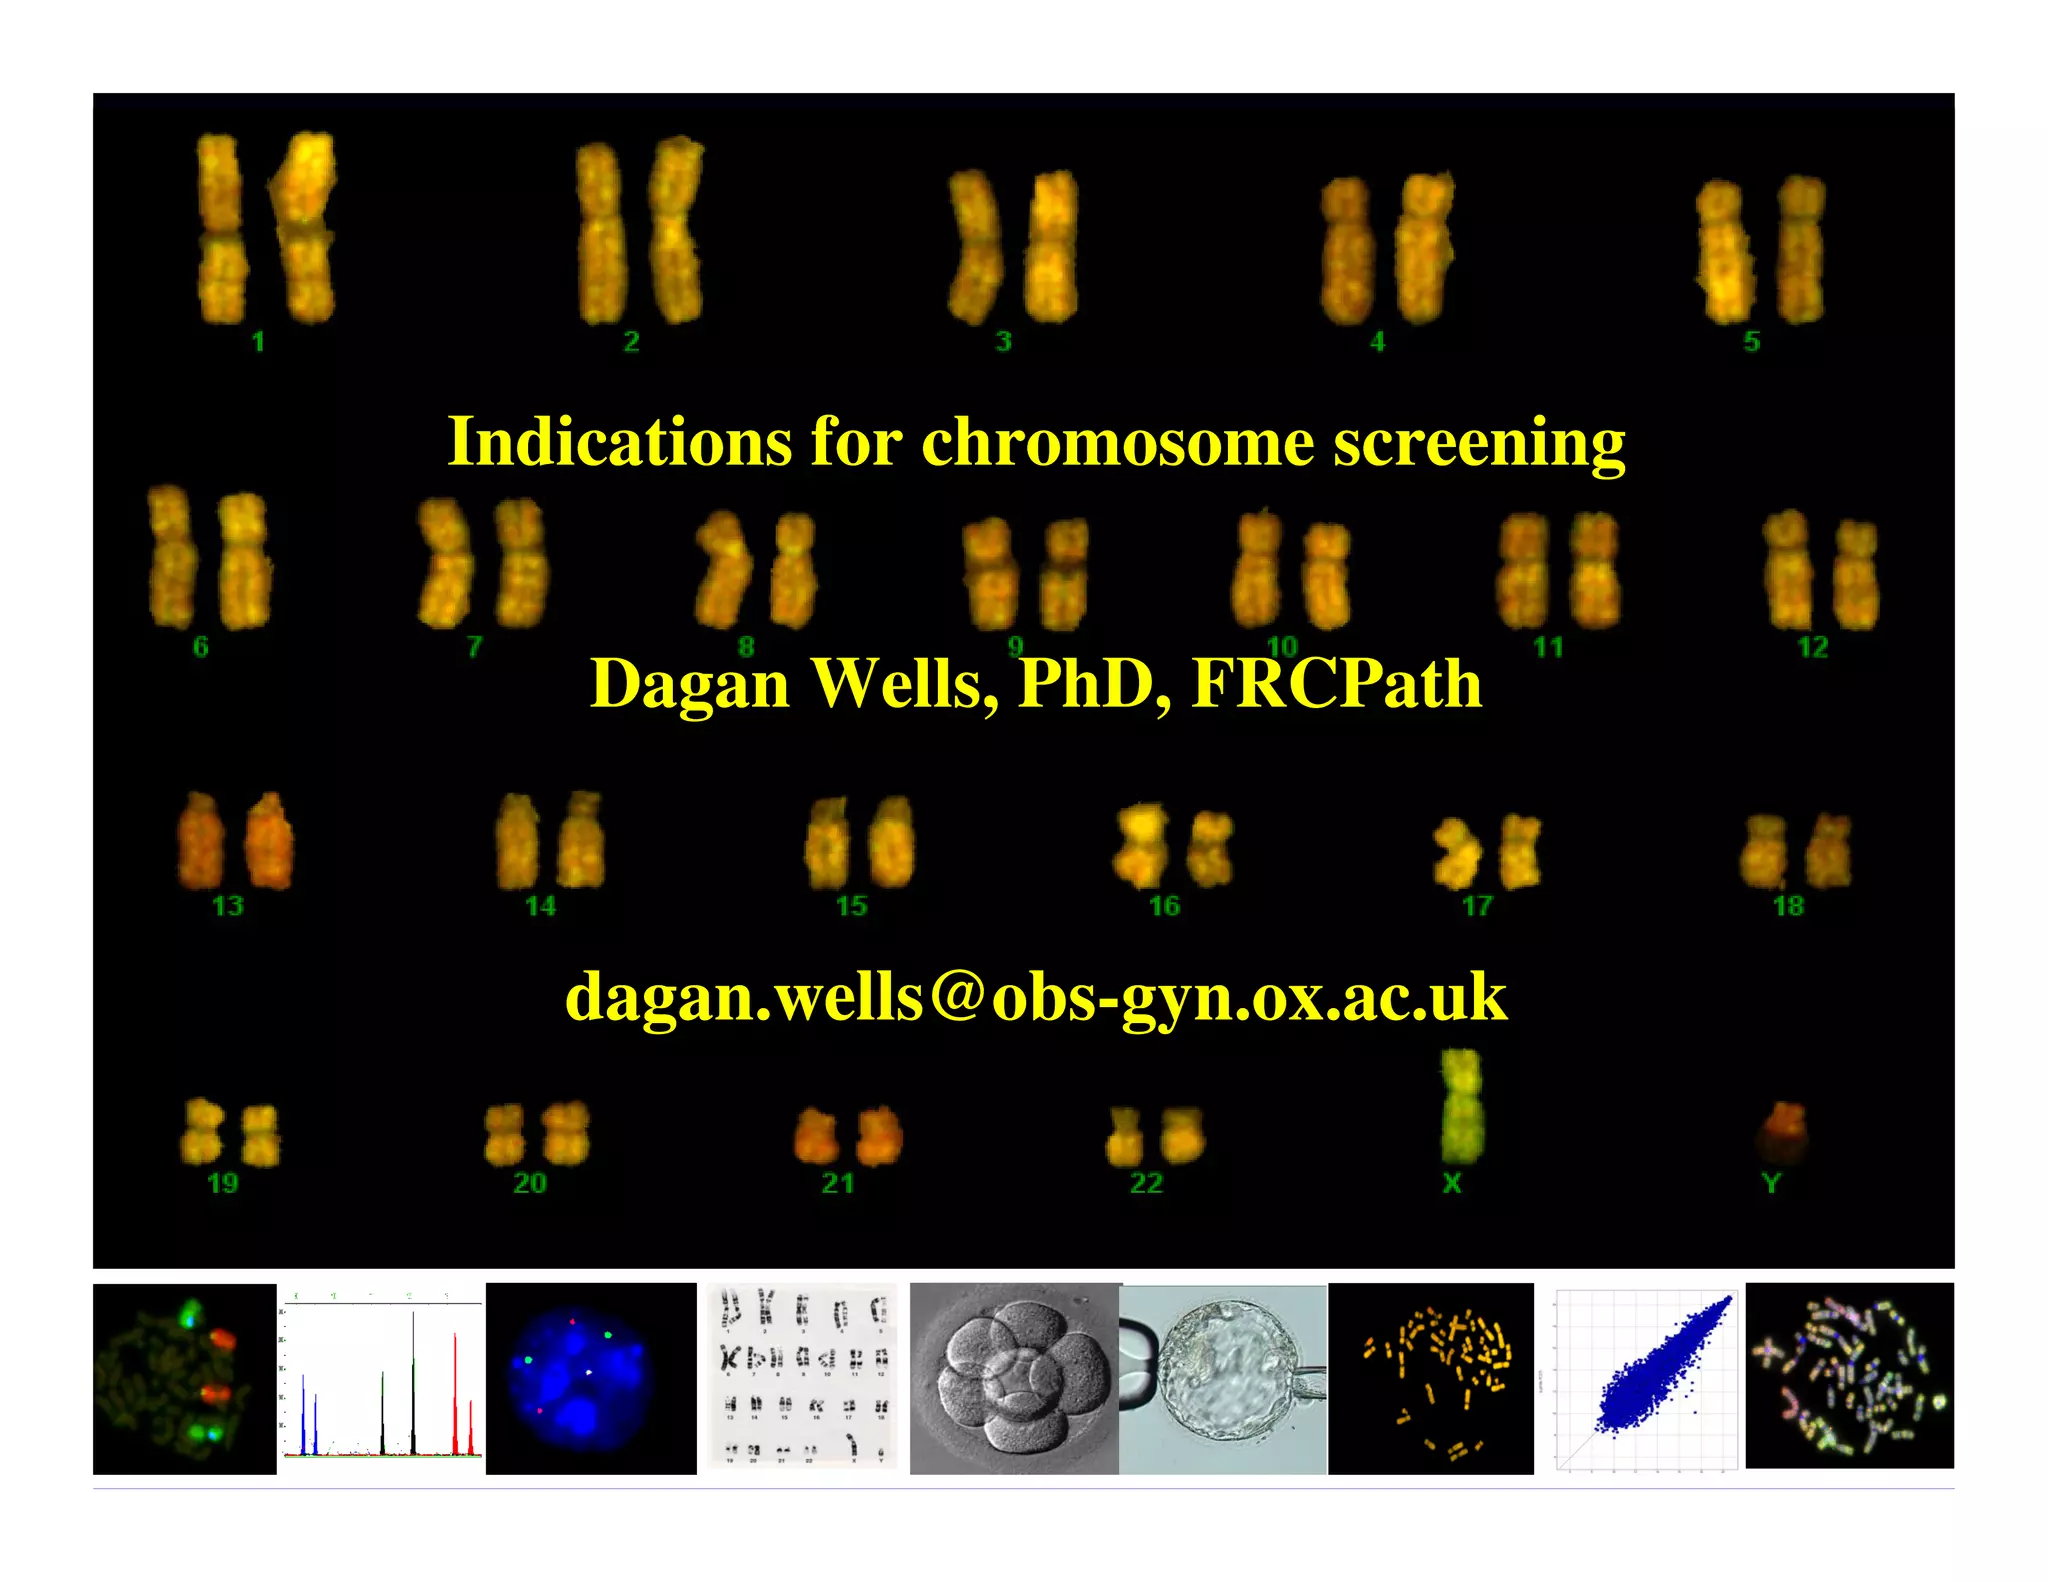
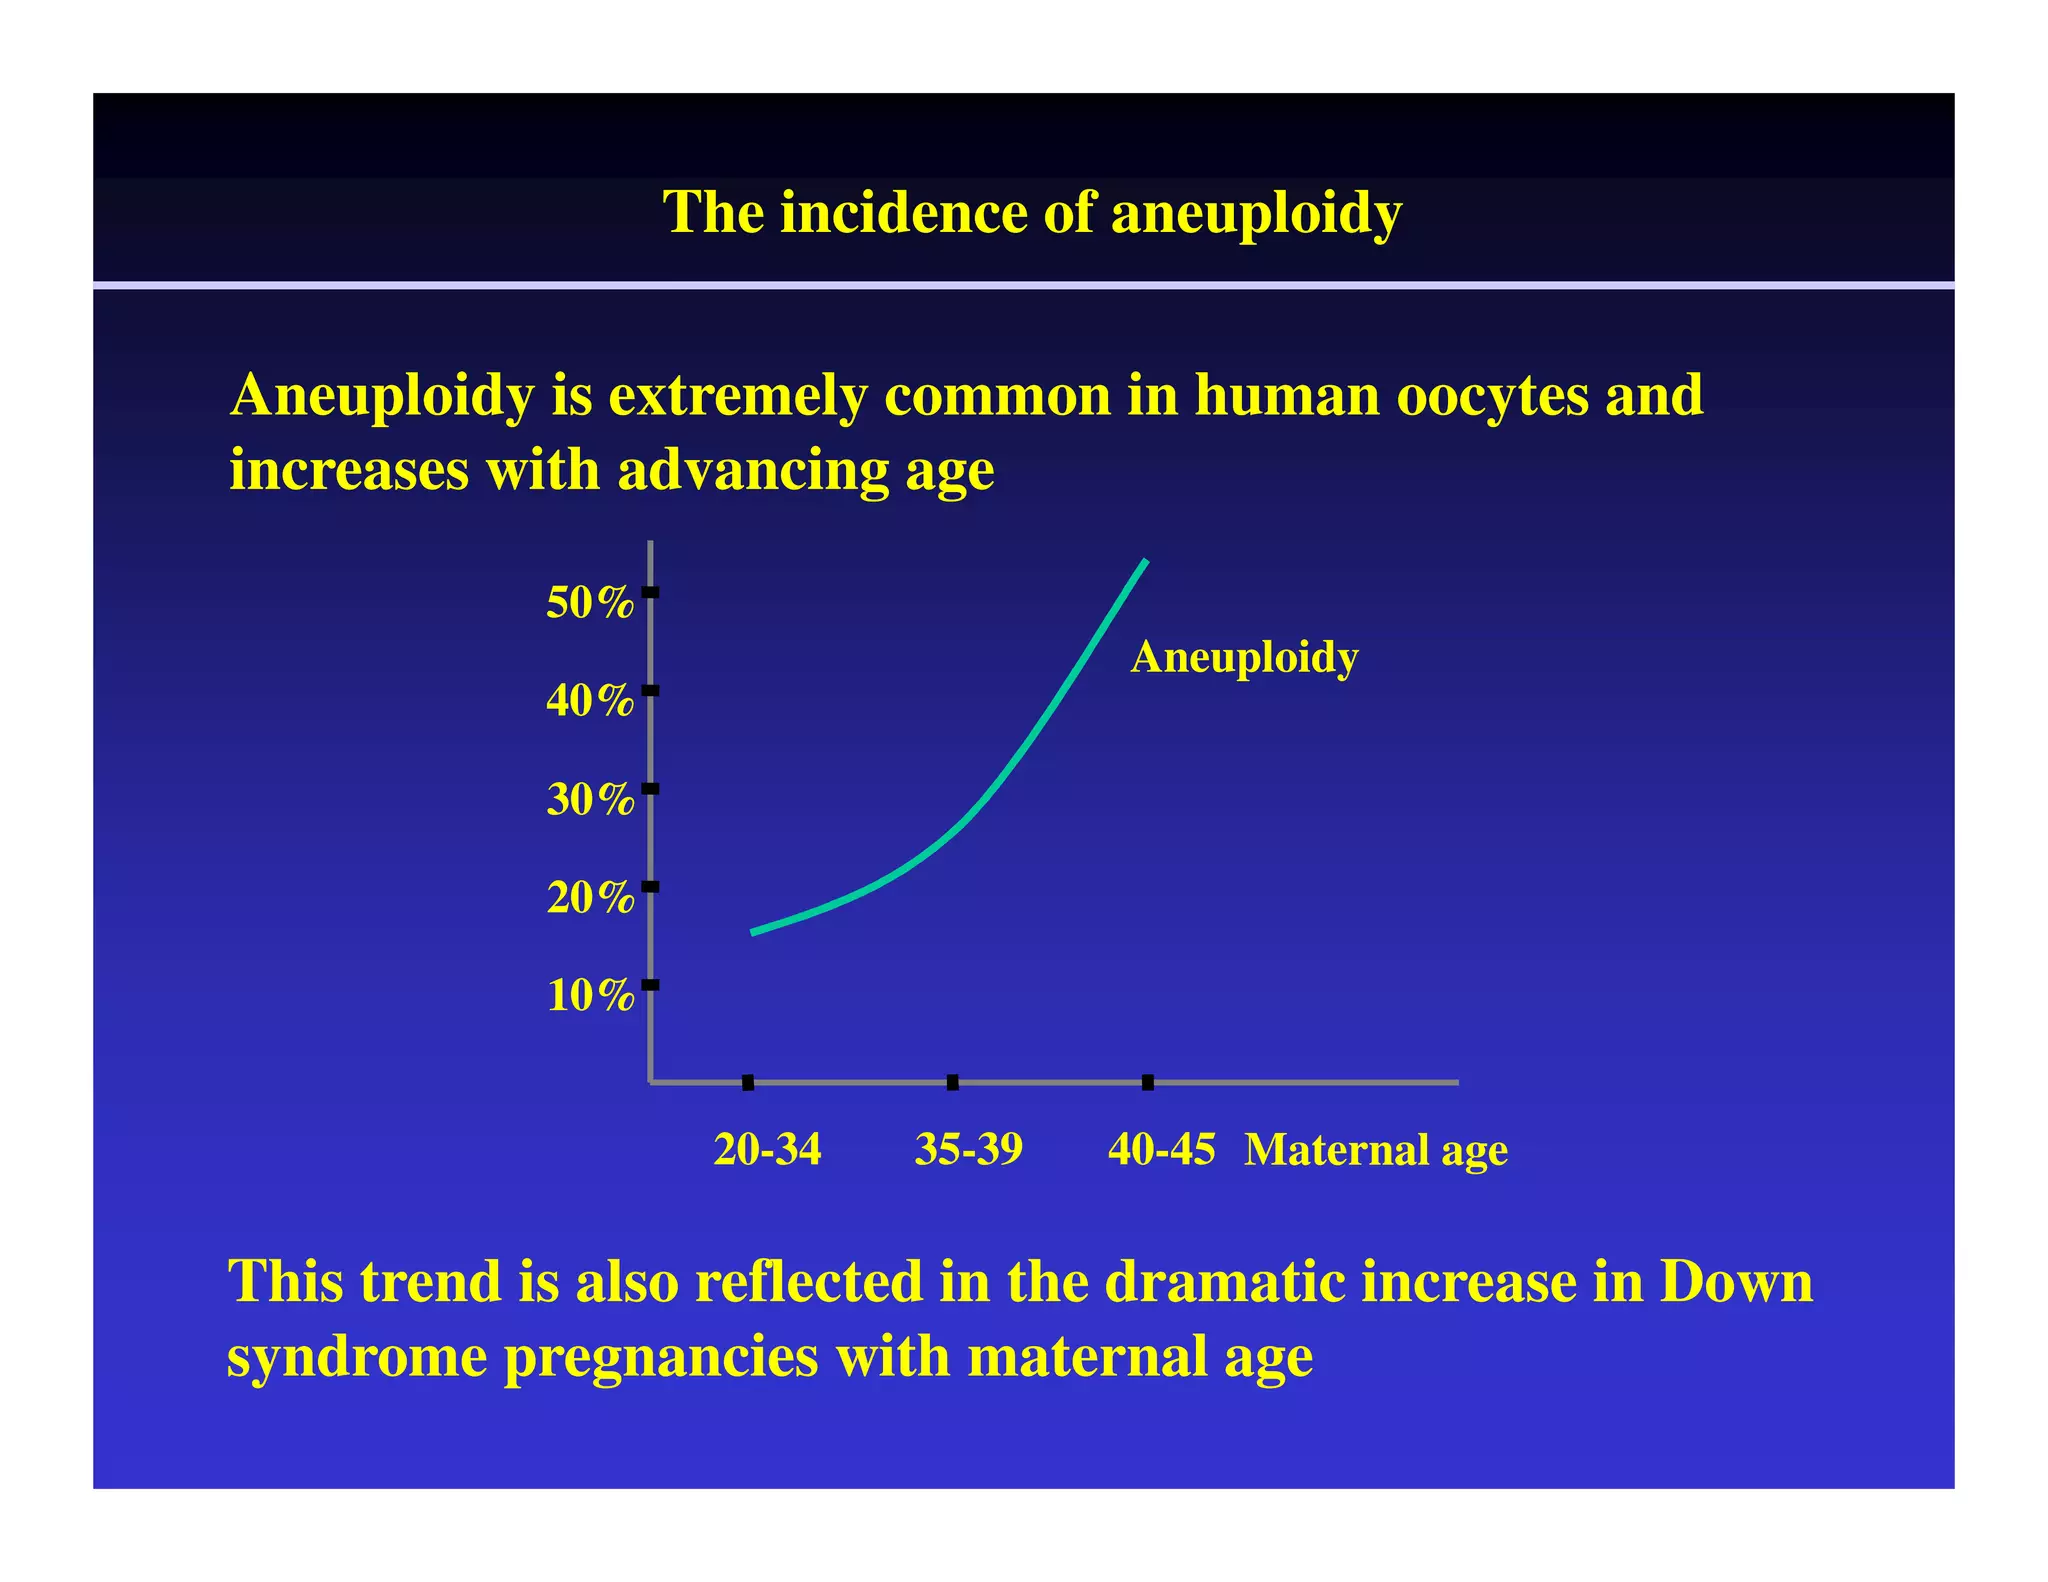
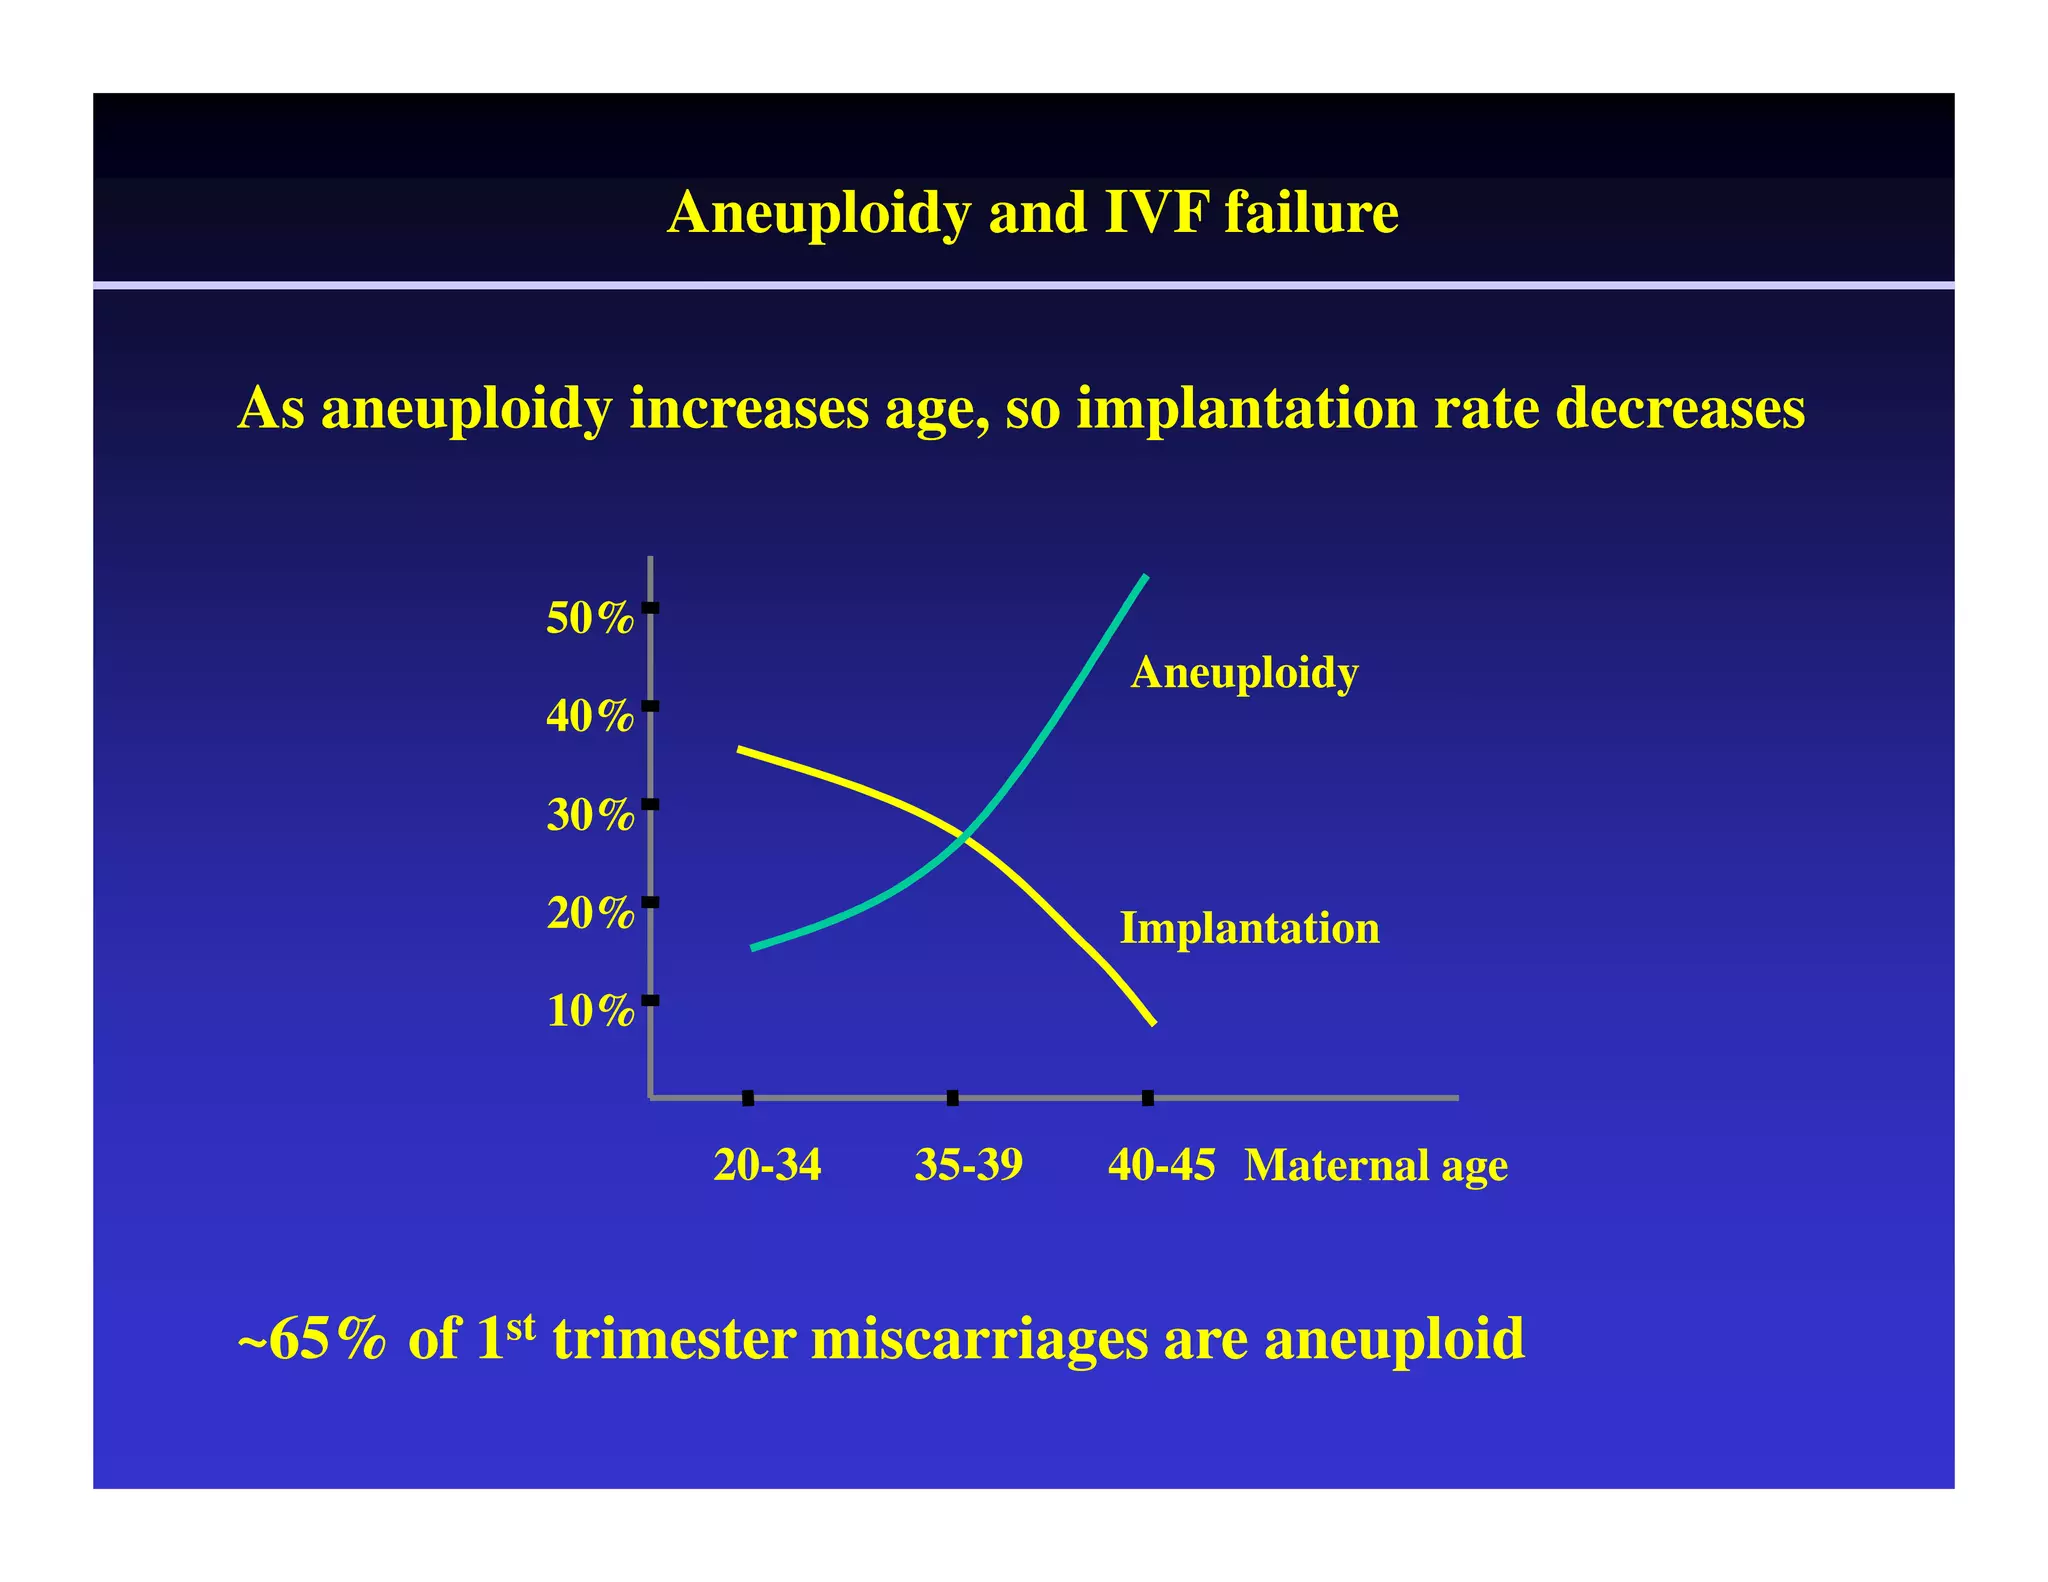
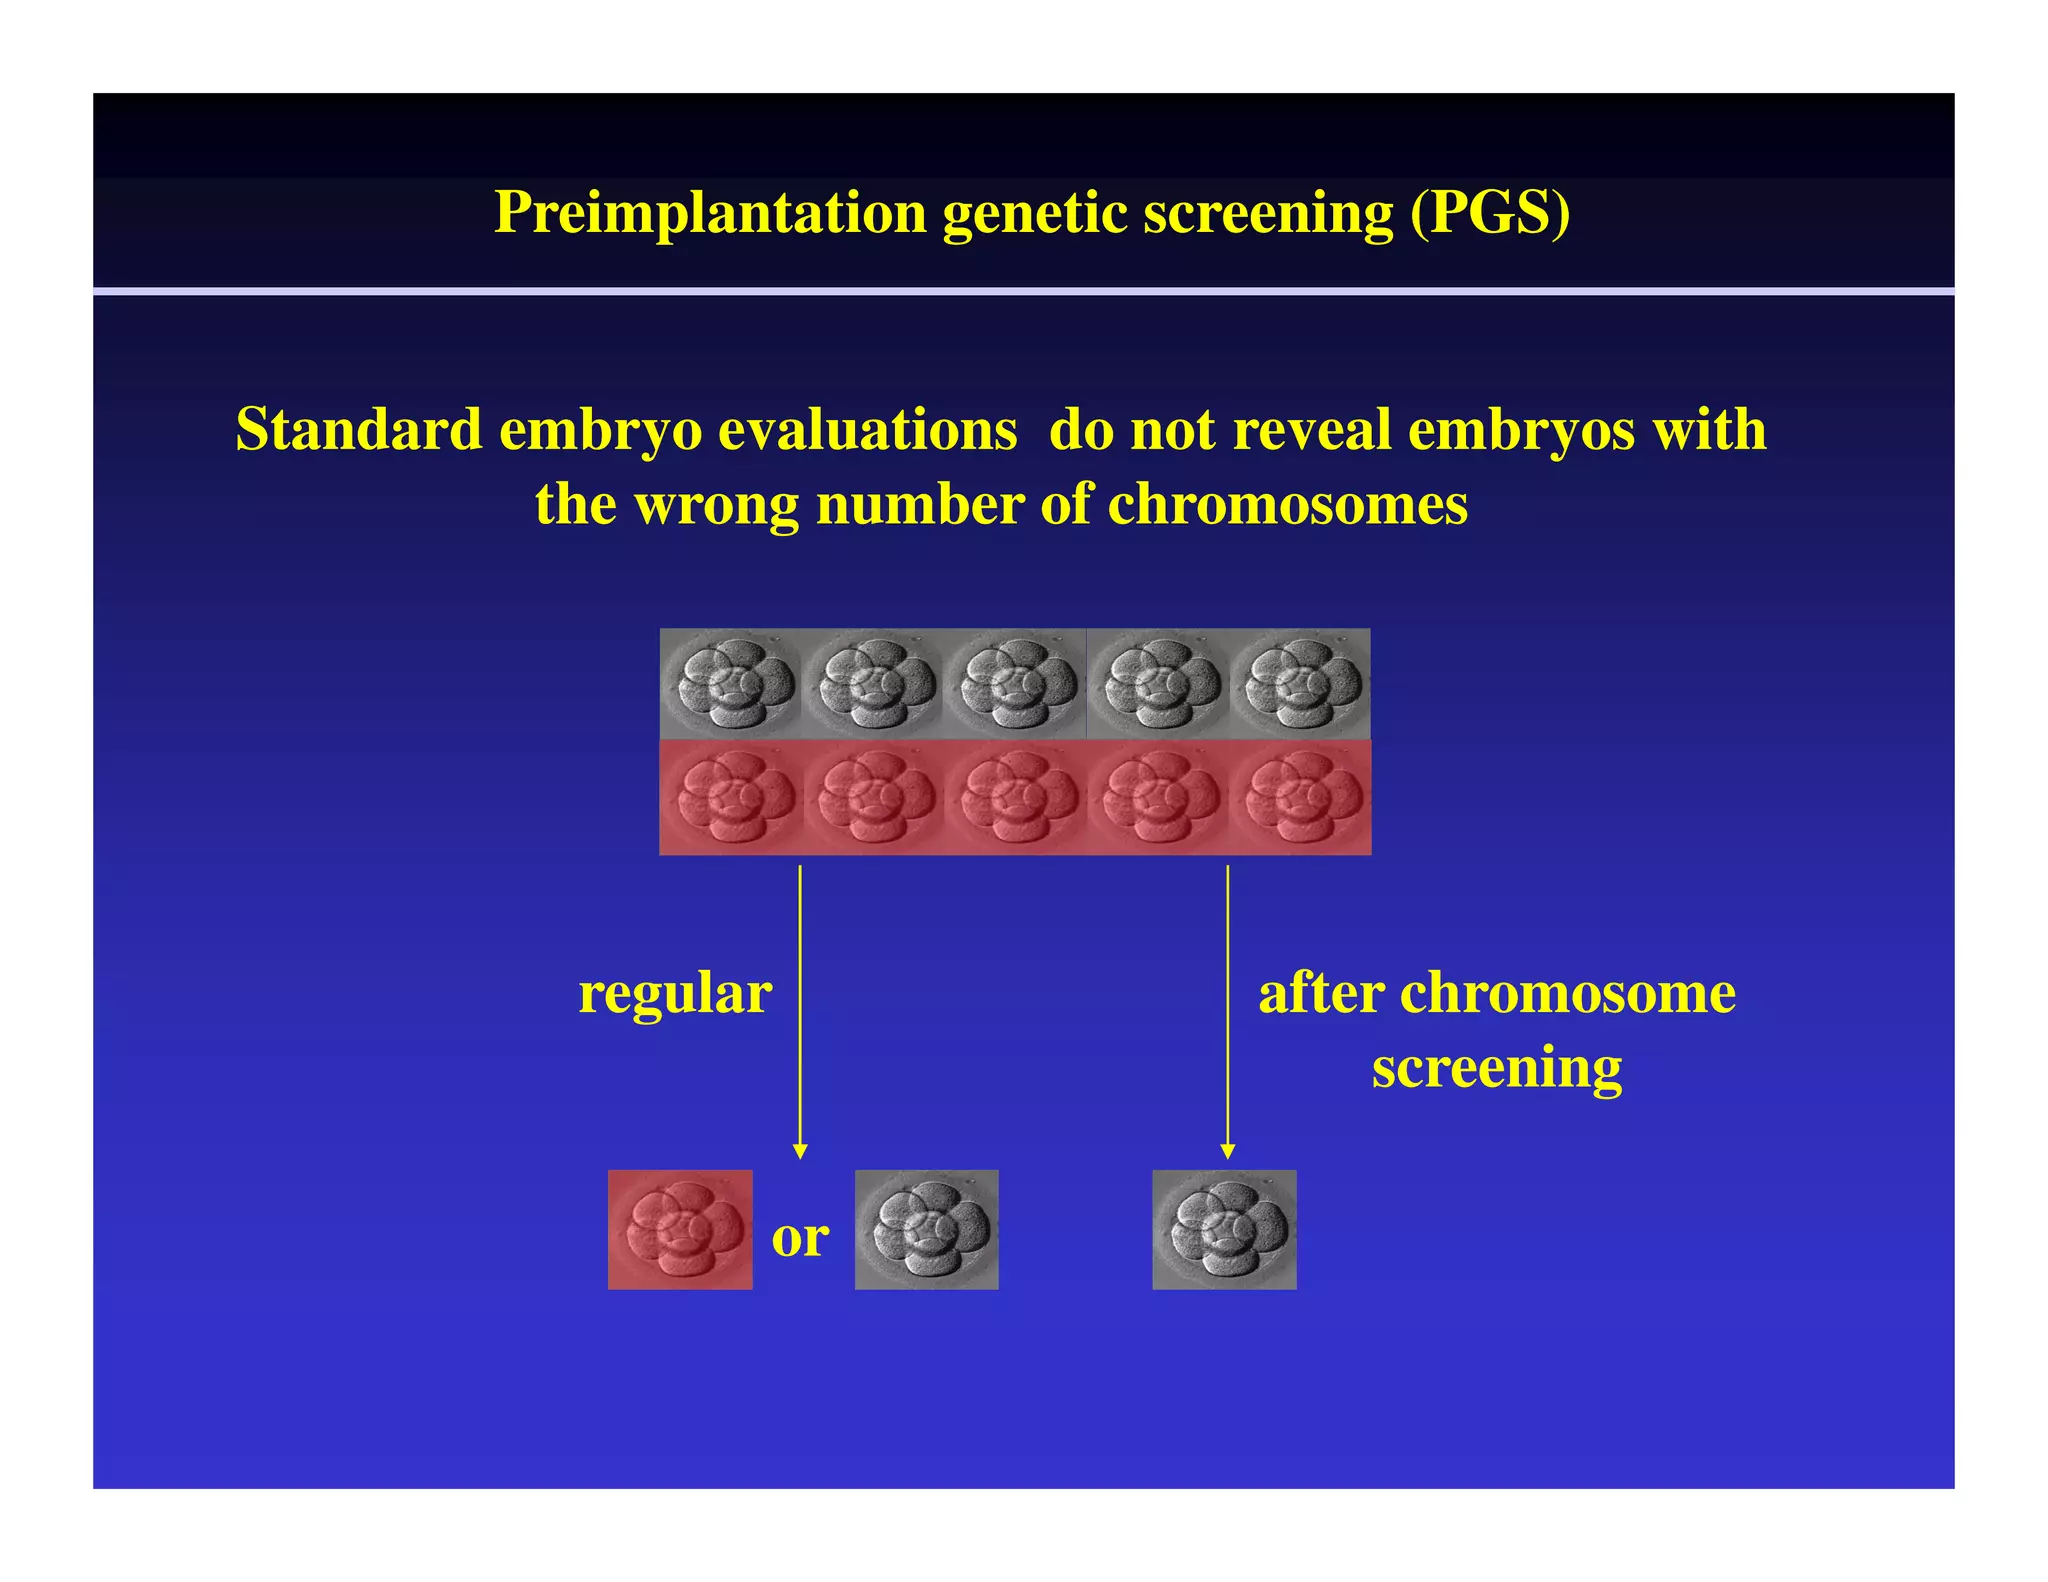
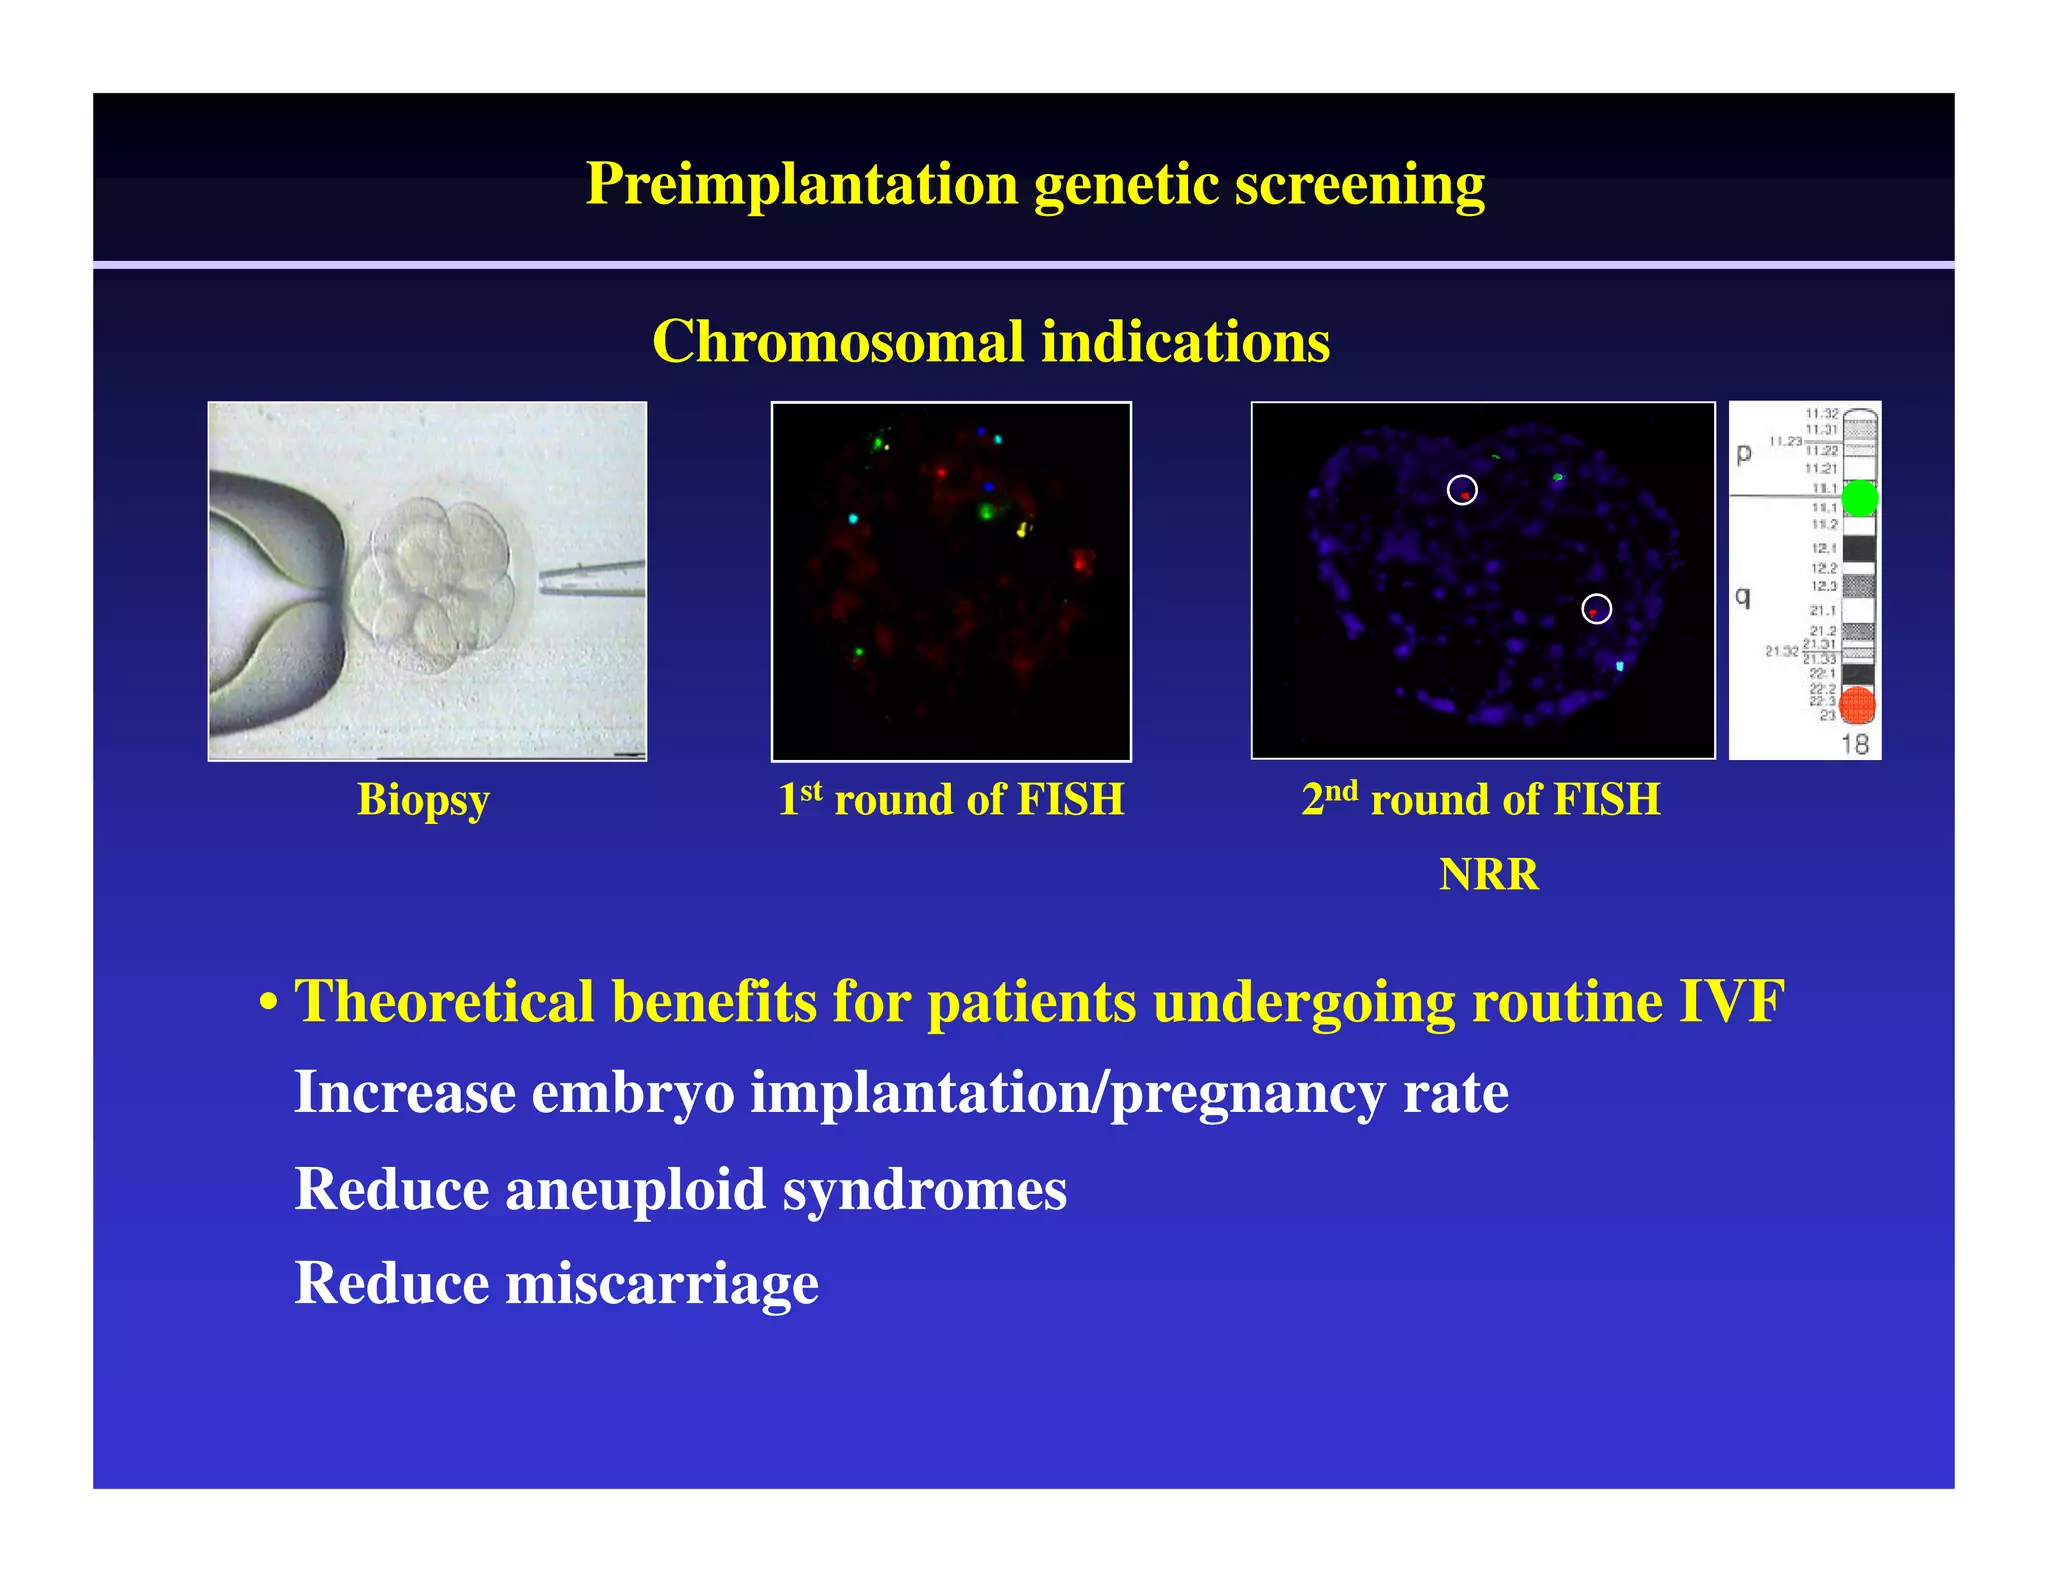
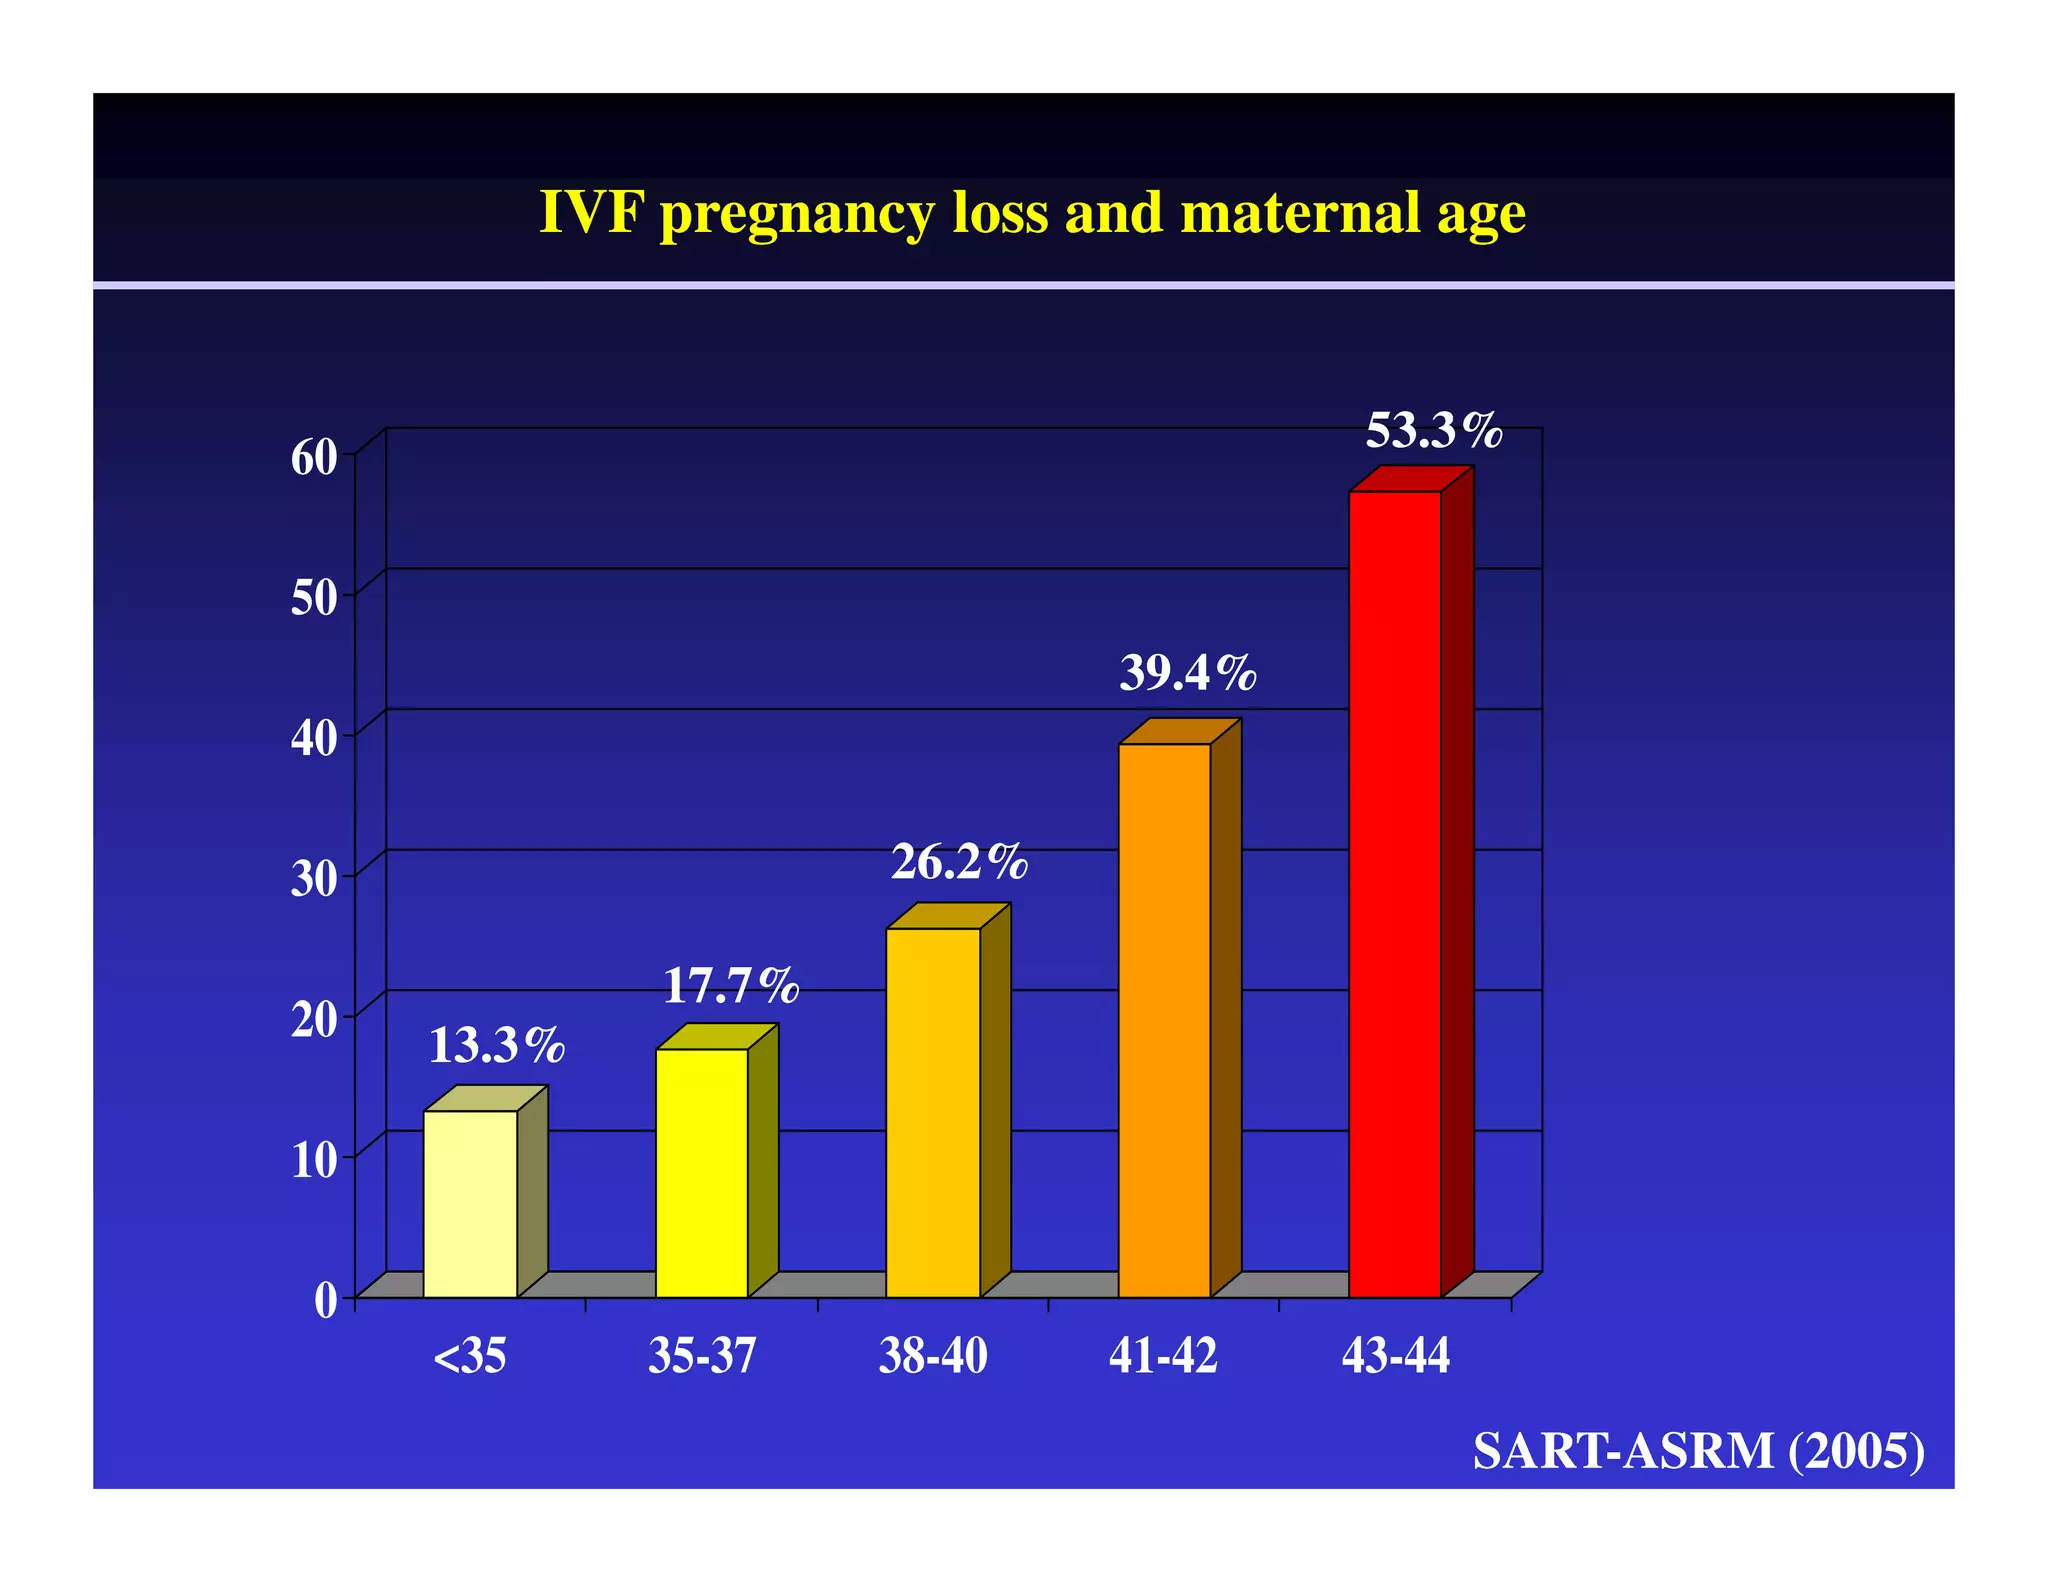
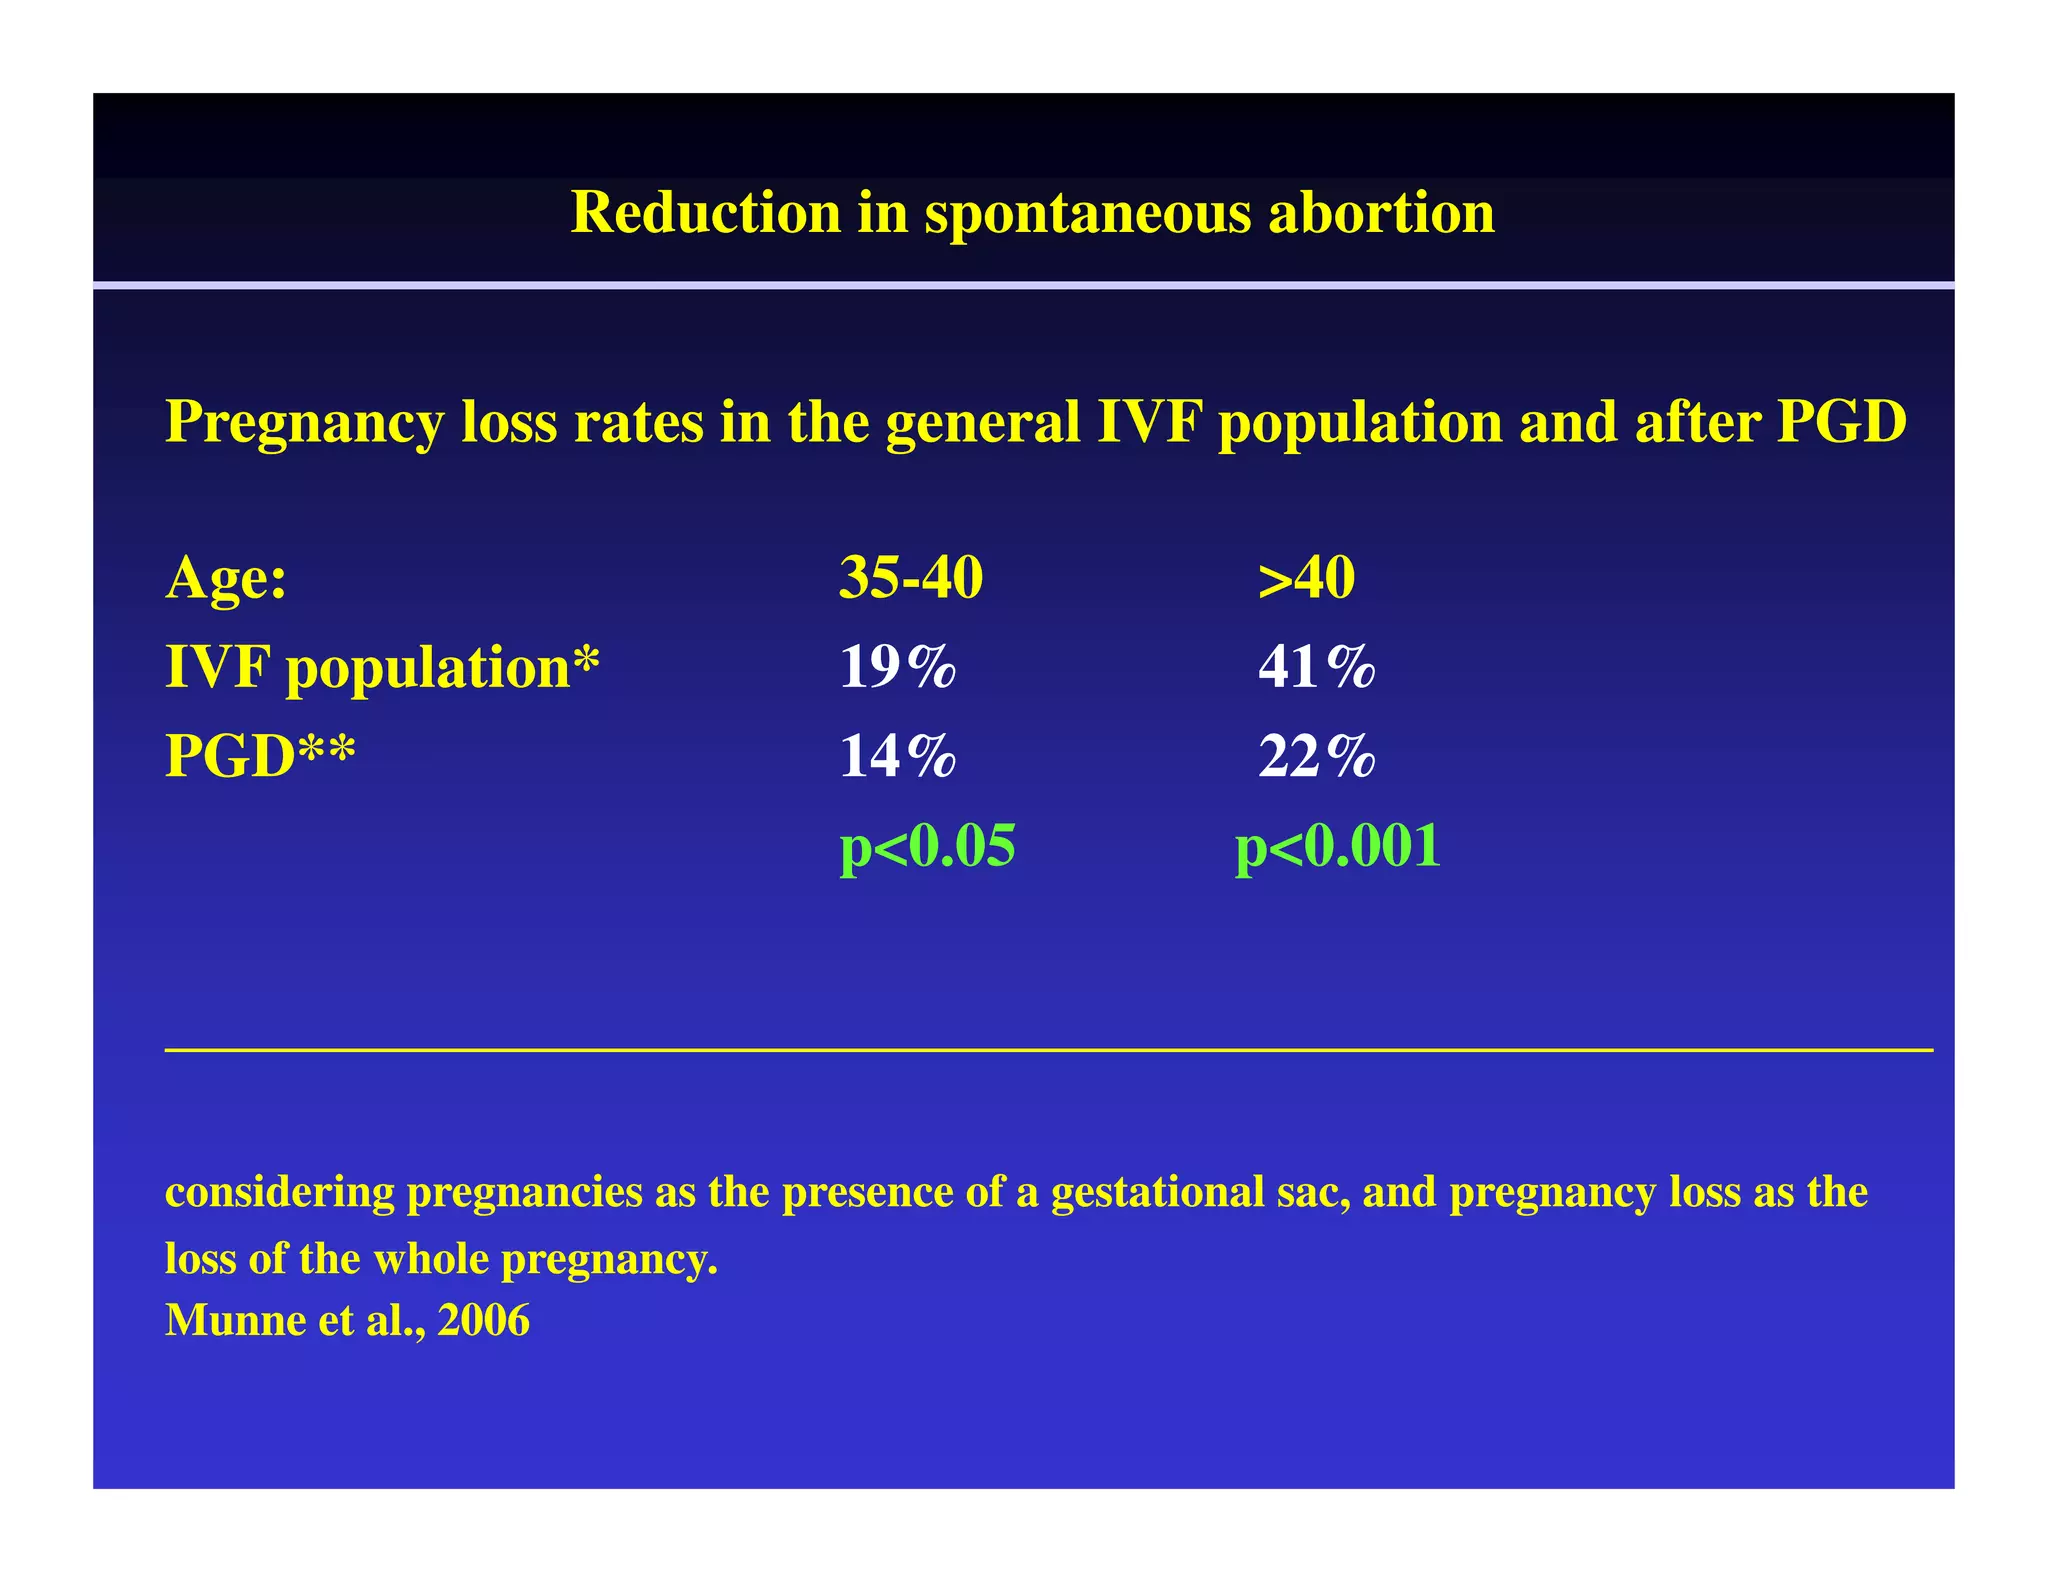
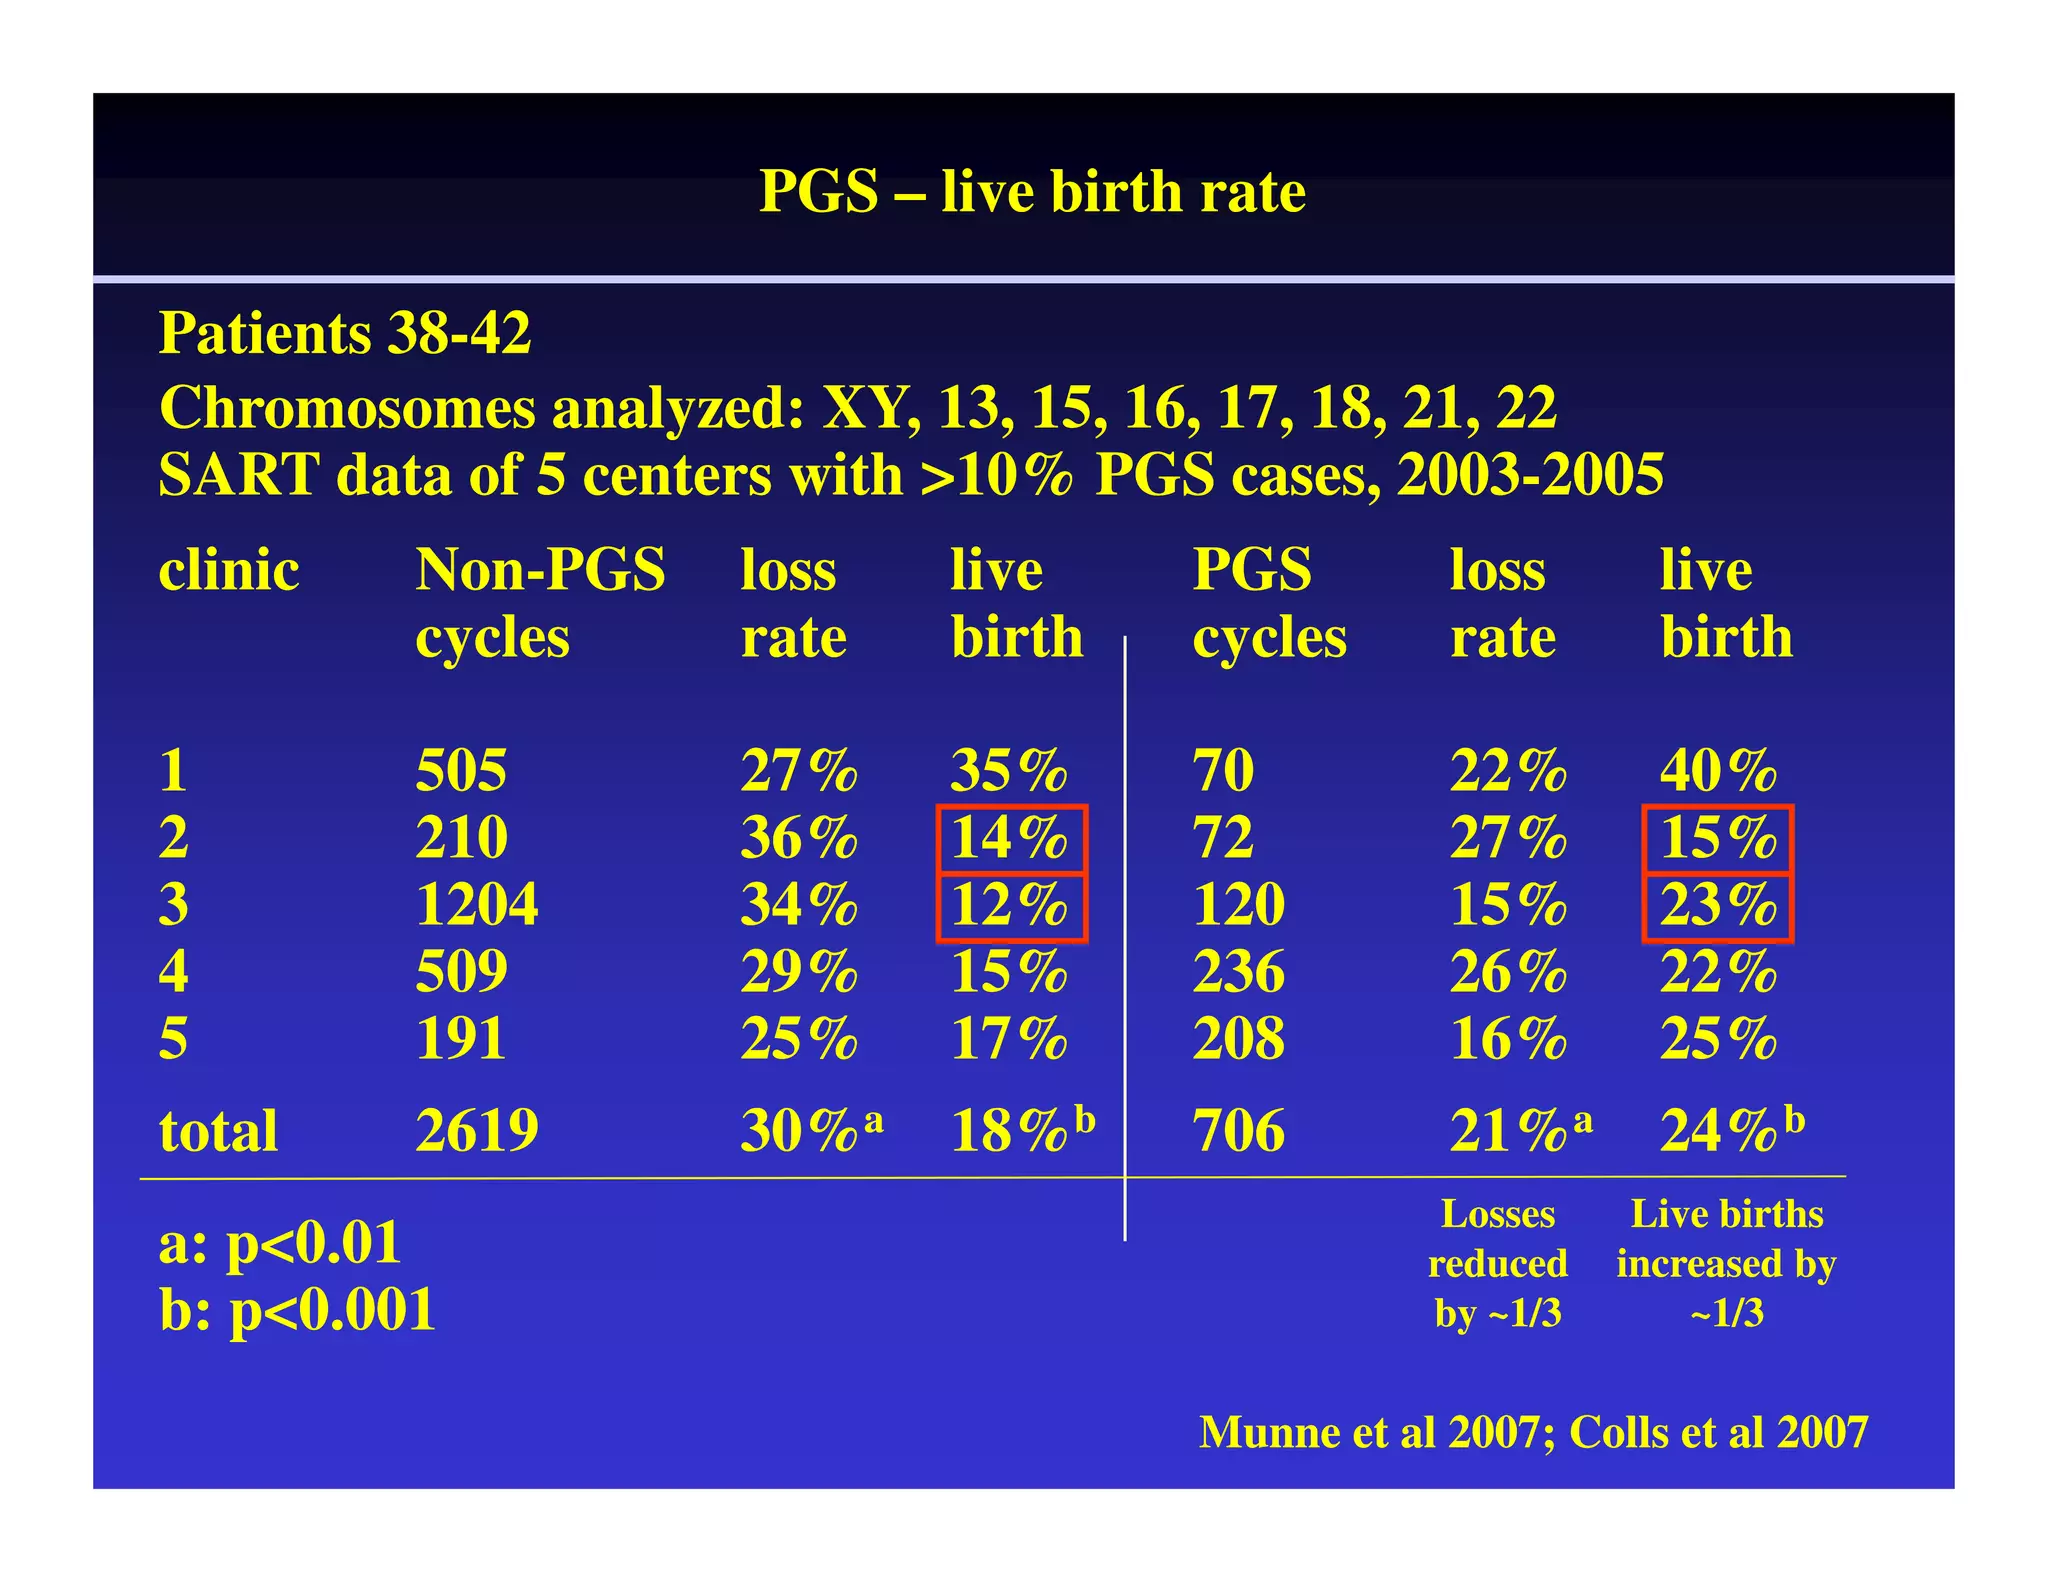
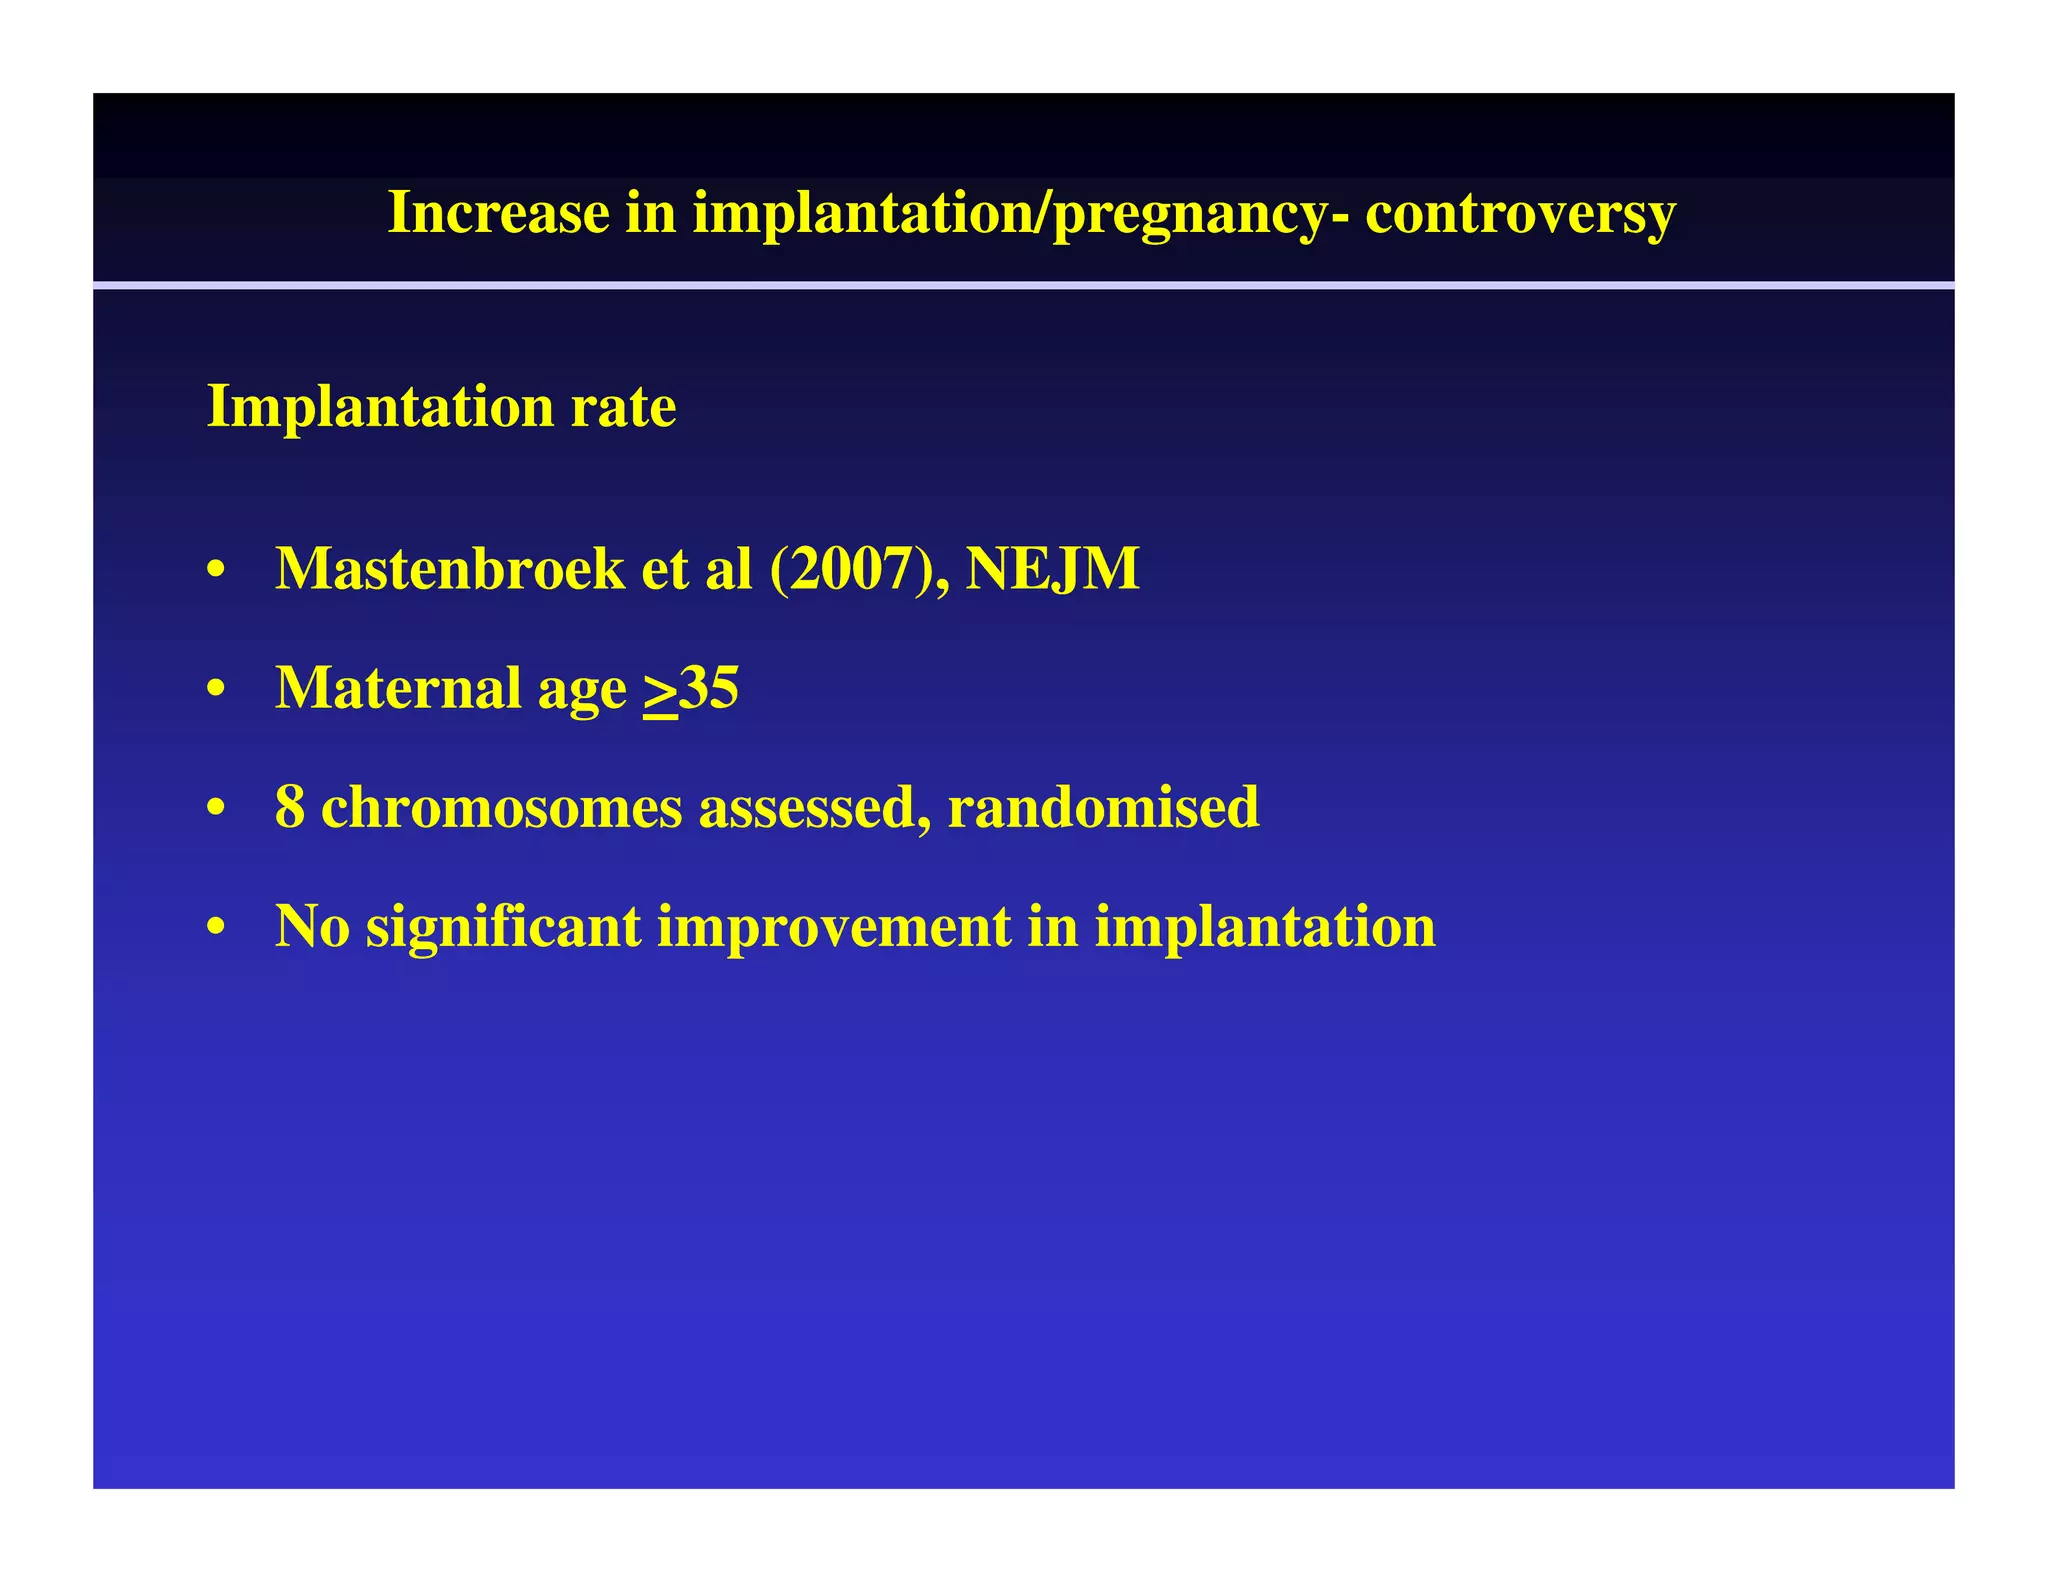
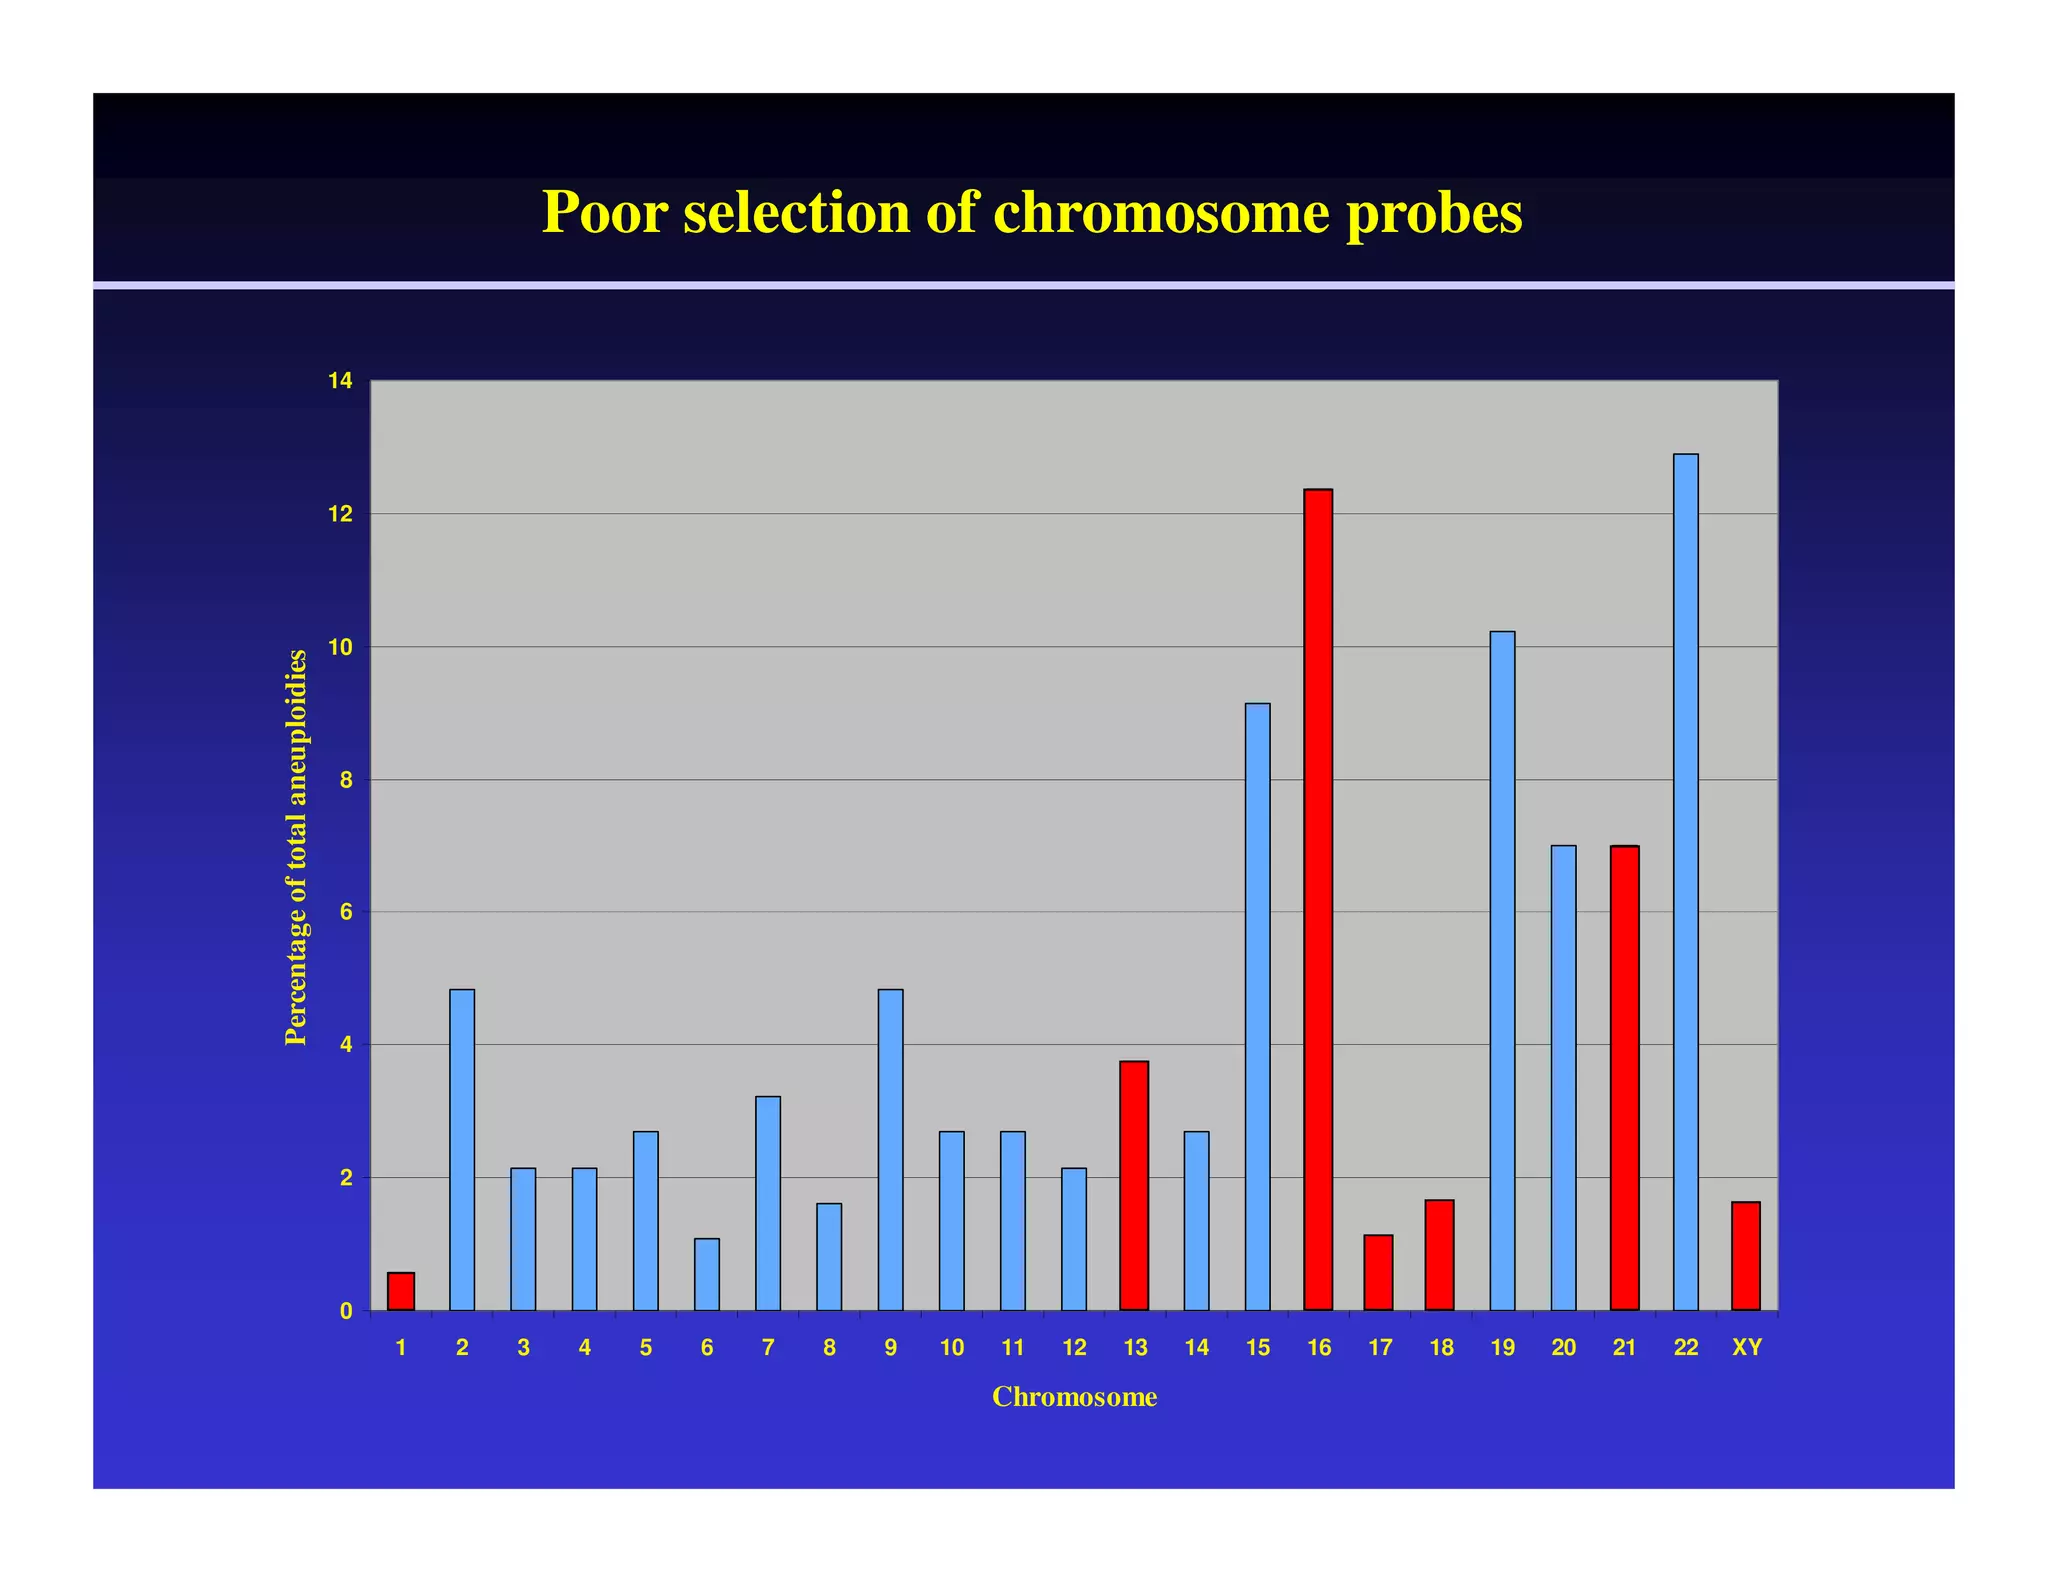
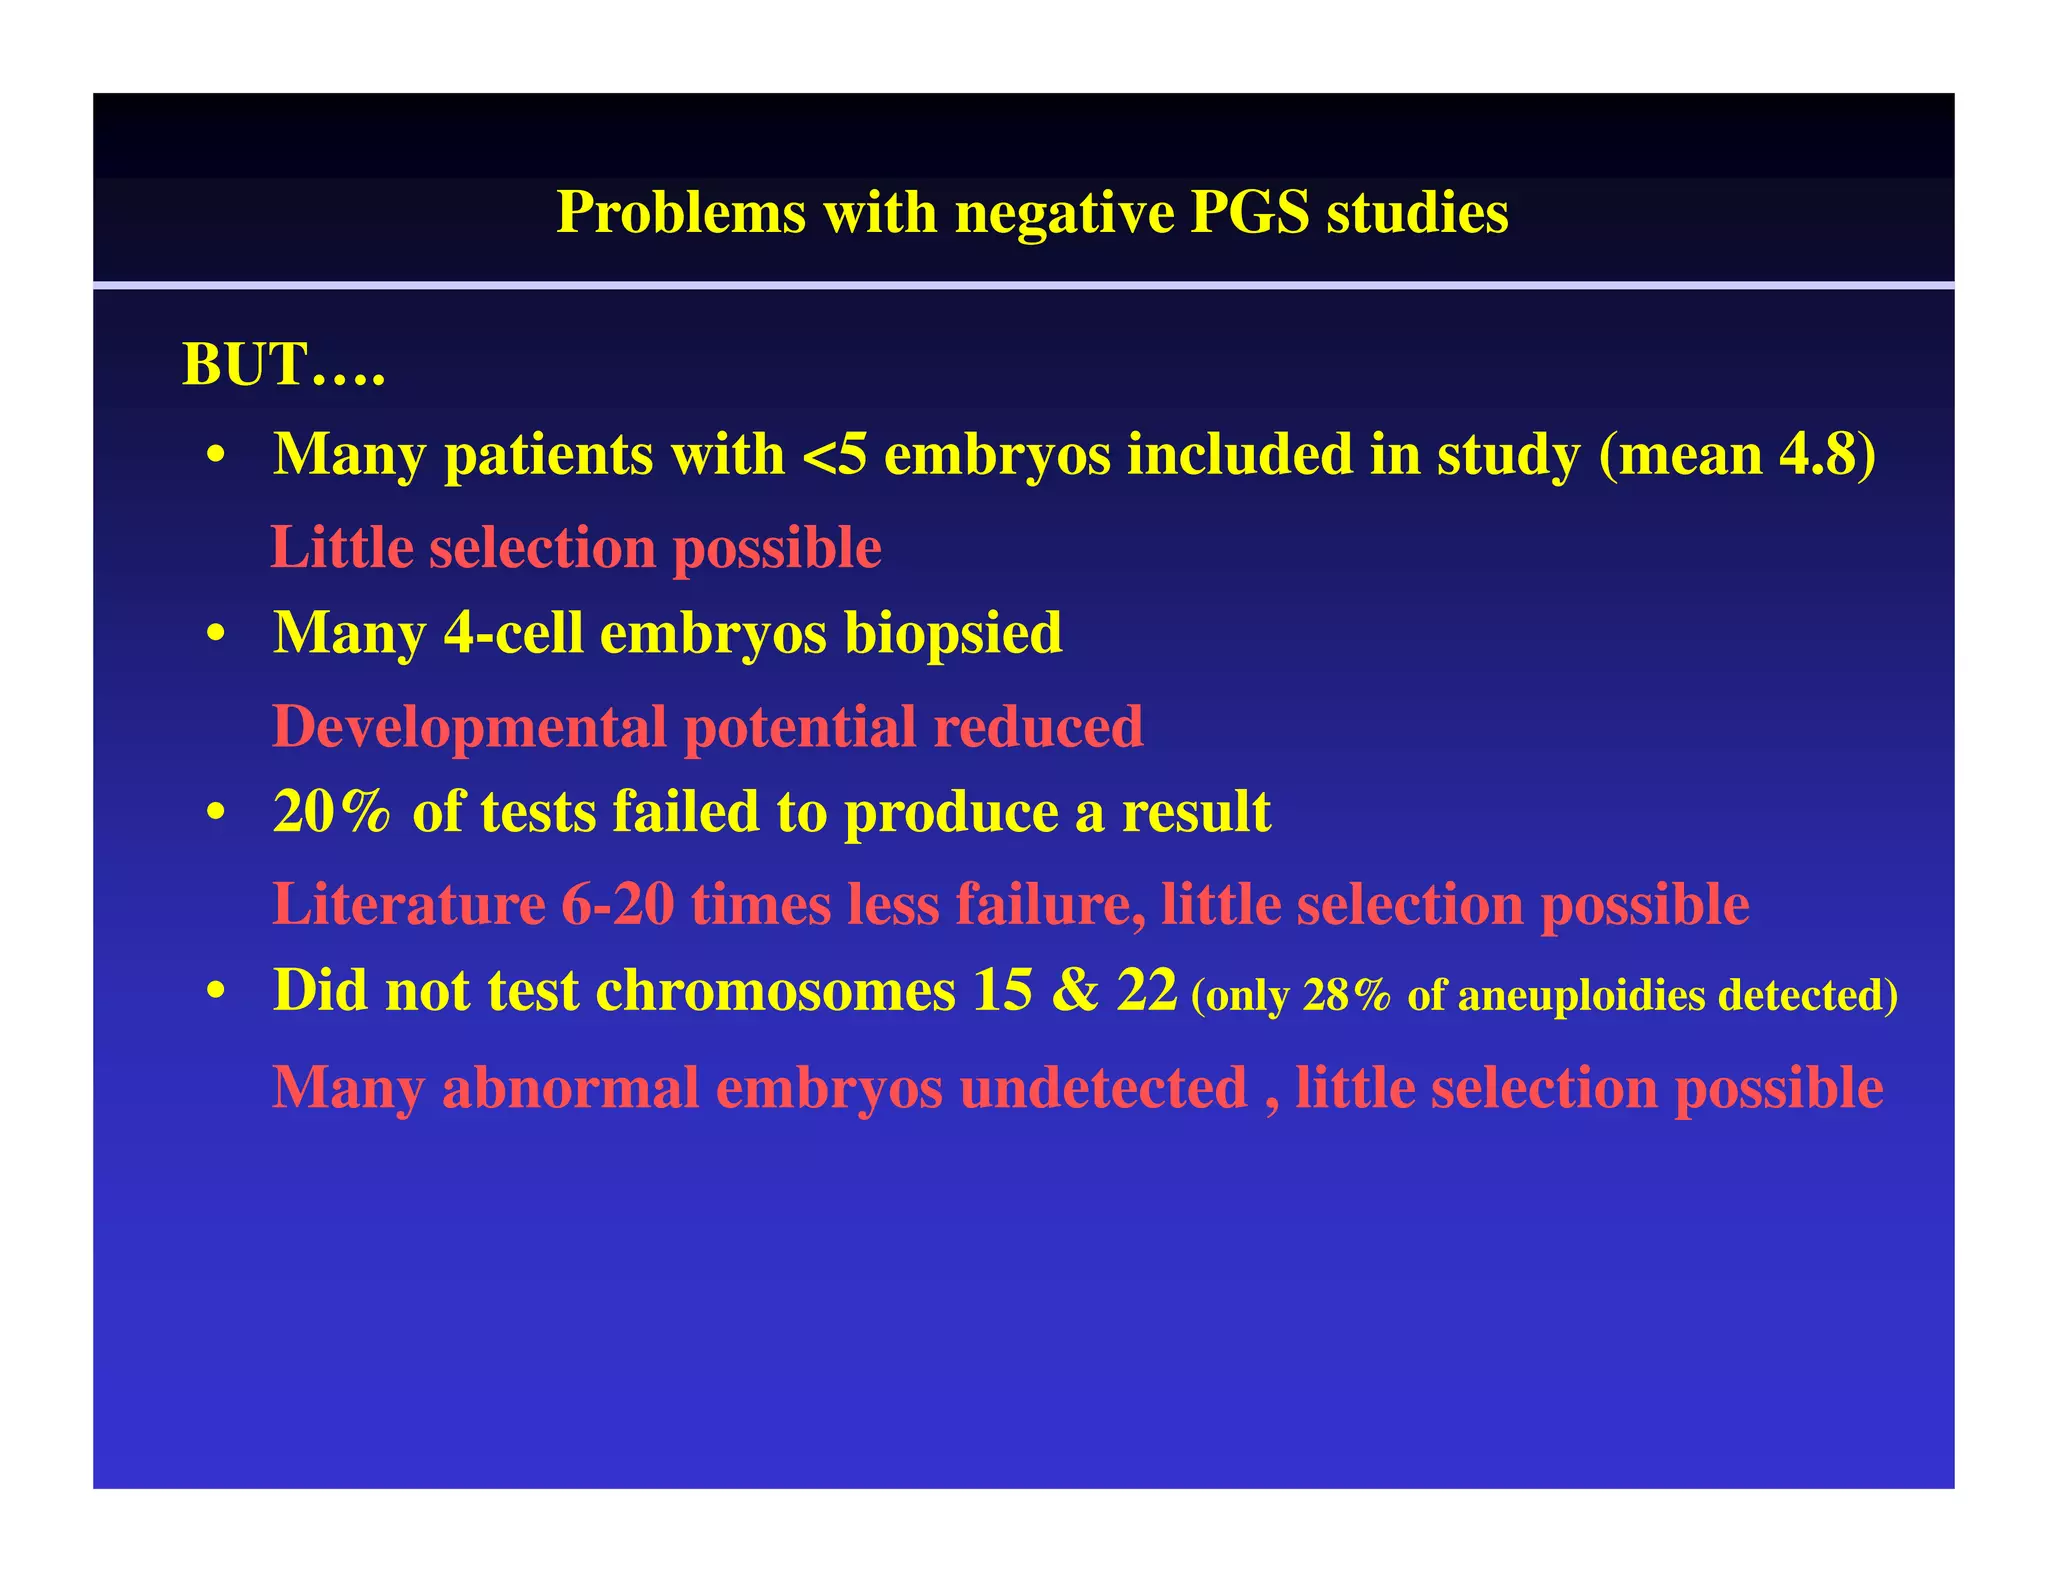
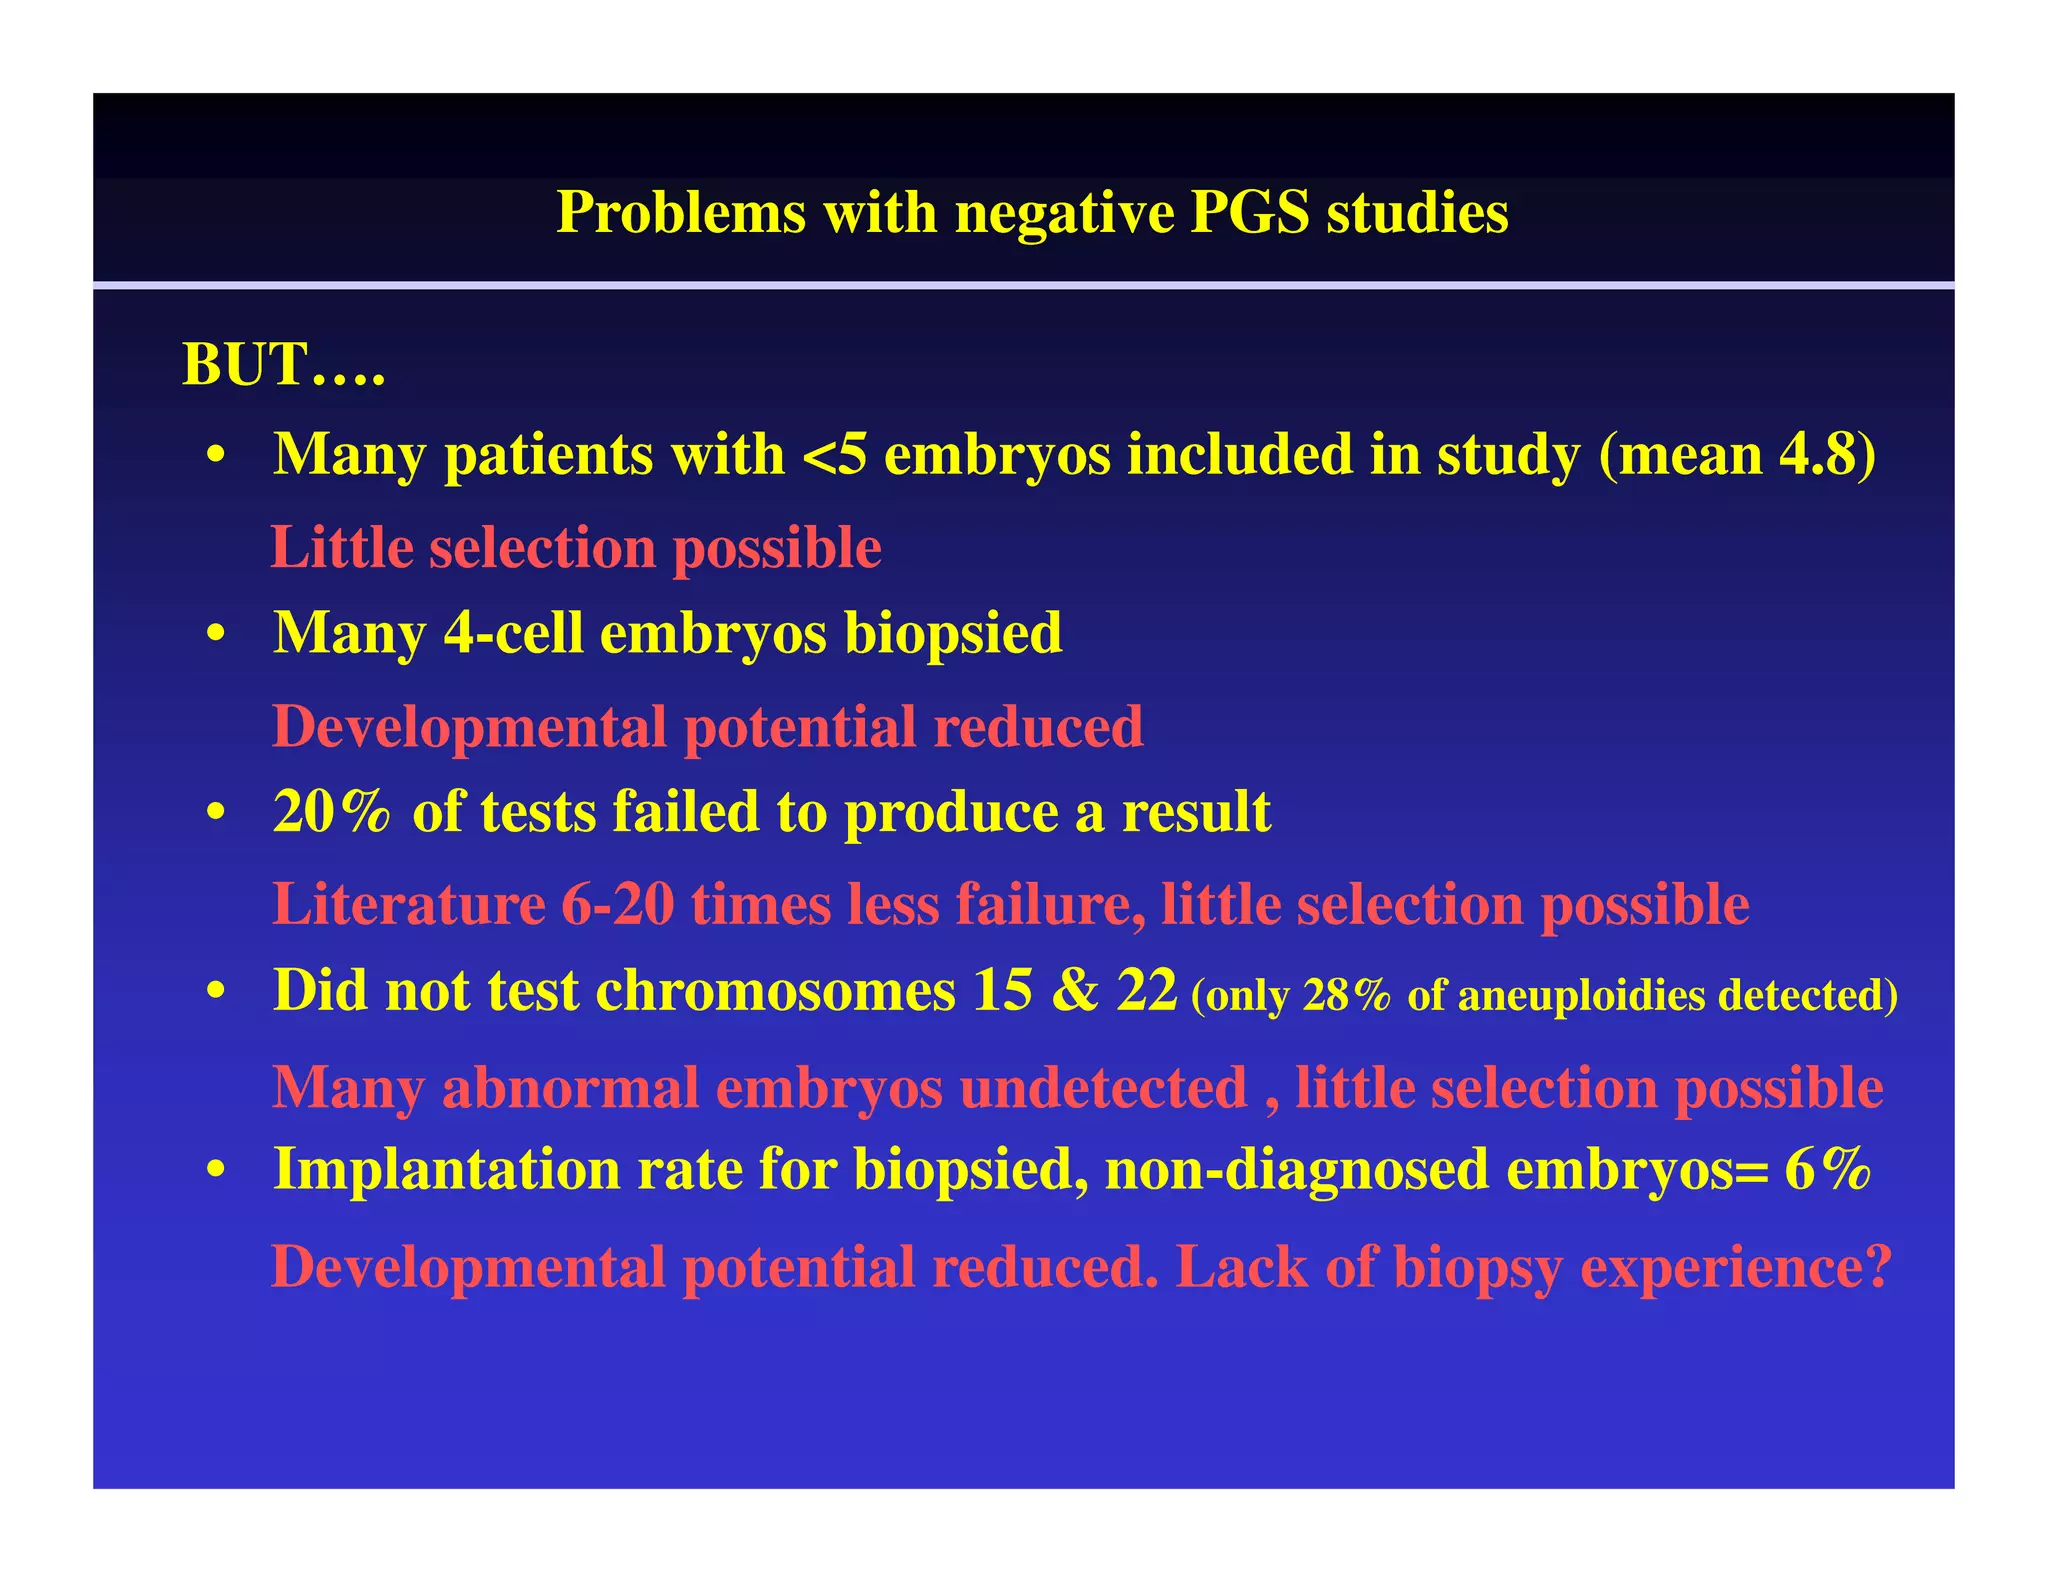
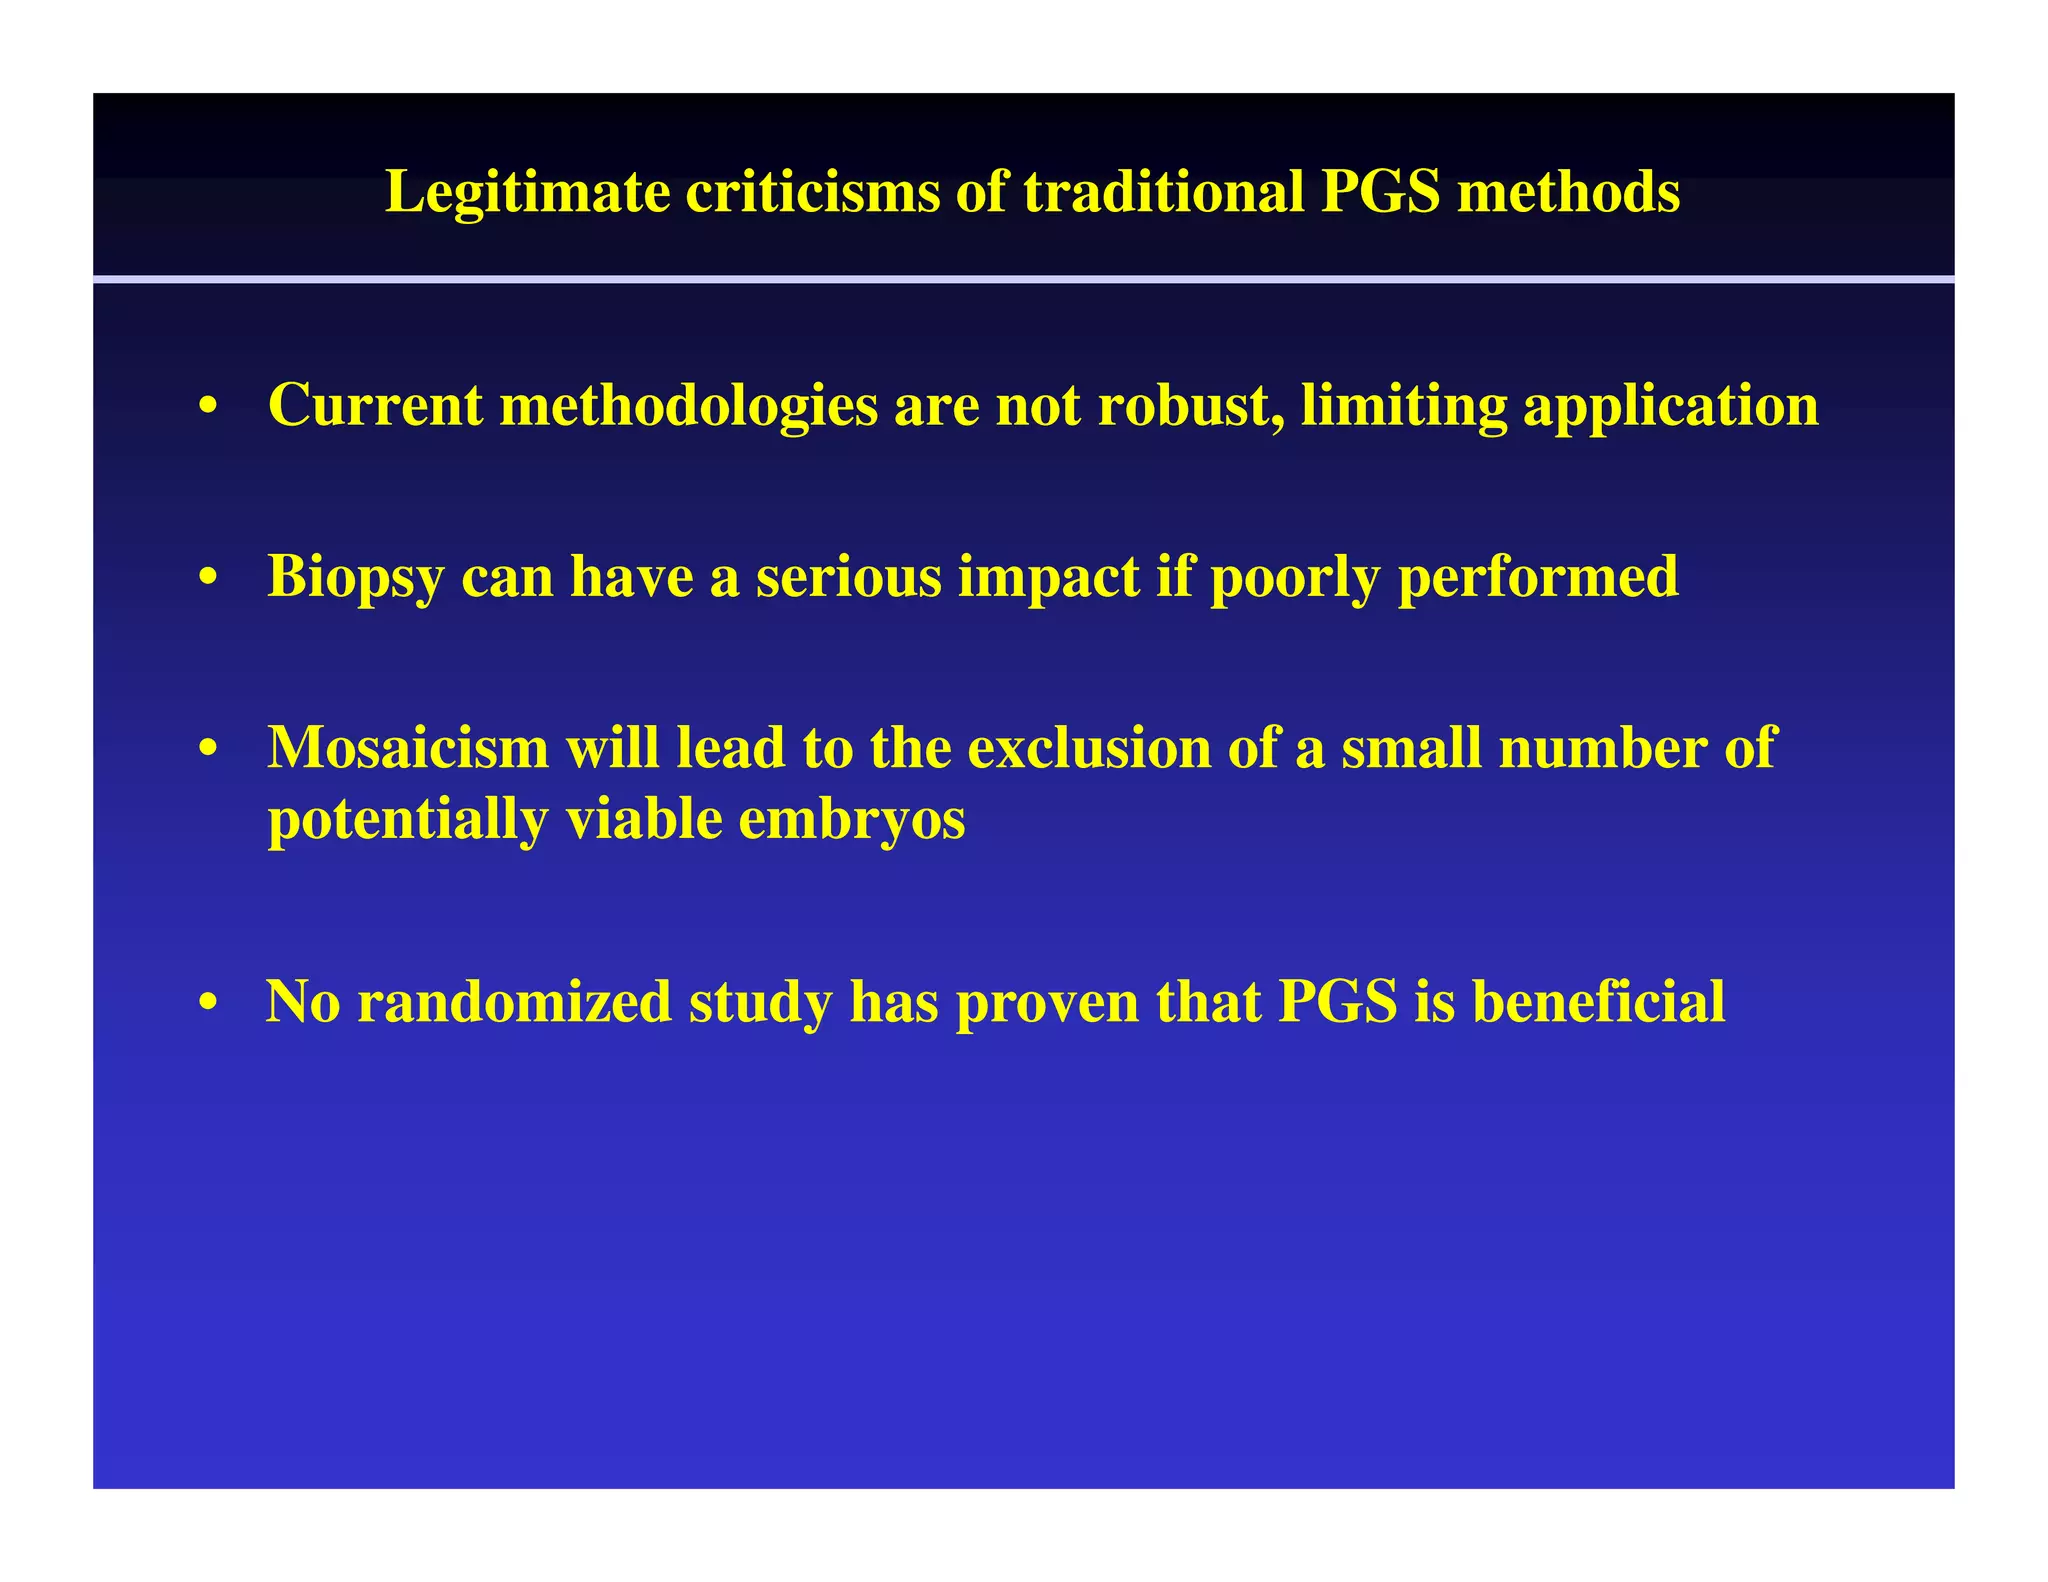
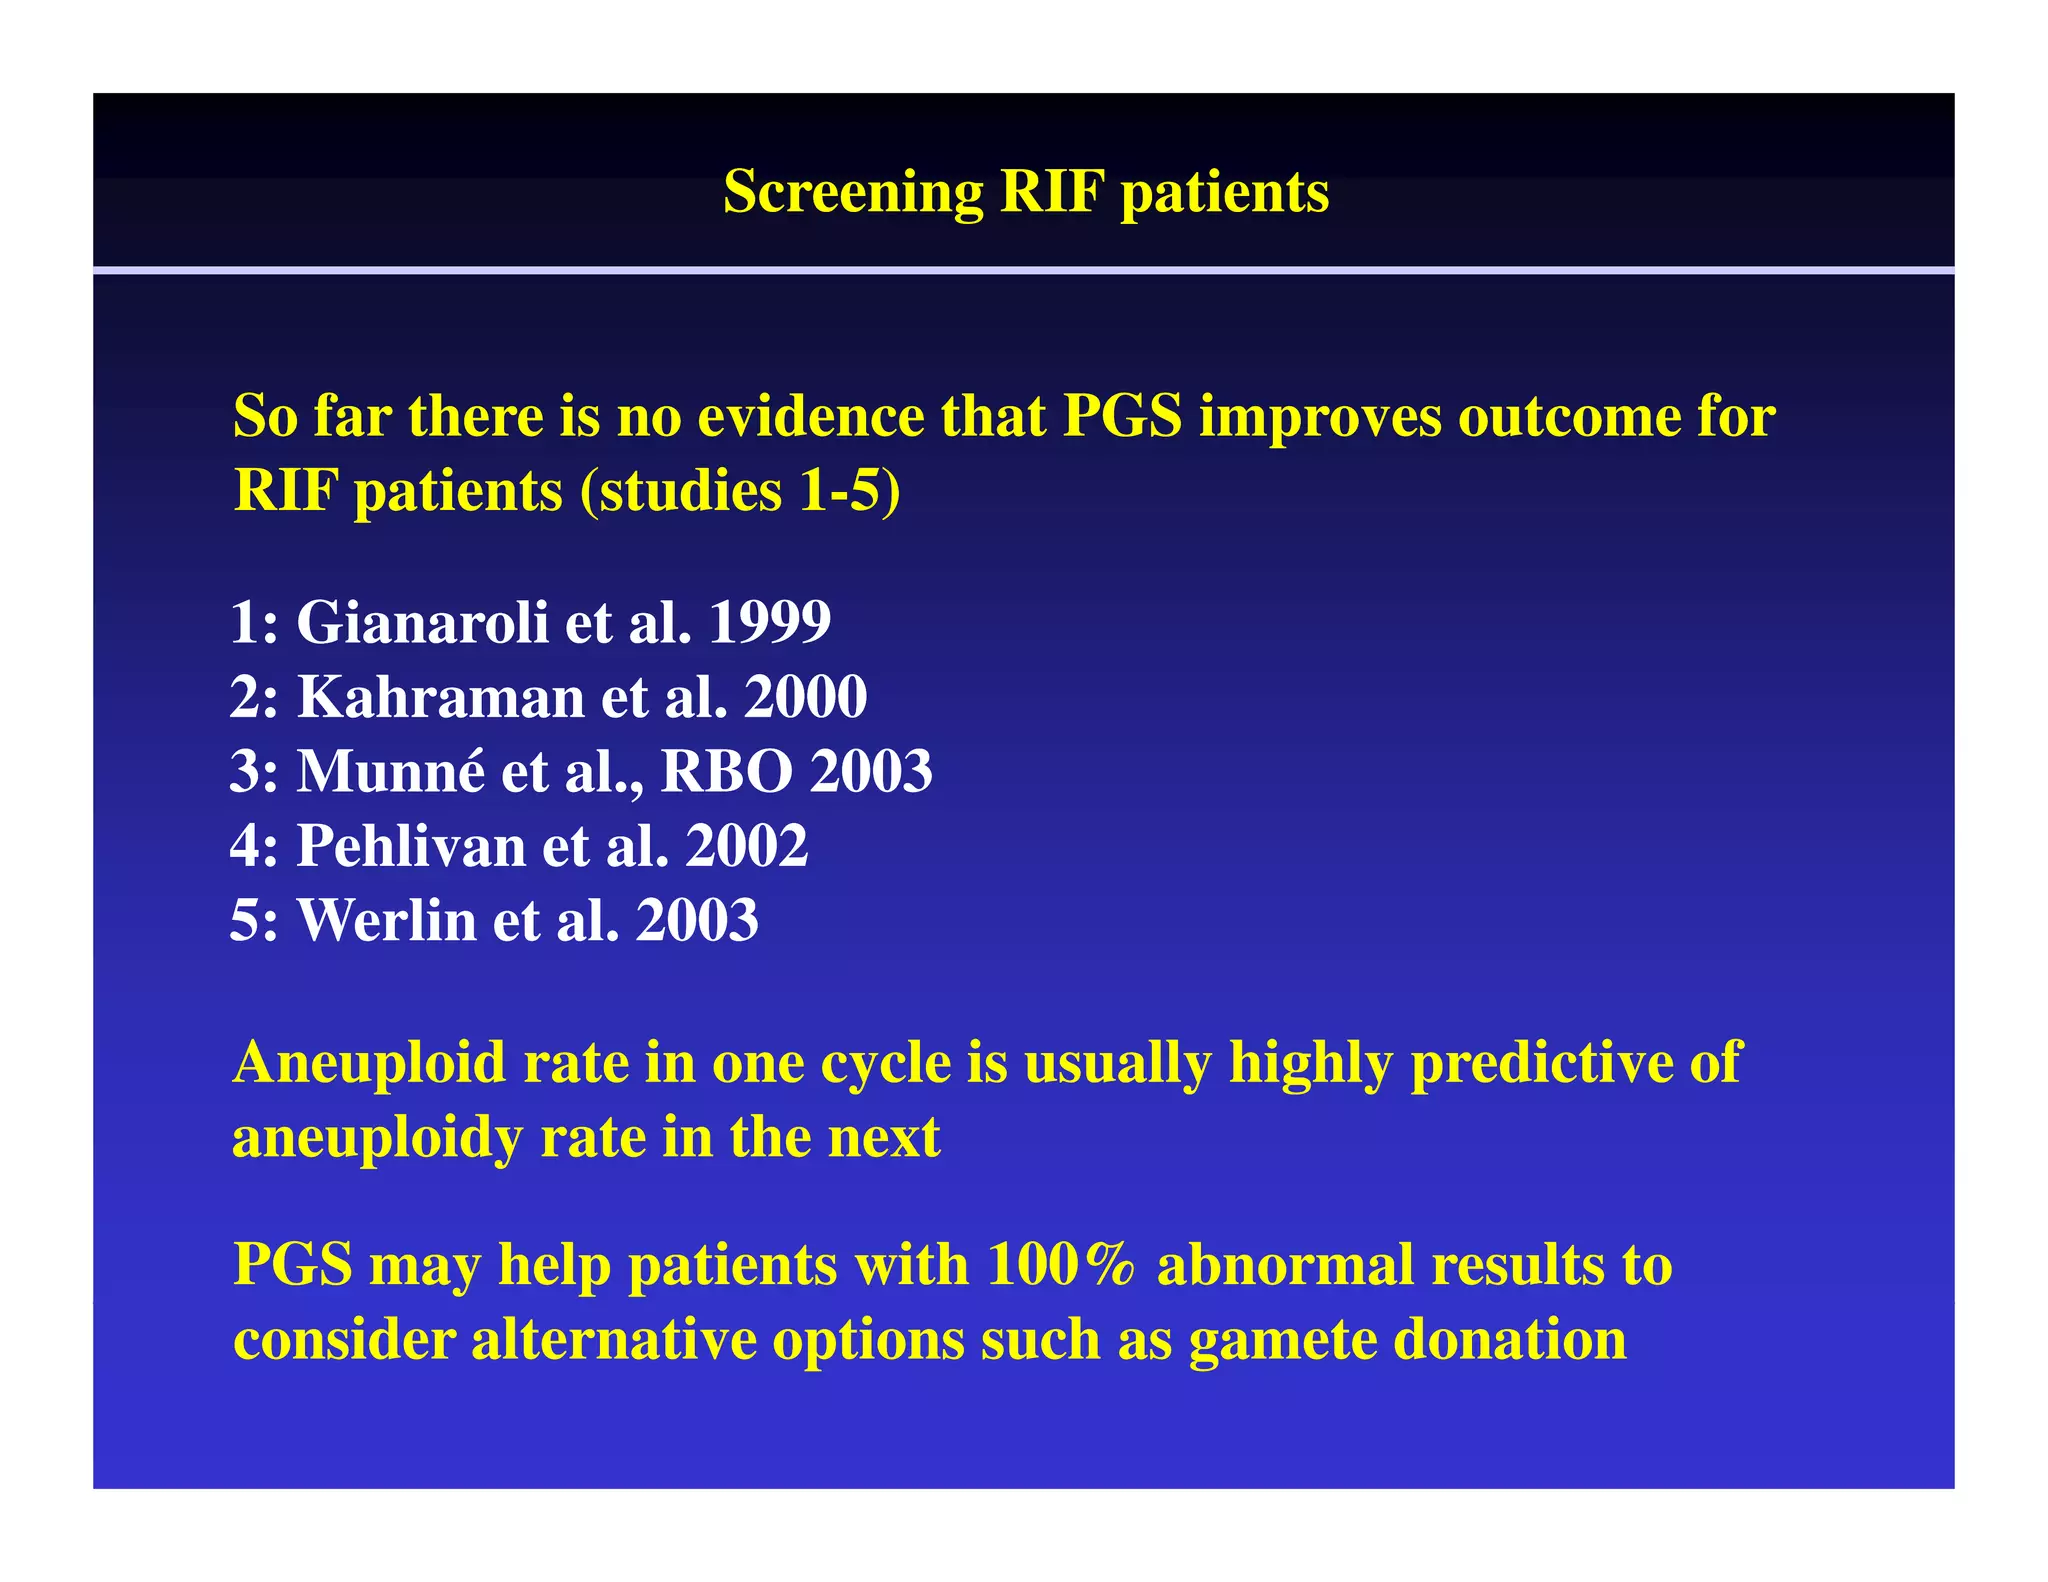
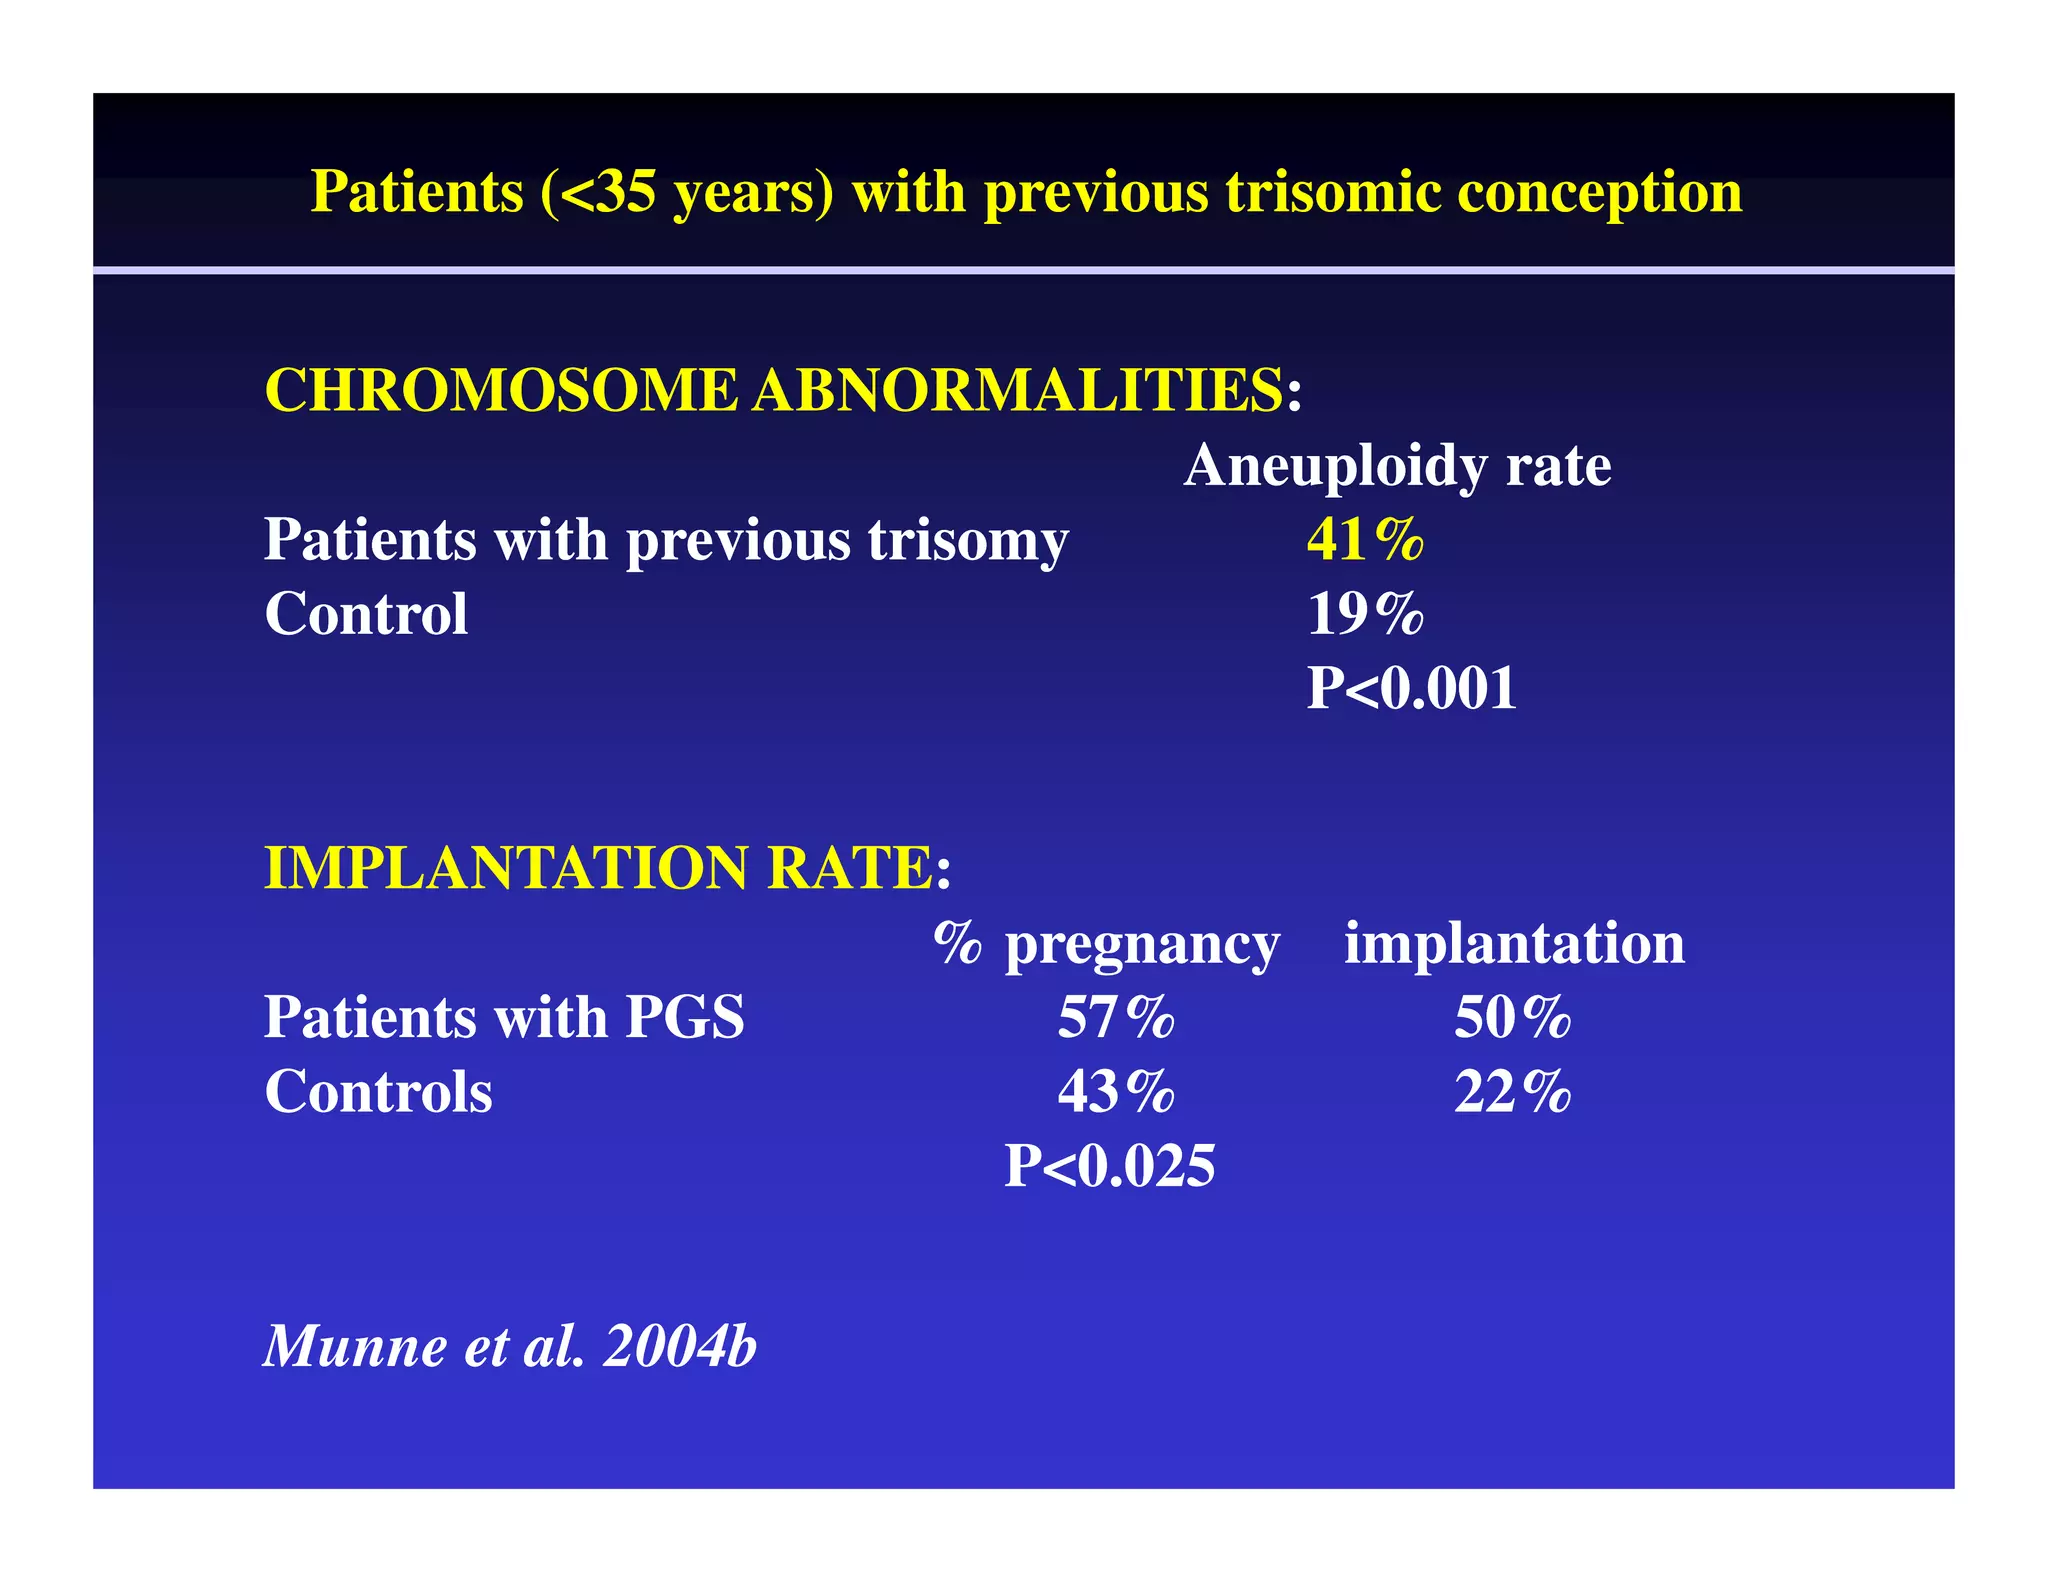
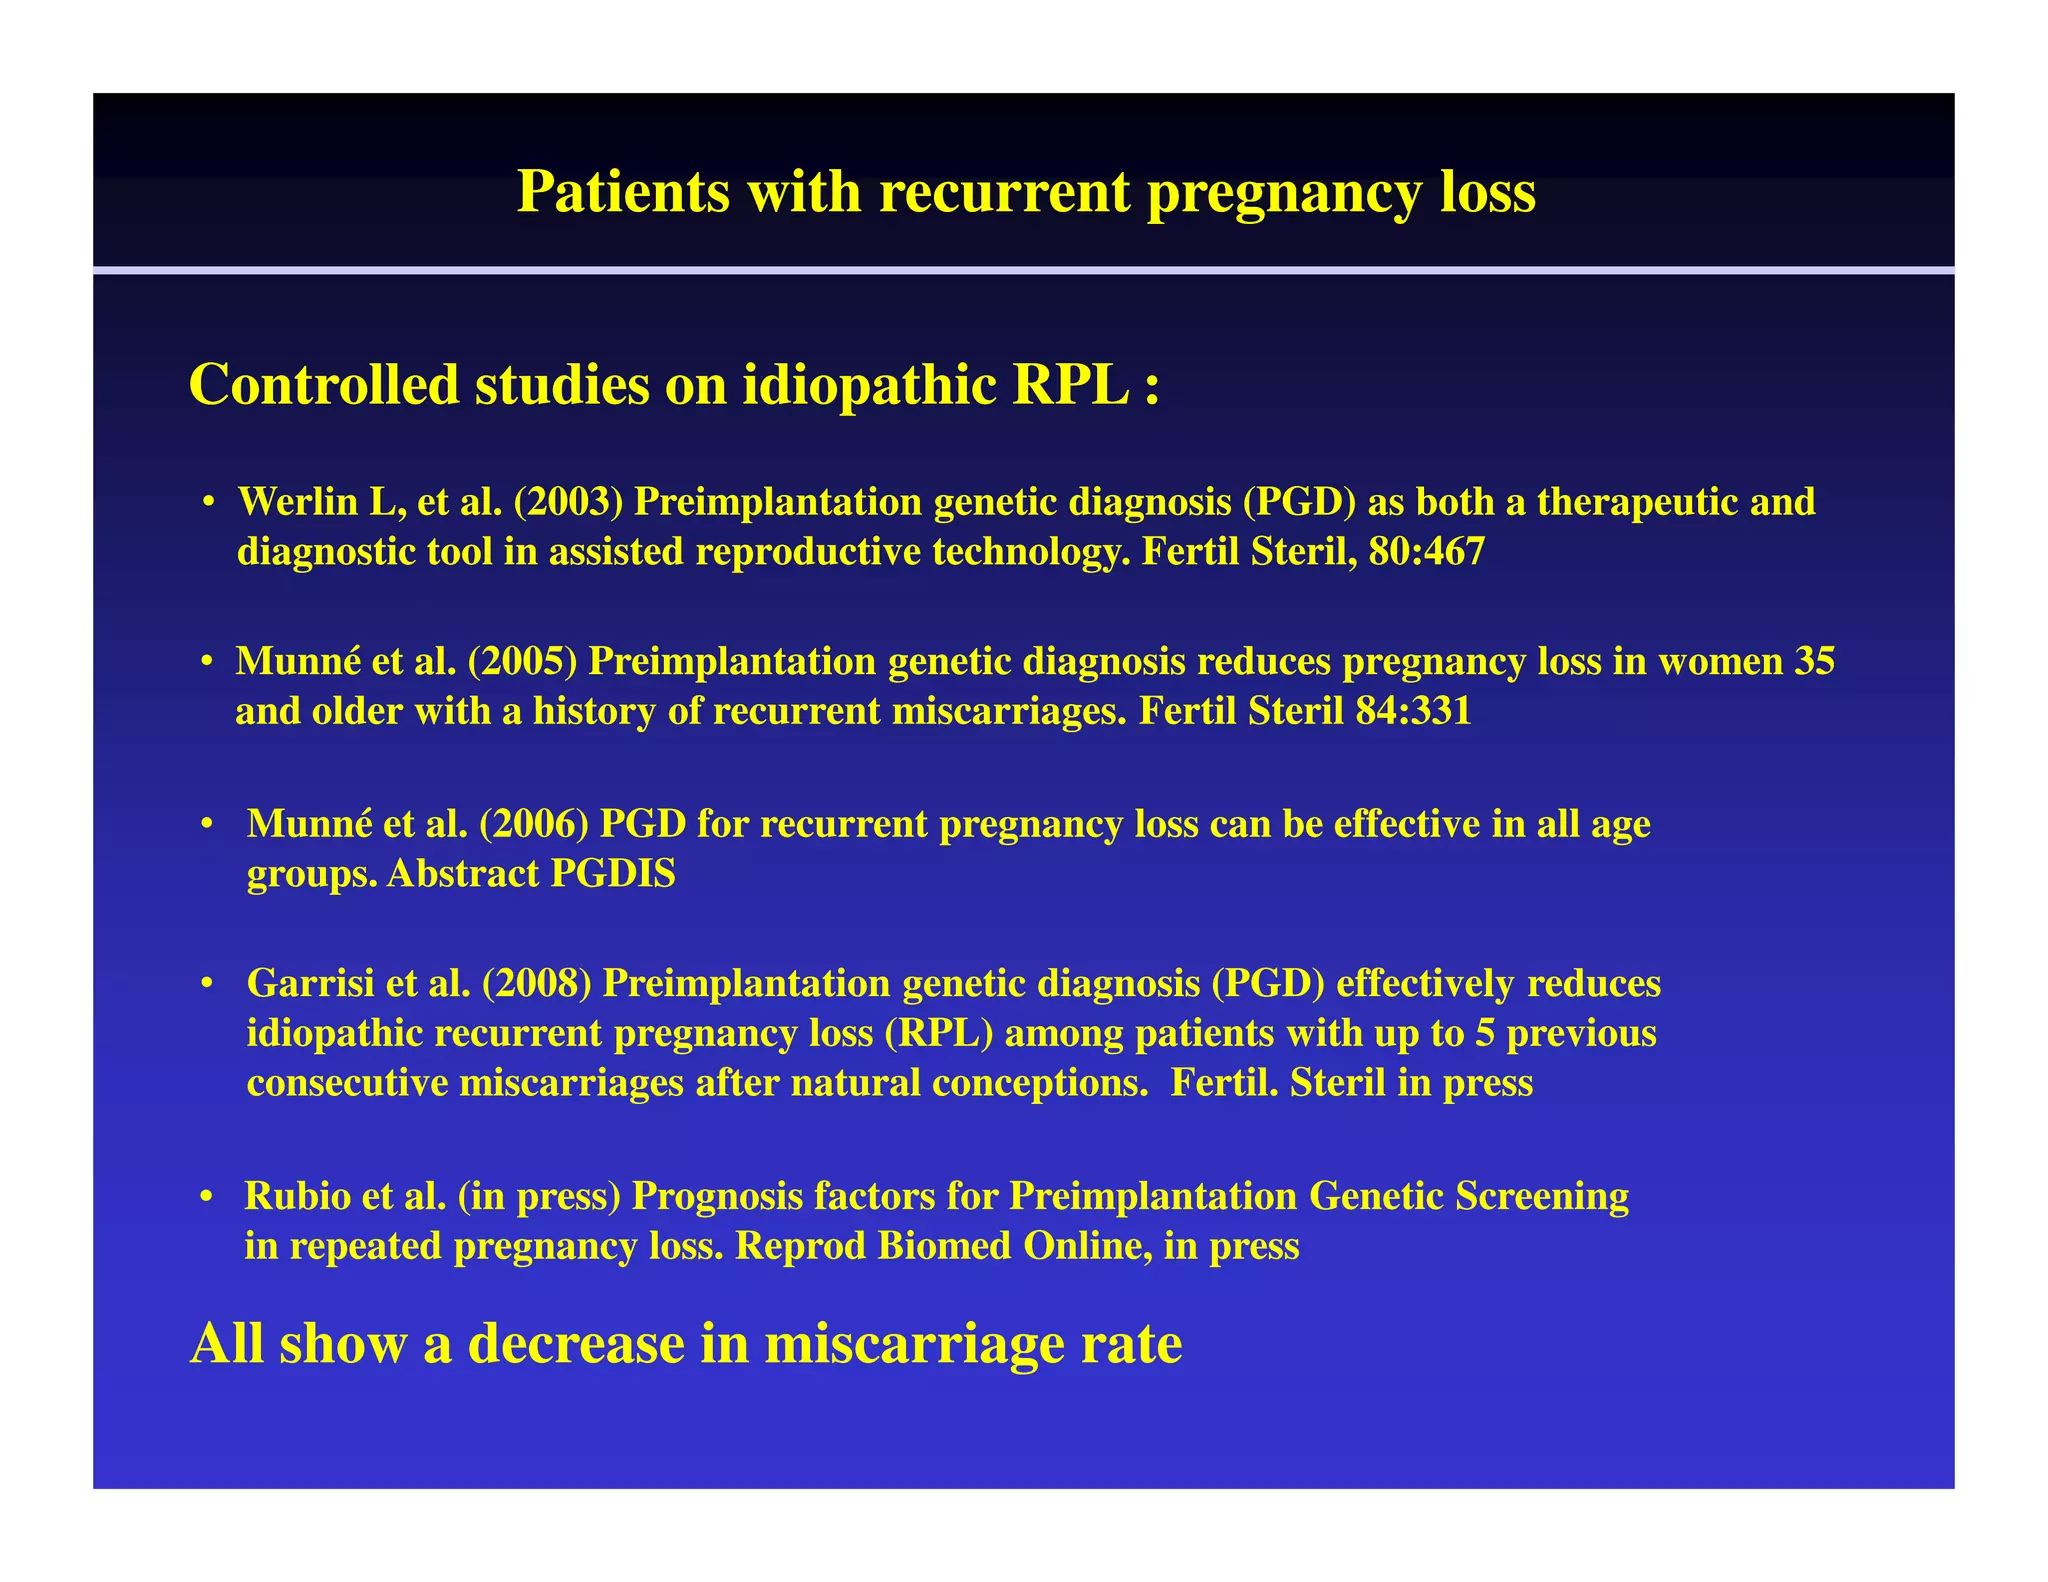
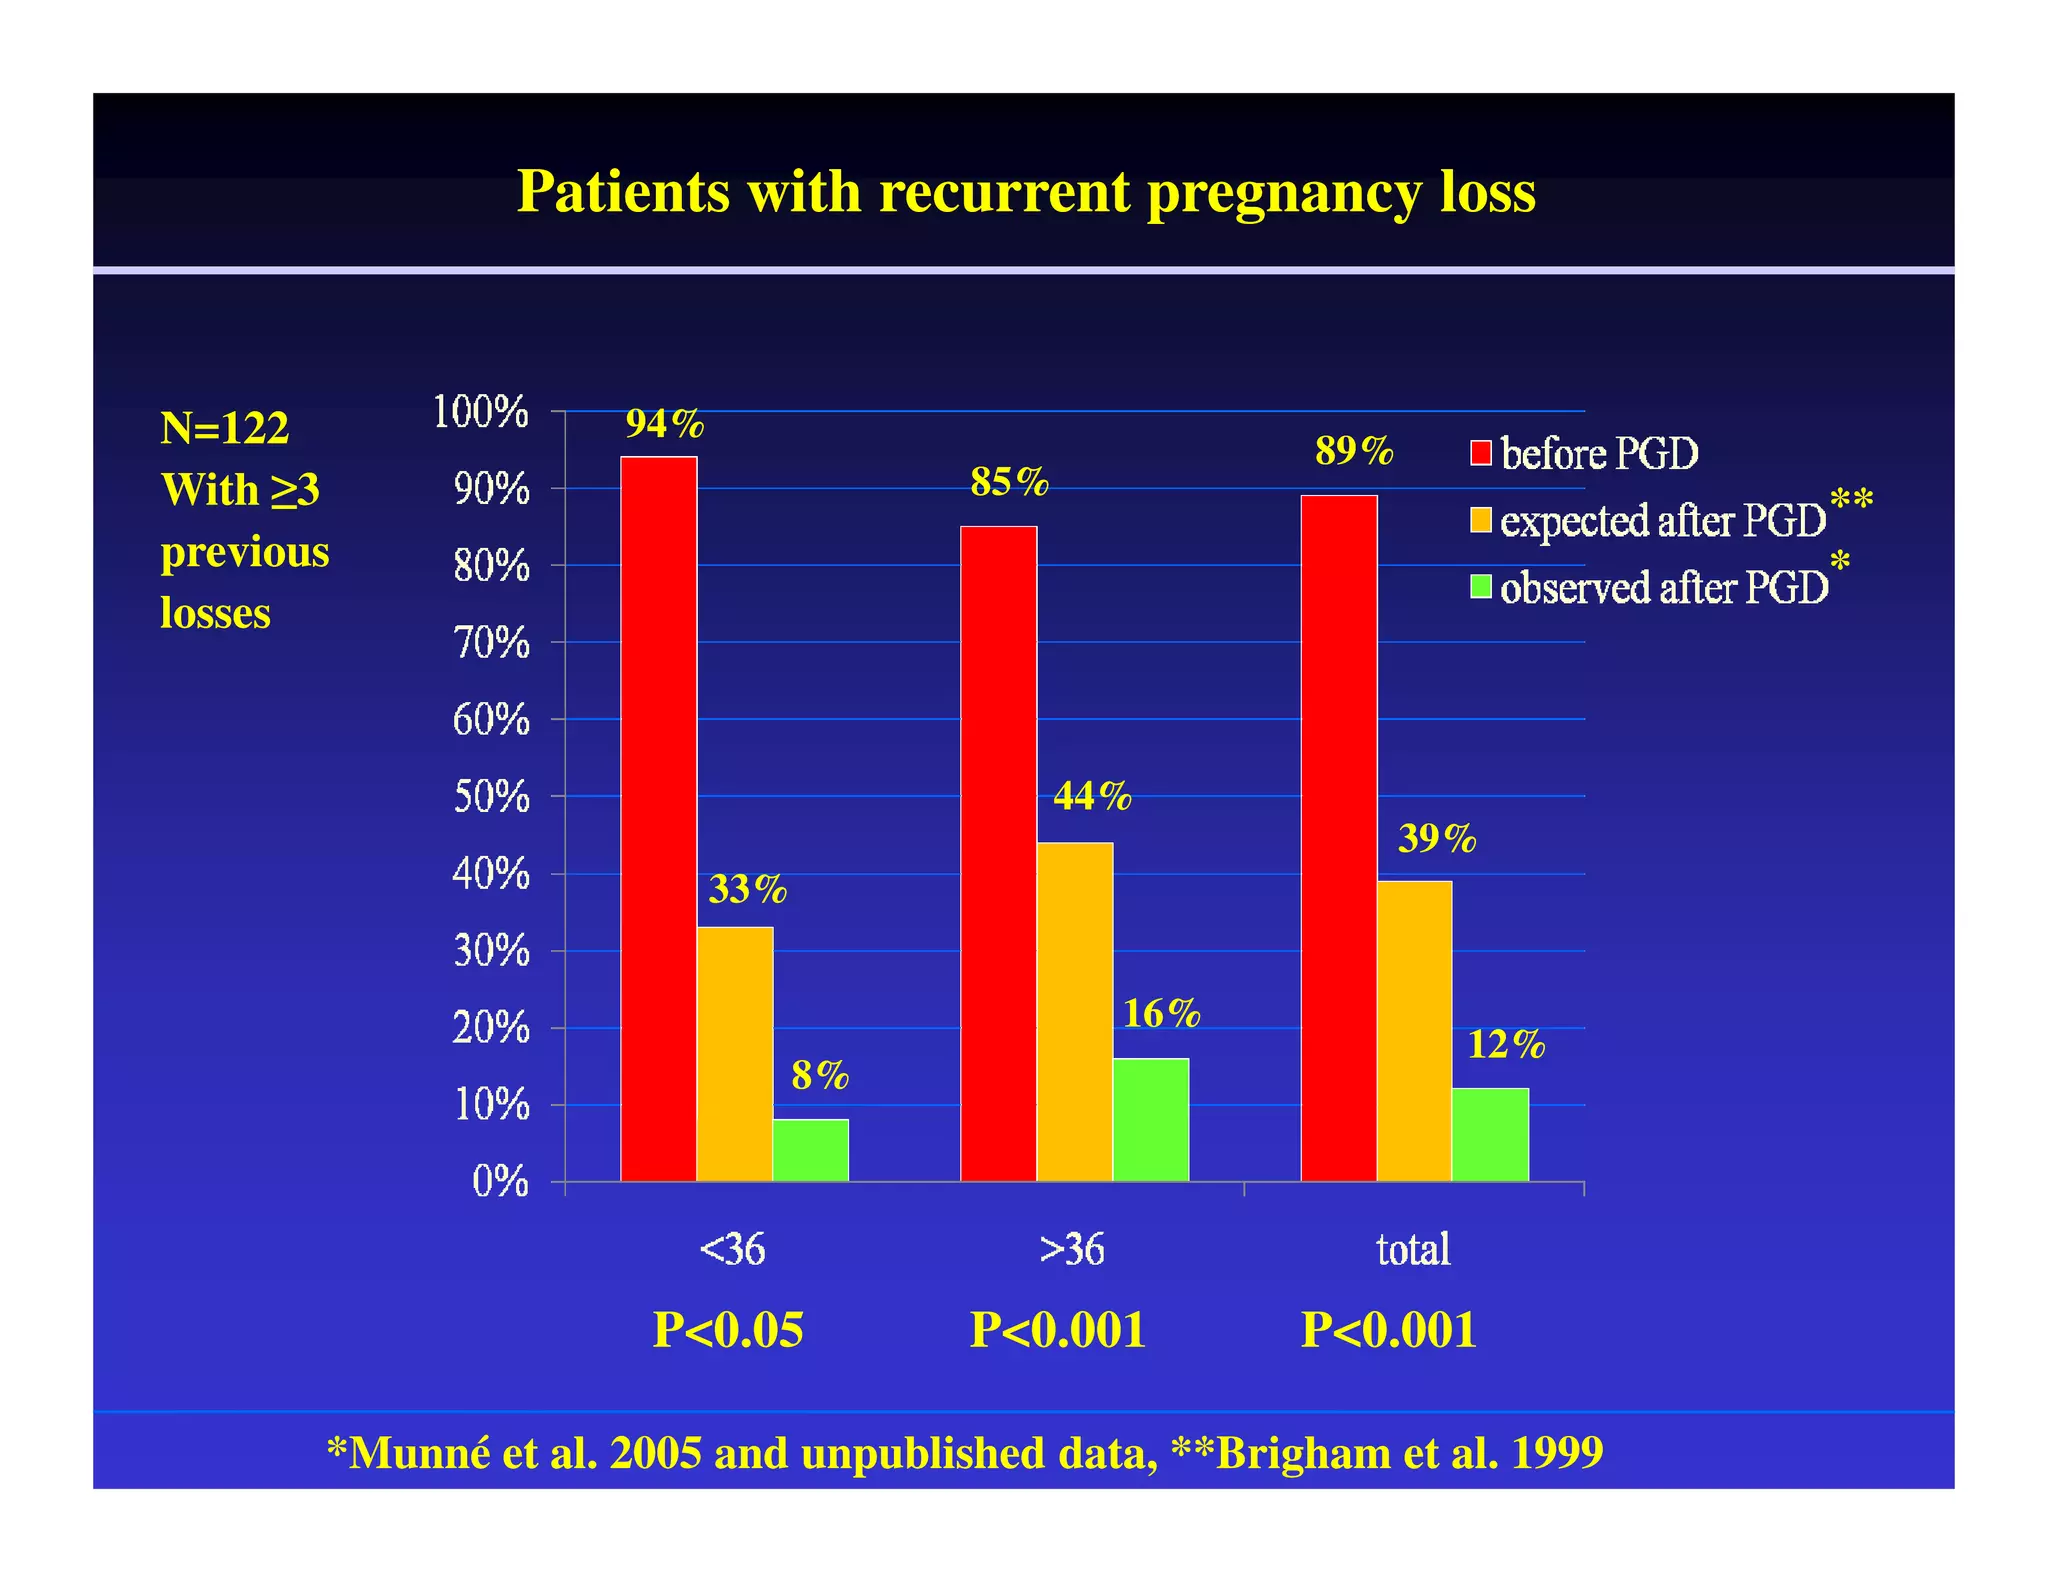
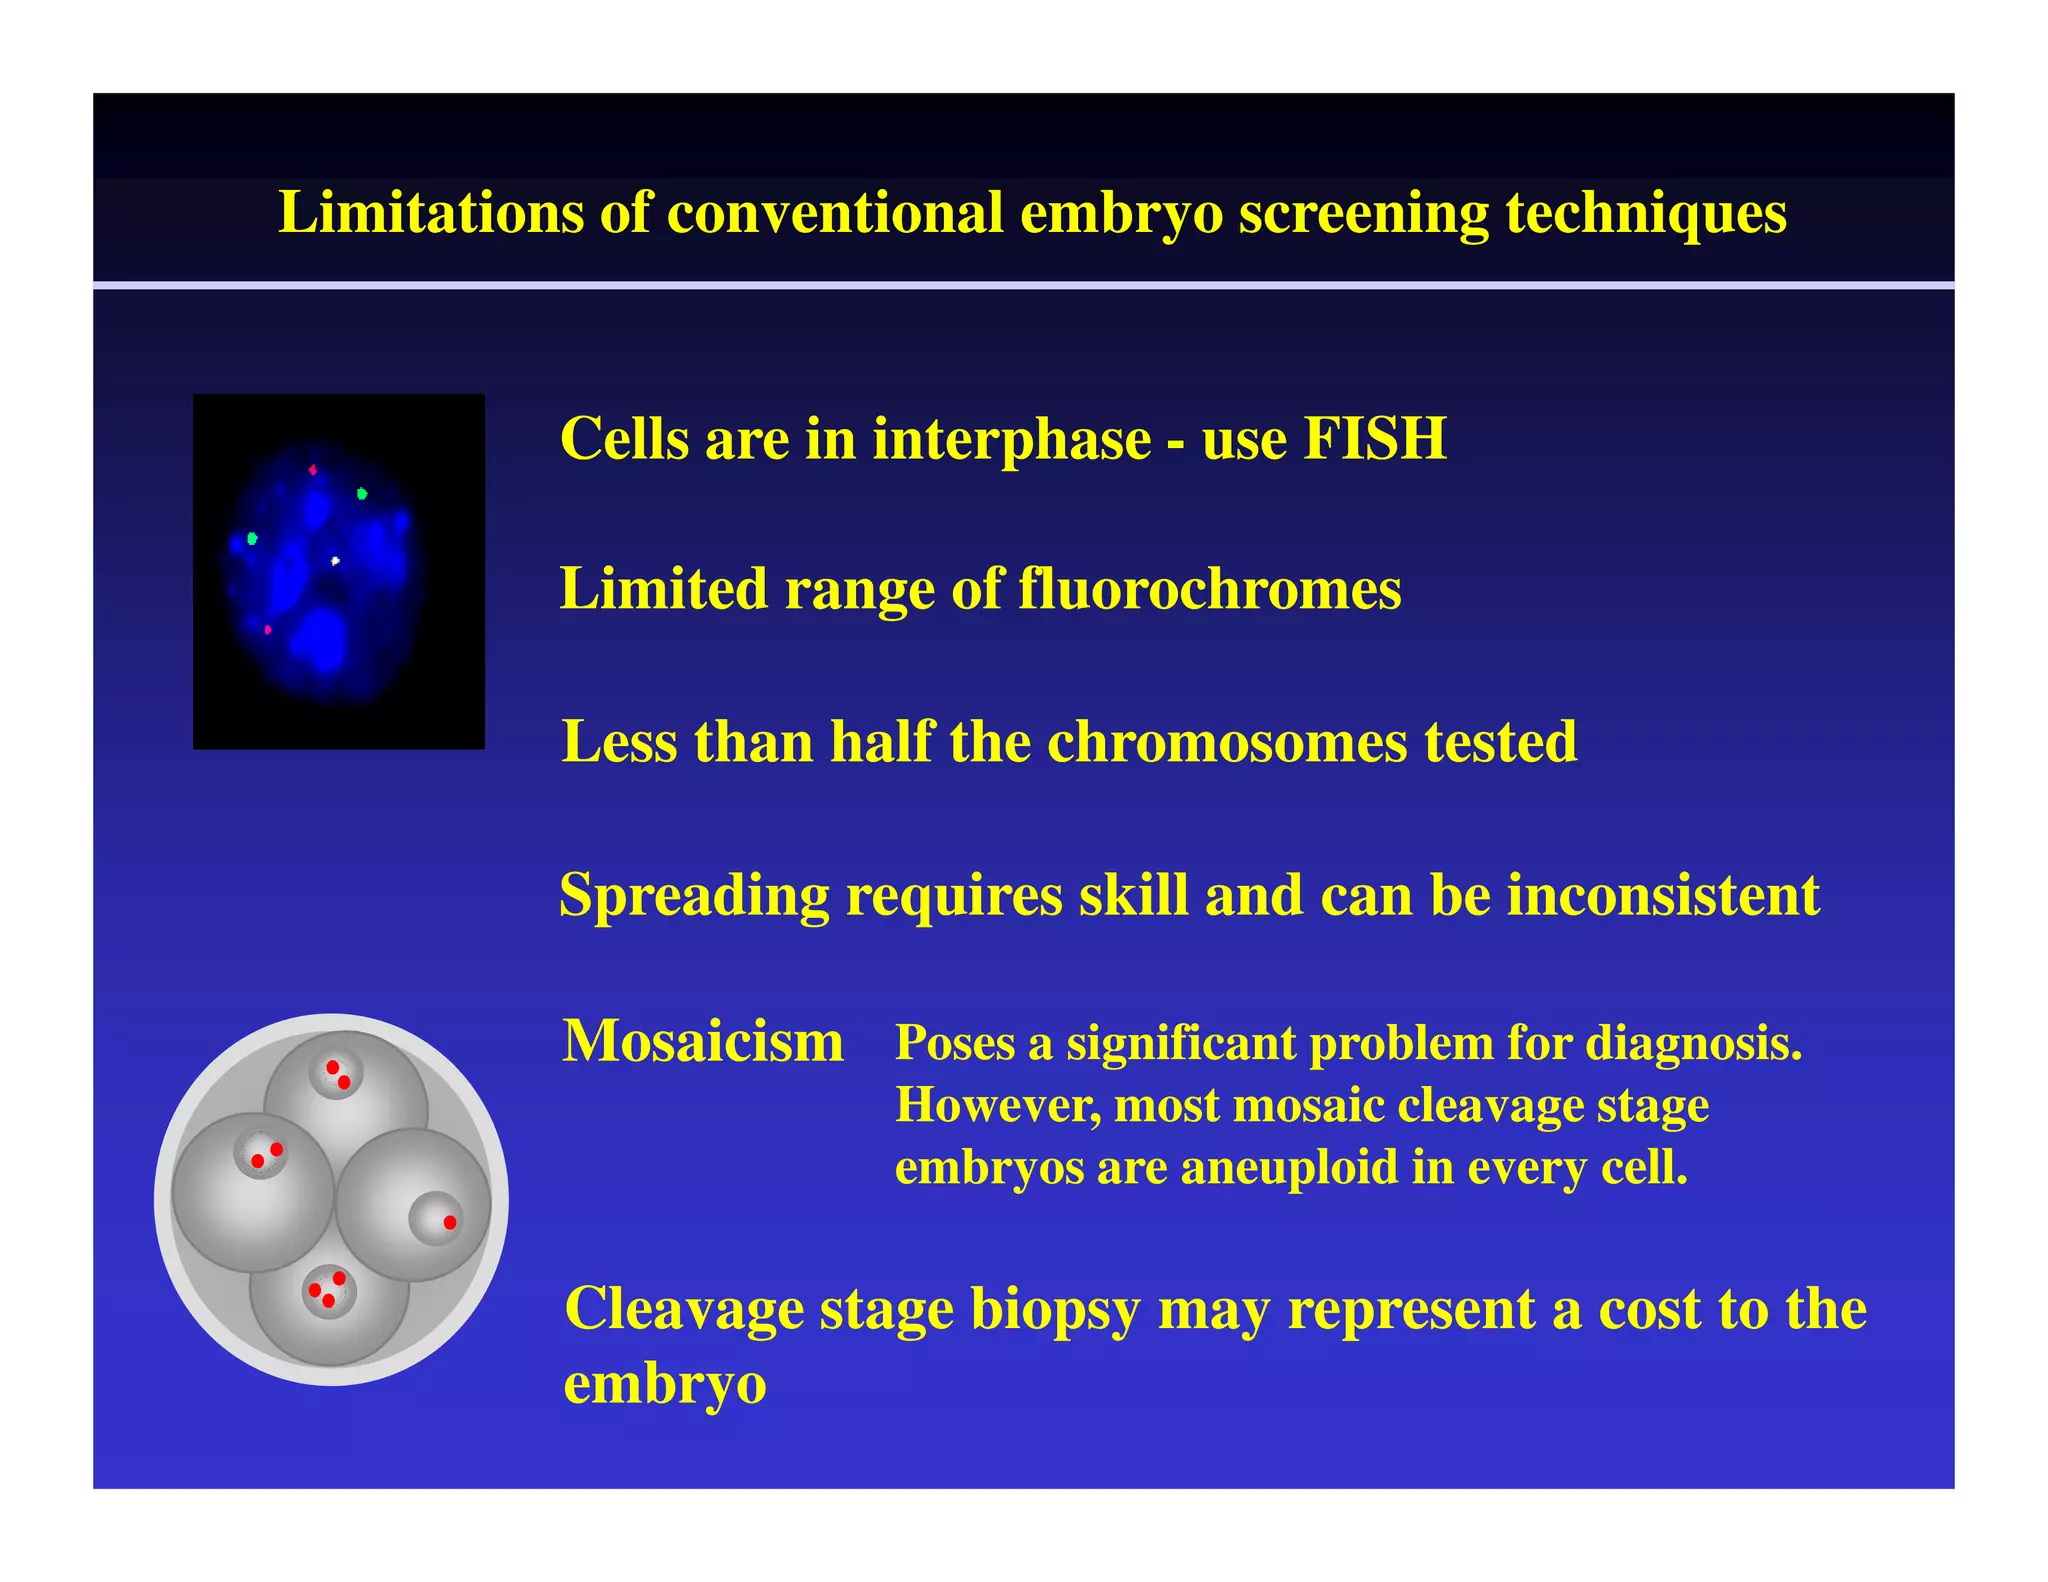
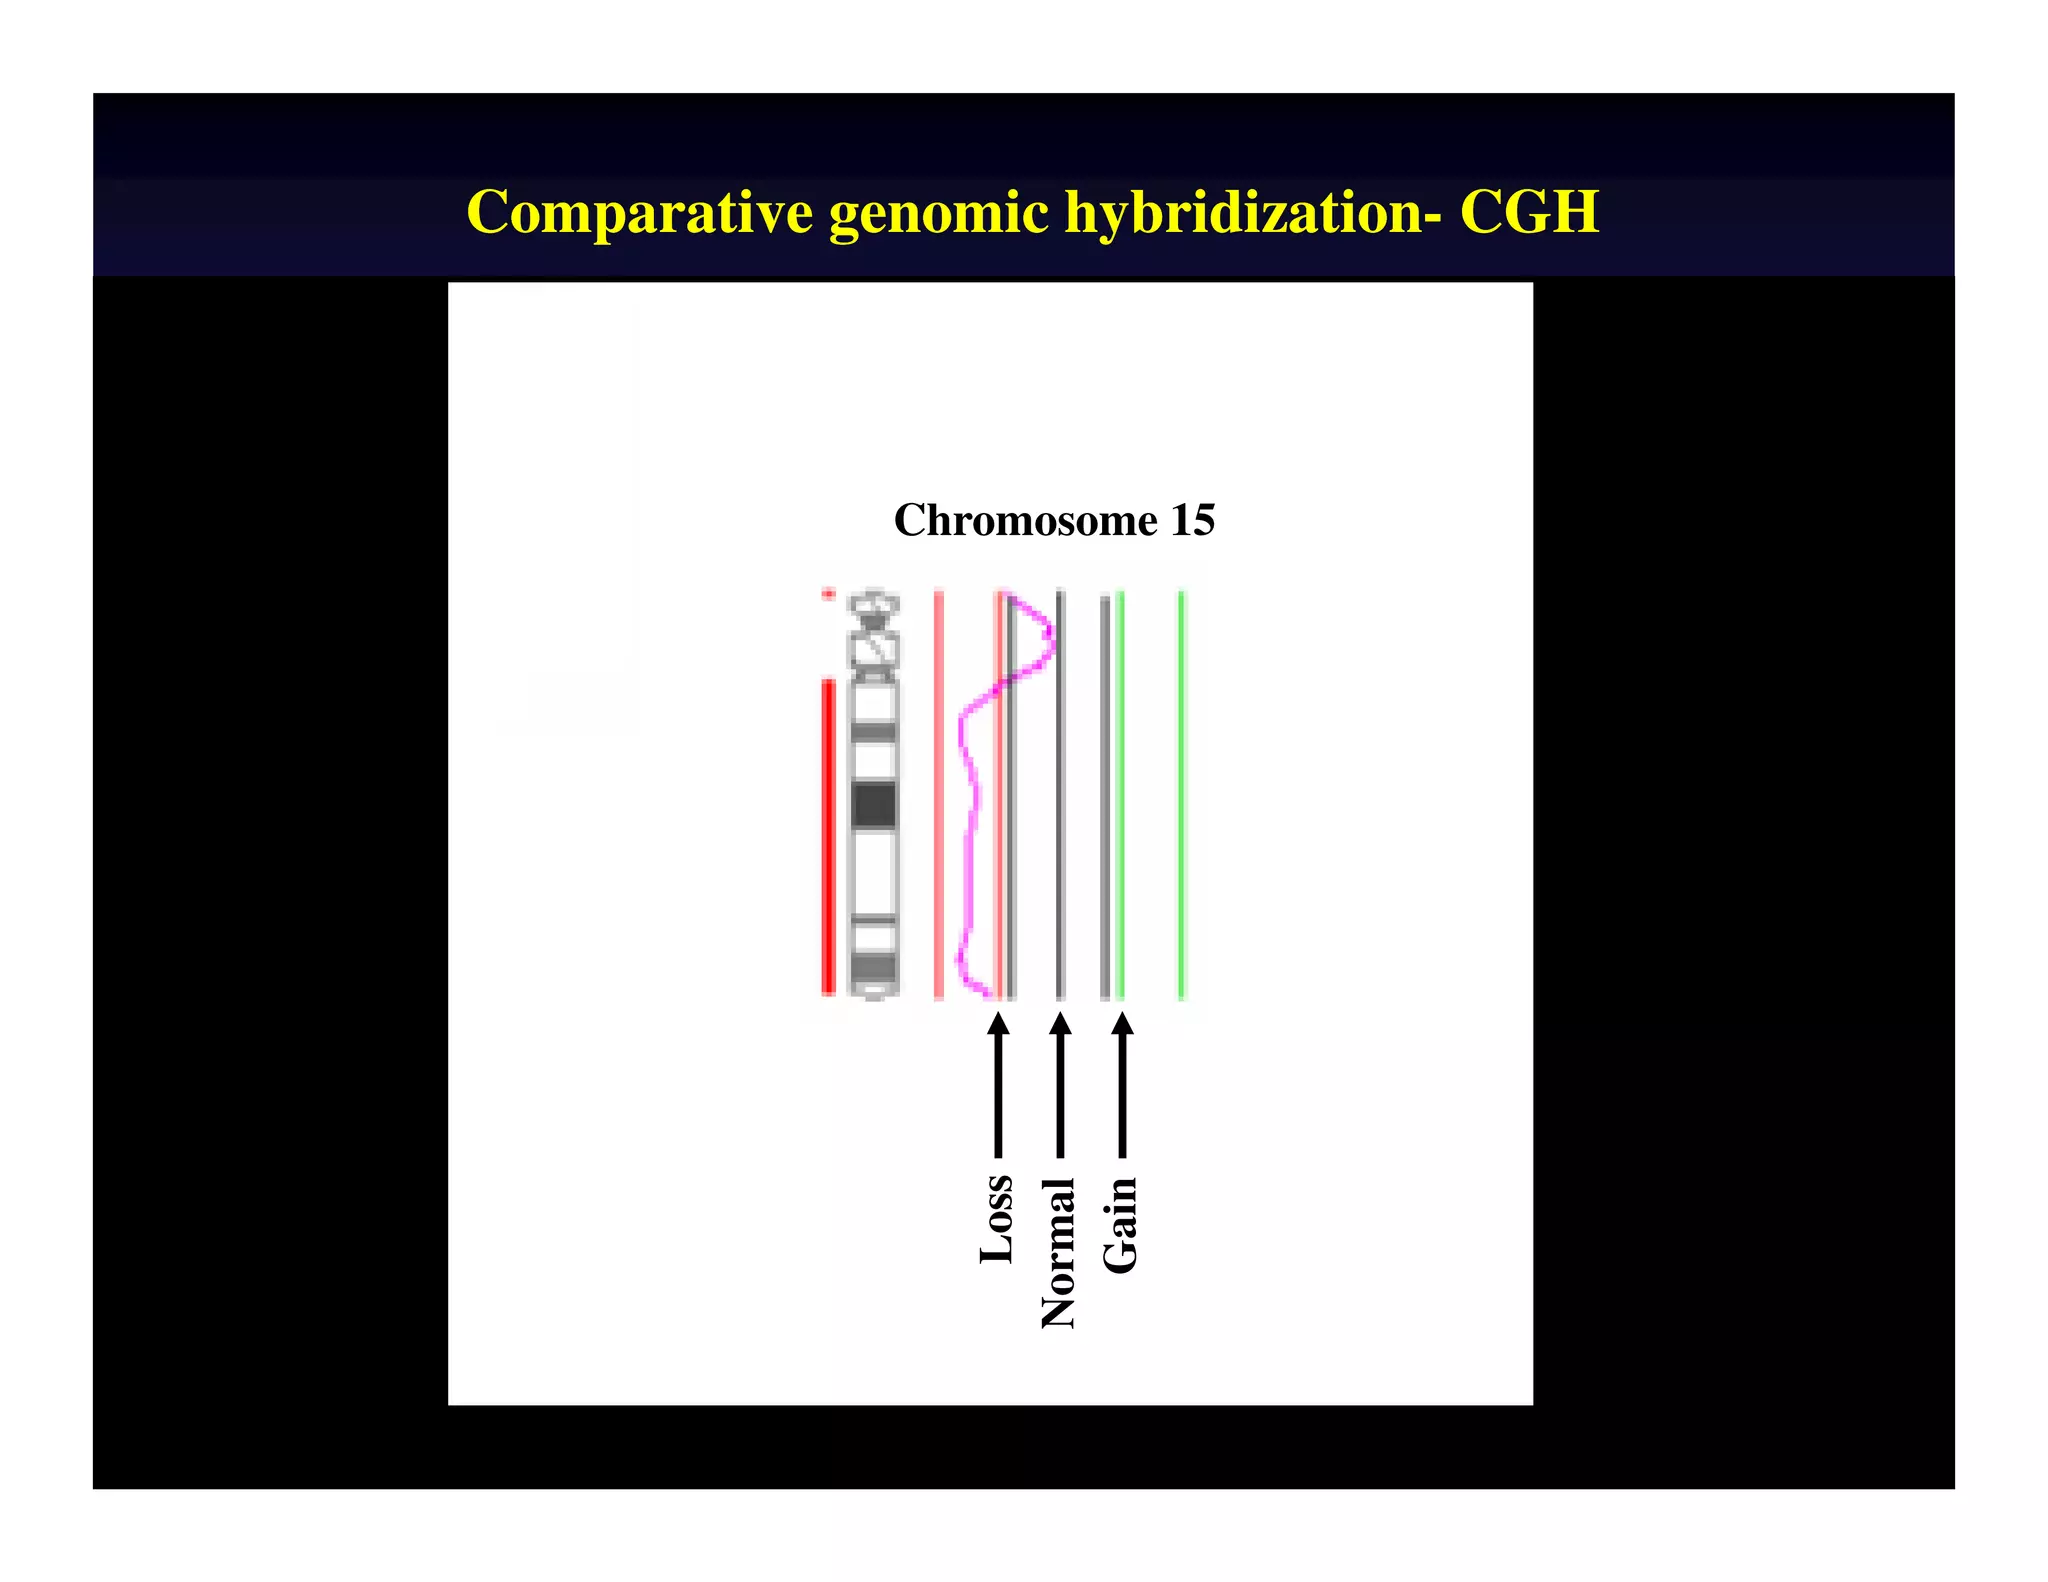
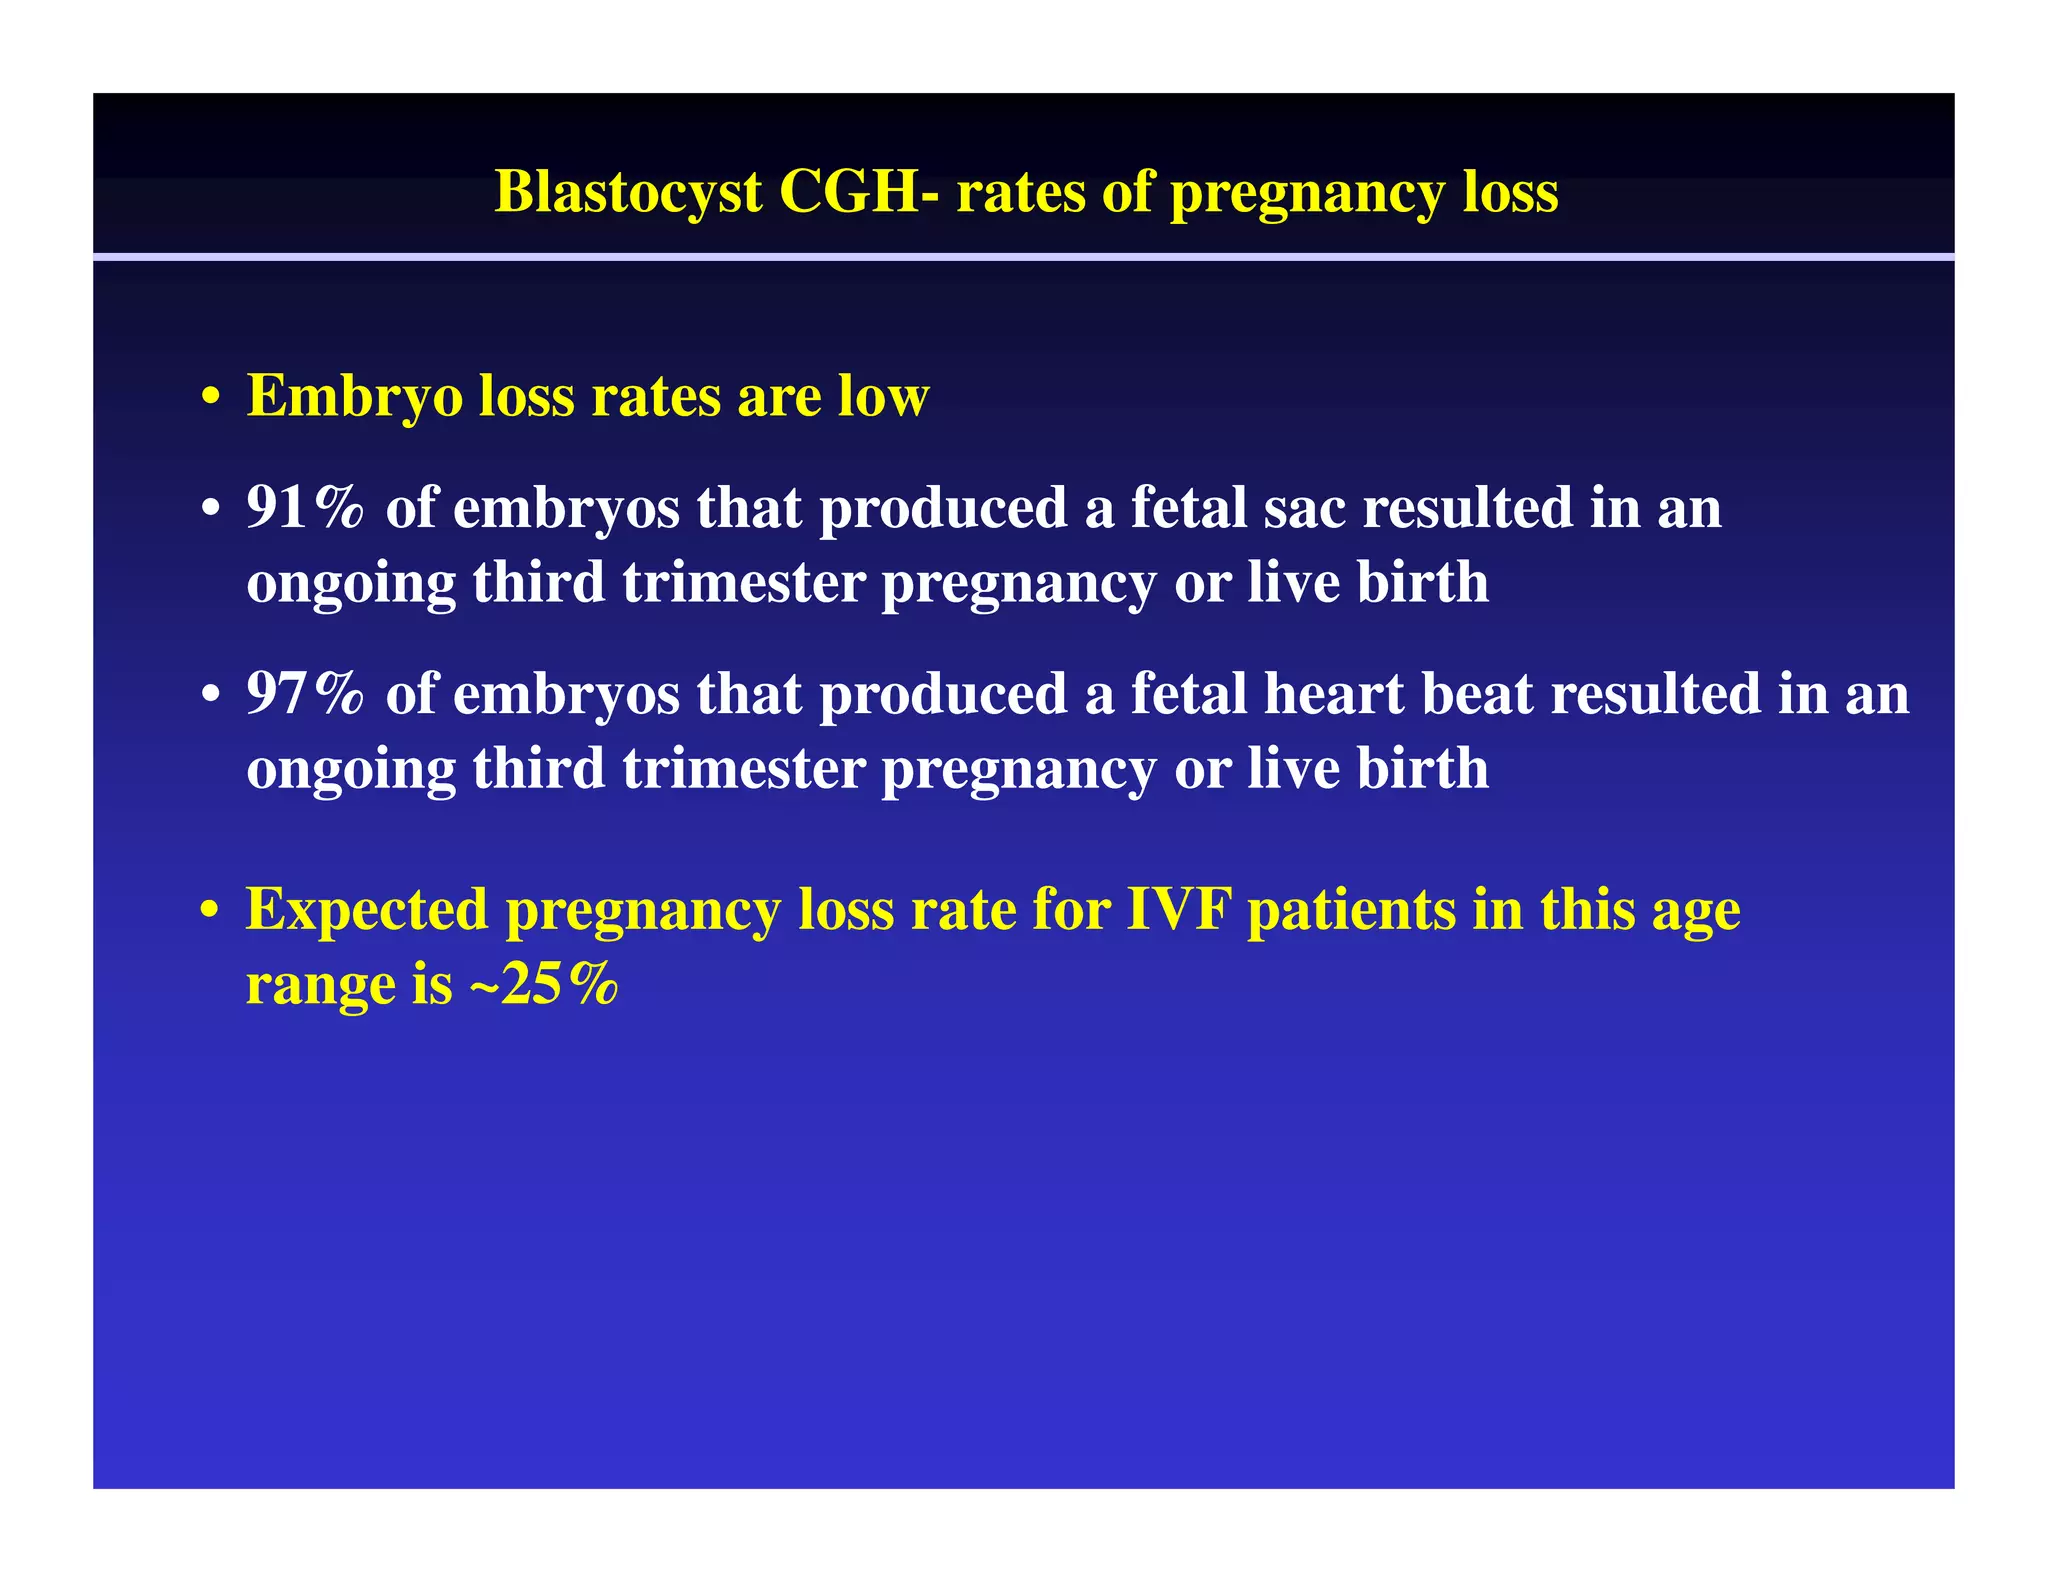
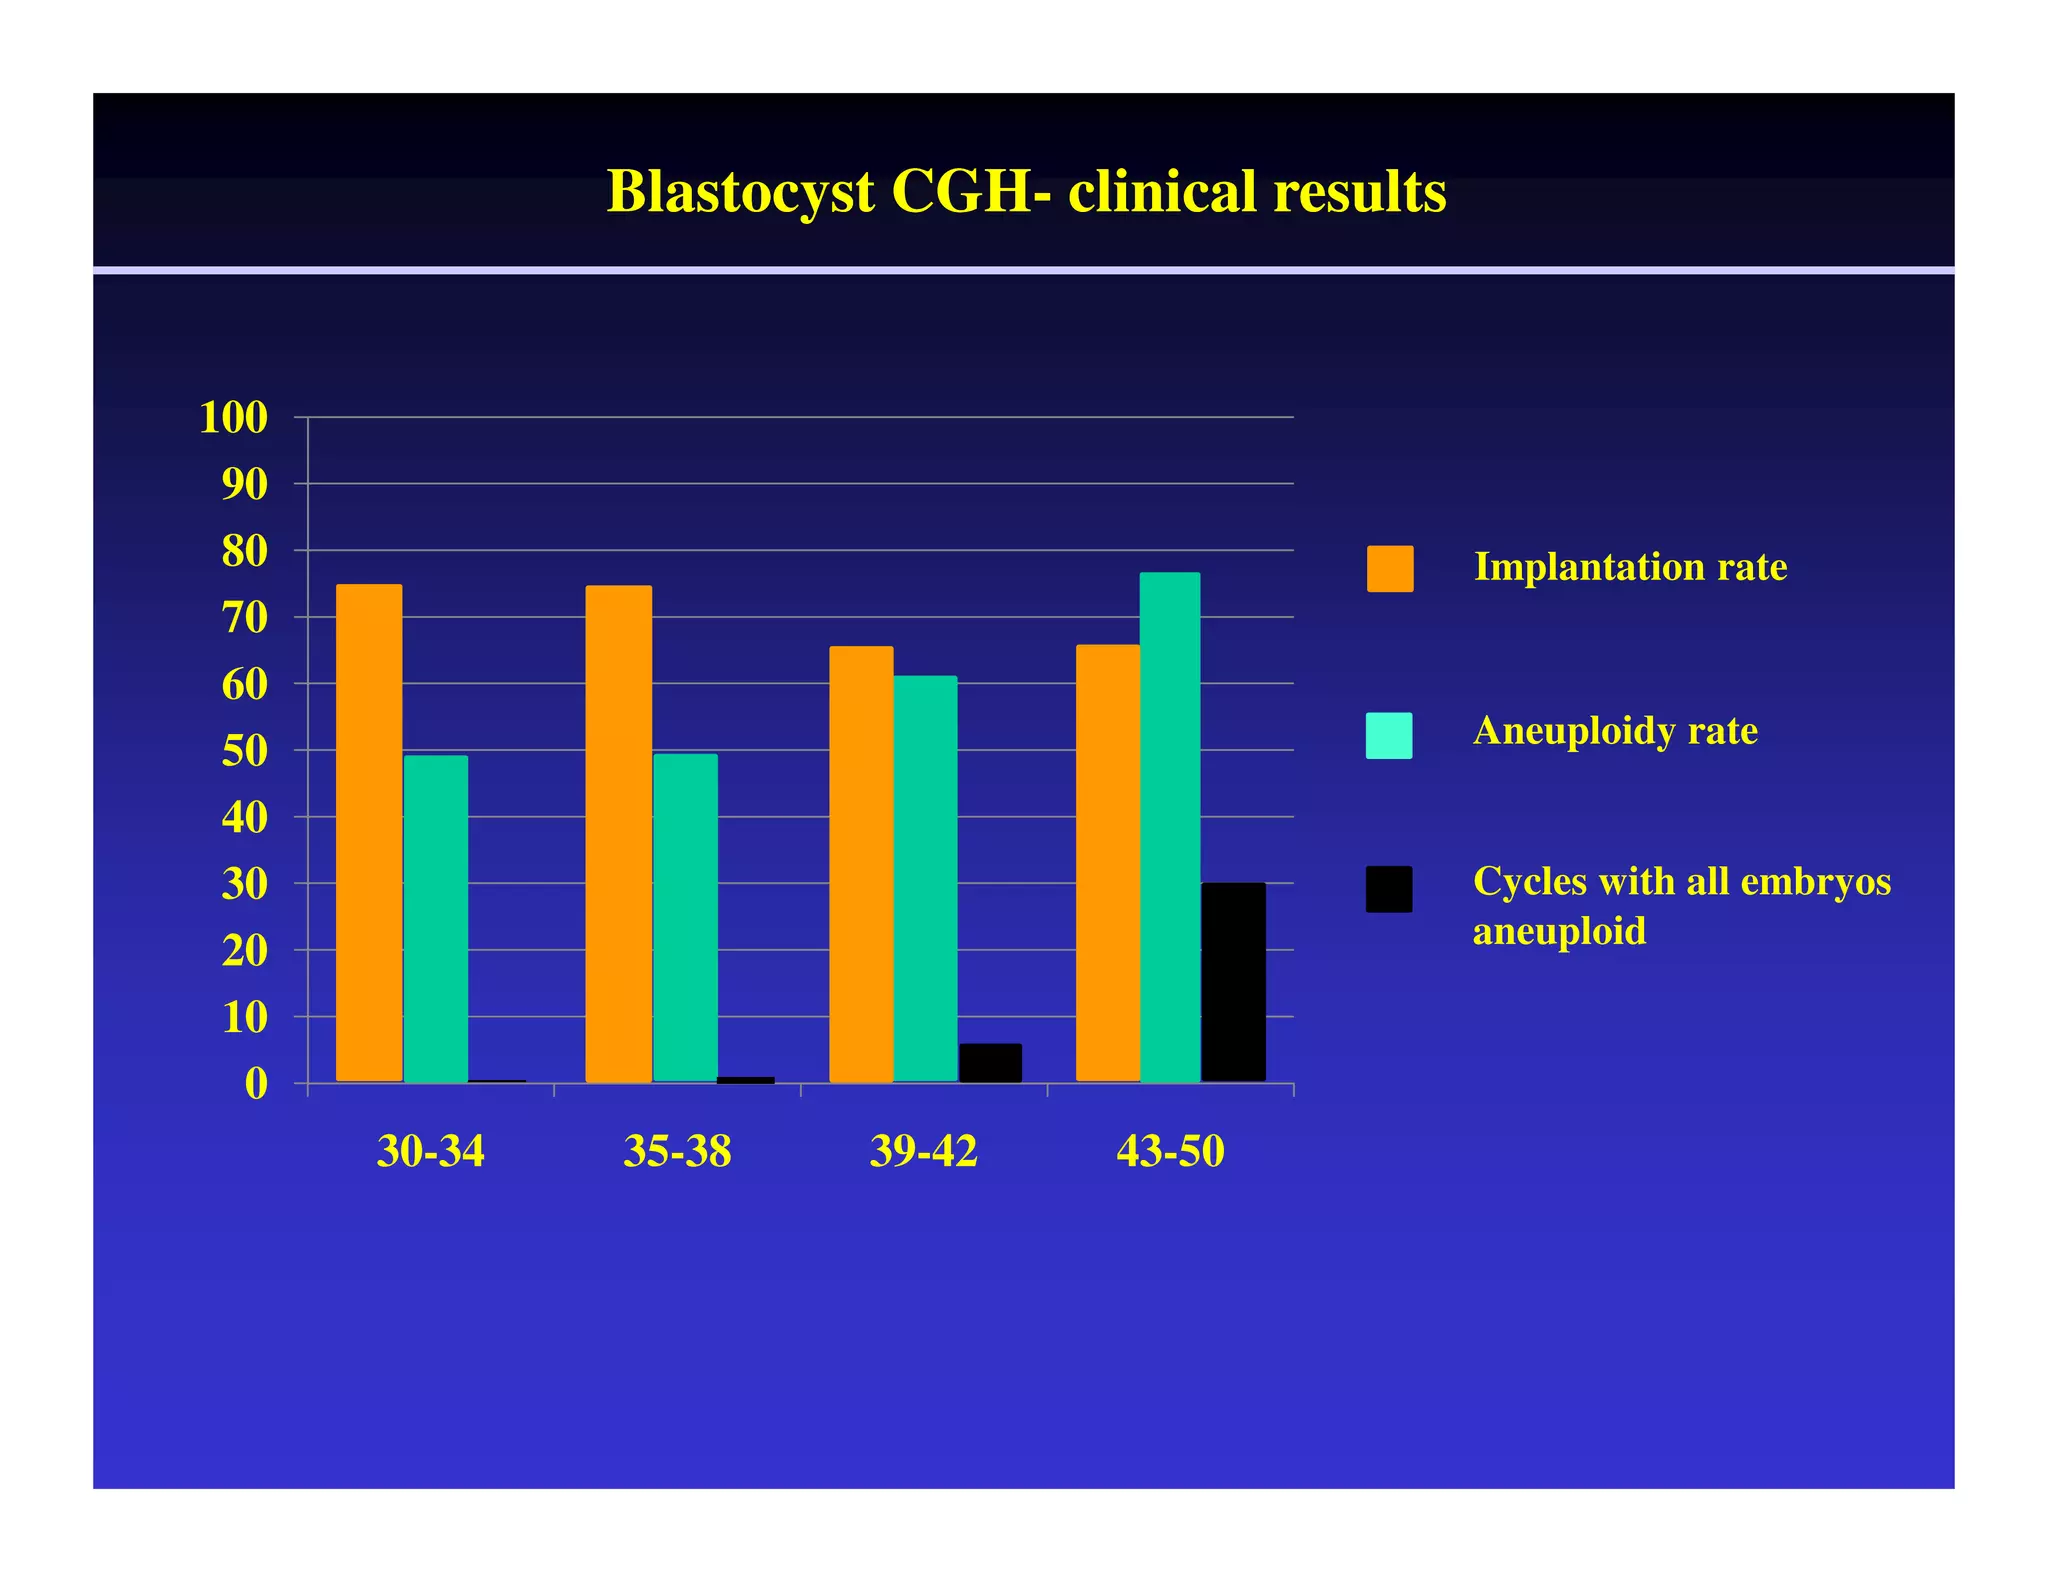
Indications for chromosome screening 
Dagan Wells, PhD, FRCPath 
dagan.wells@obs-gyn.ox.ac.uk
Chromosome imbalance 
(aneuploidy)
Uncontroversial data
The incidence of aneuploidy 
Aneuploidy is extremely common in human oocytes and 
increases with advancing age 
Aneuploidy 
50% 
40% 
30% 
20% 
10% 
20-34 35-39 40-45 Maternal age 
This trend is also reflected in the dramatic increase in Down 
syndrome pregnancies with maternal age
The incidence of aneuploidy 
The high incidence of oocyte aneuploidy has been demonstrated 
using multiple techniques in laboratories worldwide 
Aneuploid oocytes produce embryos abnormal in every cell 
For women over 40 over 50% of cleavage stage embryos are 
chromosomally abnormal in every cell 
What is the impact of aneuploidy?
Aneuploidy and IVF failure 
As aneuploidy increases age, so implantation rate decreases 
Aneuploidy 
50% 
40% 
30% 
Implantation 
20% 
10% 
20-34 35-39 40-45 Maternal age 
~65% of 1st trimester miscarriages are aneuploid
Preimplantation genetic screening (PGS) 
Standard embryo evaluations do not reveal embryos with 
the wrong number of chromosomes 
regular after chromosome 
screening 
or
Preimplantation genetic screening 
Chromosomal indications 
Biopsy 1st round of FISH 2nd round of FISH 
• Theoretical benefits for patients undergoing routine IVF 
Increase embryo implantation/pregnancy rate 
Reduce aneuploid syndromes 
Reduce miscarriage 
NRR
Advanced maternal age
The positive
Reduction in aneuploid 
pregnancies
PGS – reduction in aneuploid pregnancy 
Reduction in aneuploidies 13, 18, 21, XY achieved using PGS 
2.60% 
3.00% 
2.50% 
2.00% 
P<0.001 
0.50% 
1.50% 
1.00% 
0.50% 
From 2,300 cases with follow-up data available, mean age 37 
Munne et al 2006 and Reprogenetics data to 10/2007 
0.00% 
trisomic conceptions 
expected 
observed
PGS – reduction in aneuploid pregnancy 
Are patients interested in PGS for this purpose? 
Recent study of subfertile women (Twisk et al., 2007) 
If PGS was assumed to have no effect on pregnancy rate 
83% of patients would request PGS (75% if 80% detection) 
If PGS was assumed to reduce pregnancy rate from 20% to 14% 
36% of patients would still request PGS 
(31% if 80% detection)
Reduction in miscarriage rate
IVF pregnancy loss and maternal age 
39.4% 
60 
50 
40 
53.3% 
SART-ASRM (2005) 
30 
20 
10 
0 
13.3% 
17.7% 
26.2% 
<35 35-37 38-40 41-42 43-44
Reduction in spontaneous abortion 
Pregnancy loss rates in the general IVF population and after PGD 
Age: 35-40 >40 
IVF population* 19% 41% 
PGD** 14% 22% 
p<0.05 p<0.001 
_________________________________________________________ 
considering pregnancies as the presence of a gestational sac, and pregnancy loss as the 
loss of the whole pregnancy. 
Munne et al., 2006
Increase in pregnancy rates
PGS – live birth rate 
Patients 38-42 
Chromosomes analyzed: XY, 13, 15, 16, 17, 18, 21, 22 
SART data of 5 centers with >10% PGS cases, 2003-2005 
clinic Non-PGS loss live PGS loss live 
cycles rate birth cycles rate birth 
1 505 27% 35% 70 22% 40% 
2 210 36% 14% 72 27% 15% 
3 1204 34% 12% 120 15% 23% 
4 509 29% 15% 236 26% 22% 
5 191 25% 17% 208 16% 25% 
total 2619 30%a 18%b 706 21%a 24%b 
Losses 
a: p<0.01 
reduced 
b: p<0.001 
by ~1/3 
Live births 
increased by 
~1/3 
Munne et al 2007; Colls et al 2007
BUT……. 
Problems with positive PGS studies 
• Not randomized 
• In some cases control groups questionable
The negative
Increase in implantation/pregnancy- controversy 
Implantation rate 
• Mastenbroek et al (2007), NEJM 
• Maternal age >35 
• 8 chromosomes assessed, randomised 
• No significant improvement in implantation
BUT……. 
Problems with negative PGS studies 
• Many patients with <5 embryos included in study (mean 4.8) 
Little selection possible
BUT……. 
Problems with negative PGS studies 
• Many patients with <5 embryos included in study (mean 4.8) 
Little selection possible 
• Many 4-cell embryos biopsied 
Developmental potential drastically reduced
BUT……. 
Problems with negative PGS studies 
• Many patients with <5 embryos included in study (mean 4.8) 
Little selection possible 
• Many 4-cell embryos biopsied 
Developmental potential drastically reduced 
• 20% of tests failed to produce a result 
Literature 6-20 times less failure, little selection possible
BUT……. 
Problems with negative PGS studies 
• Many patients with <5 embryos included in study (mean 4.8) 
Little selection possible 
• Many 4-cell embryos biopsied 
Developmental potential drastically reduced 
• 20% of tests failed to produce a result 
Literature 6-20 times less failure, little selection possible 
• Did not test chromosomes 15 & 22 (only 28% of aneuploidies detected)
Poor selection of chromosome probes 
14 
12 
10 
8 
Percentage of total aneuploidies 
6 
4 
2 
0 
1 2 3 4 5 6 7 8 9 10 11 12 13 14 15 16 17 18 19 20 21 22 XY 
Chromosome
Problems with negative PGS studies 
BUT……. 
• Many patients with <5 embryos included in study (mean 4.8) 
Little selection possible 
• Many 4-cell embryos biopsied 
Developmental potential reduced 
• 20% of tests failed to produce a result 
Literature 6-20 times less failure, little selection possible 
• Did not test chromosomes 15 & 22 (only 28% of aneuploidies detected) 
Many abnormal embryos undetected , little selection possible
Problems with negative PGS studies 
BUT……. 
• Many patients with <5 embryos included in study (mean 4.8) 
Little selection possible 
• Many 4-cell embryos biopsied 
Developmental potential reduced 
• 20% of tests failed to produce a result 
Literature 6-20 times less failure, little selection possible 
• Did not test chromosomes 15 & 22 (only 28% of aneuploidies detected) 
Many abnormal embryos undetected , little selection possible 
• Implantation rate for biopsied, non-diagnosed embryos= 6% 
Developmental potential reduced. Lack of biopsy experience?
Problems with negative PGS studies 
Only 28% of No result 
aneuploidies 
detected 
Critically 
damaged by 
biopsy 
Pool of embryos reduced while little selective advantage has been gained
Legitimate criticisms of traditional PGS methods 
• Current methodologies are not robust, l limiting application 
• Biopsy can have a serious impact if poorly performed 
• Mosaicism will lead to the exclusion of a small number of 
potentially viable embryos 
• No randomized study has proven that PGS is beneficial
Chromosome screening for 
repeated implantation failure 
(RIF)
Screening RIF patients 
So far there is no evidence that PGS improves outcome for 
RIF patients (studies 1-5) 
1: Gianaroli et al. 1999 
2: Kahraman et al. 2000 
3: Munné et al., RBO 2003 
4: Pehlivan et al. 2002 
5: Werlin et al. 2003 
Aneuploid rate in one cycle is usually highly predictive of 
aneuploidy rate in the next 
PGS may help patients with 100% abnormal results to 
consider alternative options such as gamete donation
Chromosome screening for 
patients with previous trisomic 
conception
Patients (<35 years) with previous trisomic conception 
CHROMOSOME ABNORMALITIES: 
Aneuploidy rate 
Patients with previous trisomy 41% 
Control 19% 
P<0.001 
IMPLANTATION RATE: 
% pregnancy implantation 
Patients with PGS 57% 50% 
Controls 43% 22% 
P<0.025 
Munne et al. 2004b
Chromosome screening for 
recurrent pregnancy loss 
(RPL)
Patients with recurrent pregnancy loss 
Controlled studies on idiopathic RPL : 
• Werlin L, et al. (2003) Preimplantation genetic diagnosis (PGD) as both a therapeutic and 
diagnostic tool in assisted reproductive technology. Fertil Steril, 80:467 
• Munné et al. (2005) Preimplantation genetic diagnosis reduces pregnancy loss in women 35 
and older with a history of recurrent miscarriages. Fertil Steril 84:331 
• Munné et al. (2006) PGD for recurrent pregnancy loss can be effective in all age 
groups. Abstract PGDIS 
• Garrisi et al. (2008) Preimplantation genetic diagnosis (PGD) effectively reduces 
idiopathic recurrent pregnancy loss (RPL) among patients with up to 5 previous 
consecutive miscarriages after natural conceptions. Fertil. Steril in press 
• Rubio et al. (in press) Prognosis factors for Preimplantation Genetic Screening 
in repeated pregnancy loss. Reprod Biomed Online, in press 
All show a decrease in miscarriage rate
N=122 
With 3 
previous 
losses 
44% 
94% 
85% 
89% 
** 
* 
Patients with recurrent pregnancy loss 
33% 
8% 
16% 
39% 
12% 
P0.05 P0.001 P0.001 
*Munné et al. 2005 and unpublished data, **Brigham et al. 1999
Future developments
Limitations of conventional embryo screening techniques 
Cells are in interphase 
- use FISH 
Limited range of fluorochromes 
Less than half the chromosomes tested 
Spreading requires skill and can be inconsistent 
Mosaicism Poses a significant problem for diagnosis. 
However, most mosaic cleavage stage 
embryos are aneuploid in every cell. 
Cleavage stage biopsy may represent a cost to the 
embryo
Comparative genomic hybridization- CGH 
• Technique related to FISH 
• Allows the copy number of every chromosome to be determined 
Chromosome 15 
Test DNA Normal DNA 
Normal Trisomy Monosomy 
Gain 
Loss 
Normal 
Kallioniemi et al 1992; 
Wells et al 1999, 2002; Voullaire et al 1999; Wilton et al 2001; Gutierrez et al 2004, 2005; Fragouli et al 2006, 2007
Embryo screening using CGH 
Benefits 
• All chromosomes tested 
• No spreading of cells on slides 
But what about mosaicism and the impact of biopsy?
Comprehensive chromosome screening of blastocysts 
Analysis of blastocyst stage 
• Biopsy of several cells is possible 
Diagnosis more robust and accurate 
Less risk of misdiagnosis due to mosaicism 
Reduced impact of embryo biopsy 
• Blastocyst cryopreservation (vitrification) necessary 
• Can overcoming the principal challenges to accurate screening 
allow PGS to fulfill the potential predicted by theory?
• 170 patients, mean age 38 years, 1-6 previous failed IVF cycles 
(mean 2) 
•Near 100% survival after biopsy, freeze and thaw 
• Pregnancy rate per cycle with transfer 87% 
• 
Blastocyst CGH- clinical results 
72% 
Birth rate per cycle with transfer 79% 
• Implantation rate per embryo 67% 
60% 
28% * 
Control group matched for: maternal age, day-3 FSH, day of transfer, # oocytes 
retrieved, # of failed cycles 
*p0.0003 - Extremely promising for single embryo transfer
Blastocyst CGH- rates of pregnancy loss 
• Embryo loss rates are low 
• 91% of embryos that produced a fetal sac resulted in an 
ongoing third trimester pregnancy or live birth 
• 97% of embryos that produced a fetal heart beat resulted in an 
ongoing third trimester pregnancy or live birth 
• Expected pregnancy loss rate for IVF patients in this age 
range is ~25%
Blastocyst CGH- clinical results 
100 
90 
80 
70 
60 
50 
40 
Implantation rate 
Aneuploidy rate 
30 
20 
10 
0 
30-34 35-38 39-42 43-50 
Cycles with all embryos 
aneuploid
Questions 
• Can the results obtained in the current study be replicated in a randomized 
controlled trial? 
• How much of the observed benefit is due to transfer in a subsequent cycle? 
• Aneuploidy explains most of the decline in IVF success with advancing 
maternal age. What explains the remainder? 
• What patient groups will benefit the most from this type of screening?
United Kingdom (Oxford) 
Elpida Fragouli 
Samer Alfarawati 
United States (Livingston, NJ) 
Pere Colls 
Tomas Escudero 
Colorado Center for 
Reproductive Medicine 
Mandy Katz-Jaffe 
John Stevens 
Bill Schoolcraft 
N-neka Esprit-Ngachou 
Jill Fischer 
Cristina Gutierrez-Mateo 
Santiago Munne 
Renata Prates 
Jorge Sanchez 
Sophia Tormasi 
John Zheng 
Dagan.Wells@obs-gyn.ox.ac.uk

Dagan wells (1)

  • 1.
    Indications for chromosomescreening Dagan Wells, PhD, FRCPath dagan.wells@obs-gyn.ox.ac.uk
  • 2.
  • 3.
  • 4.
    The incidence ofaneuploidy Aneuploidy is extremely common in human oocytes and increases with advancing age Aneuploidy 50% 40% 30% 20% 10% 20-34 35-39 40-45 Maternal age This trend is also reflected in the dramatic increase in Down syndrome pregnancies with maternal age
  • 5.
    The incidence ofaneuploidy The high incidence of oocyte aneuploidy has been demonstrated using multiple techniques in laboratories worldwide Aneuploid oocytes produce embryos abnormal in every cell For women over 40 over 50% of cleavage stage embryos are chromosomally abnormal in every cell What is the impact of aneuploidy?
  • 6.
    Aneuploidy and IVFfailure As aneuploidy increases age, so implantation rate decreases Aneuploidy 50% 40% 30% Implantation 20% 10% 20-34 35-39 40-45 Maternal age ~65% of 1st trimester miscarriages are aneuploid
  • 7.
    Preimplantation genetic screening(PGS) Standard embryo evaluations do not reveal embryos with the wrong number of chromosomes regular after chromosome screening or
  • 8.
    Preimplantation genetic screening Chromosomal indications Biopsy 1st round of FISH 2nd round of FISH • Theoretical benefits for patients undergoing routine IVF Increase embryo implantation/pregnancy rate Reduce aneuploid syndromes Reduce miscarriage NRR
  • 9.
  • 10.
  • 11.
  • 12.
    PGS – reductionin aneuploid pregnancy Reduction in aneuploidies 13, 18, 21, XY achieved using PGS 2.60% 3.00% 2.50% 2.00% P<0.001 0.50% 1.50% 1.00% 0.50% From 2,300 cases with follow-up data available, mean age 37 Munne et al 2006 and Reprogenetics data to 10/2007 0.00% trisomic conceptions expected observed
  • 13.
    PGS – reductionin aneuploid pregnancy Are patients interested in PGS for this purpose? Recent study of subfertile women (Twisk et al., 2007) If PGS was assumed to have no effect on pregnancy rate 83% of patients would request PGS (75% if 80% detection) If PGS was assumed to reduce pregnancy rate from 20% to 14% 36% of patients would still request PGS (31% if 80% detection)
  • 14.
  • 15.
    IVF pregnancy lossand maternal age 39.4% 60 50 40 53.3% SART-ASRM (2005) 30 20 10 0 13.3% 17.7% 26.2% <35 35-37 38-40 41-42 43-44
  • 16.
    Reduction in spontaneousabortion Pregnancy loss rates in the general IVF population and after PGD Age: 35-40 >40 IVF population* 19% 41% PGD** 14% 22% p<0.05 p<0.001 _________________________________________________________ considering pregnancies as the presence of a gestational sac, and pregnancy loss as the loss of the whole pregnancy. Munne et al., 2006
  • 17.
  • 18.
    PGS – livebirth rate Patients 38-42 Chromosomes analyzed: XY, 13, 15, 16, 17, 18, 21, 22 SART data of 5 centers with >10% PGS cases, 2003-2005 clinic Non-PGS loss live PGS loss live cycles rate birth cycles rate birth 1 505 27% 35% 70 22% 40% 2 210 36% 14% 72 27% 15% 3 1204 34% 12% 120 15% 23% 4 509 29% 15% 236 26% 22% 5 191 25% 17% 208 16% 25% total 2619 30%a 18%b 706 21%a 24%b Losses a: p<0.01 reduced b: p<0.001 by ~1/3 Live births increased by ~1/3 Munne et al 2007; Colls et al 2007
  • 19.
    BUT……. Problems withpositive PGS studies • Not randomized • In some cases control groups questionable
  • 20.
  • 21.
    Increase in implantation/pregnancy-controversy Implantation rate • Mastenbroek et al (2007), NEJM • Maternal age >35 • 8 chromosomes assessed, randomised • No significant improvement in implantation
  • 22.
    BUT……. Problems withnegative PGS studies • Many patients with <5 embryos included in study (mean 4.8) Little selection possible
  • 23.
    BUT……. Problems withnegative PGS studies • Many patients with <5 embryos included in study (mean 4.8) Little selection possible • Many 4-cell embryos biopsied Developmental potential drastically reduced
  • 24.
    BUT……. Problems withnegative PGS studies • Many patients with <5 embryos included in study (mean 4.8) Little selection possible • Many 4-cell embryos biopsied Developmental potential drastically reduced • 20% of tests failed to produce a result Literature 6-20 times less failure, little selection possible
  • 25.
    BUT……. Problems withnegative PGS studies • Many patients with <5 embryos included in study (mean 4.8) Little selection possible • Many 4-cell embryos biopsied Developmental potential drastically reduced • 20% of tests failed to produce a result Literature 6-20 times less failure, little selection possible • Did not test chromosomes 15 & 22 (only 28% of aneuploidies detected)
  • 26.
    Poor selection ofchromosome probes 14 12 10 8 Percentage of total aneuploidies 6 4 2 0 1 2 3 4 5 6 7 8 9 10 11 12 13 14 15 16 17 18 19 20 21 22 XY Chromosome
  • 27.
    Problems with negativePGS studies BUT……. • Many patients with <5 embryos included in study (mean 4.8) Little selection possible • Many 4-cell embryos biopsied Developmental potential reduced • 20% of tests failed to produce a result Literature 6-20 times less failure, little selection possible • Did not test chromosomes 15 & 22 (only 28% of aneuploidies detected) Many abnormal embryos undetected , little selection possible
  • 28.
    Problems with negativePGS studies BUT……. • Many patients with <5 embryos included in study (mean 4.8) Little selection possible • Many 4-cell embryos biopsied Developmental potential reduced • 20% of tests failed to produce a result Literature 6-20 times less failure, little selection possible • Did not test chromosomes 15 & 22 (only 28% of aneuploidies detected) Many abnormal embryos undetected , little selection possible • Implantation rate for biopsied, non-diagnosed embryos= 6% Developmental potential reduced. Lack of biopsy experience?
  • 29.
    Problems with negativePGS studies Only 28% of No result aneuploidies detected Critically damaged by biopsy Pool of embryos reduced while little selective advantage has been gained
  • 30.
    Legitimate criticisms oftraditional PGS methods • Current methodologies are not robust, l limiting application • Biopsy can have a serious impact if poorly performed • Mosaicism will lead to the exclusion of a small number of potentially viable embryos • No randomized study has proven that PGS is beneficial
  • 31.
    Chromosome screening for repeated implantation failure (RIF)
  • 32.
    Screening RIF patients So far there is no evidence that PGS improves outcome for RIF patients (studies 1-5) 1: Gianaroli et al. 1999 2: Kahraman et al. 2000 3: Munné et al., RBO 2003 4: Pehlivan et al. 2002 5: Werlin et al. 2003 Aneuploid rate in one cycle is usually highly predictive of aneuploidy rate in the next PGS may help patients with 100% abnormal results to consider alternative options such as gamete donation
  • 33.
    Chromosome screening for patients with previous trisomic conception
  • 34.
    Patients (<35 years)with previous trisomic conception CHROMOSOME ABNORMALITIES: Aneuploidy rate Patients with previous trisomy 41% Control 19% P<0.001 IMPLANTATION RATE: % pregnancy implantation Patients with PGS 57% 50% Controls 43% 22% P<0.025 Munne et al. 2004b
  • 35.
    Chromosome screening for recurrent pregnancy loss (RPL)
  • 36.
    Patients with recurrentpregnancy loss Controlled studies on idiopathic RPL : • Werlin L, et al. (2003) Preimplantation genetic diagnosis (PGD) as both a therapeutic and diagnostic tool in assisted reproductive technology. Fertil Steril, 80:467 • Munné et al. (2005) Preimplantation genetic diagnosis reduces pregnancy loss in women 35 and older with a history of recurrent miscarriages. Fertil Steril 84:331 • Munné et al. (2006) PGD for recurrent pregnancy loss can be effective in all age groups. Abstract PGDIS • Garrisi et al. (2008) Preimplantation genetic diagnosis (PGD) effectively reduces idiopathic recurrent pregnancy loss (RPL) among patients with up to 5 previous consecutive miscarriages after natural conceptions. Fertil. Steril in press • Rubio et al. (in press) Prognosis factors for Preimplantation Genetic Screening in repeated pregnancy loss. Reprod Biomed Online, in press All show a decrease in miscarriage rate
  • 37.
    N=122 With 3 previous losses 44% 94% 85% 89% ** * Patients with recurrent pregnancy loss 33% 8% 16% 39% 12% P0.05 P0.001 P0.001 *Munné et al. 2005 and unpublished data, **Brigham et al. 1999
  • 38.
  • 39.
    Limitations of conventionalembryo screening techniques Cells are in interphase - use FISH Limited range of fluorochromes Less than half the chromosomes tested Spreading requires skill and can be inconsistent Mosaicism Poses a significant problem for diagnosis. However, most mosaic cleavage stage embryos are aneuploid in every cell. Cleavage stage biopsy may represent a cost to the embryo
  • 40.
    Comparative genomic hybridization-CGH • Technique related to FISH • Allows the copy number of every chromosome to be determined Chromosome 15 Test DNA Normal DNA Normal Trisomy Monosomy Gain Loss Normal Kallioniemi et al 1992; Wells et al 1999, 2002; Voullaire et al 1999; Wilton et al 2001; Gutierrez et al 2004, 2005; Fragouli et al 2006, 2007
  • 41.
    Embryo screening usingCGH Benefits • All chromosomes tested • No spreading of cells on slides But what about mosaicism and the impact of biopsy?
  • 42.
    Comprehensive chromosome screeningof blastocysts Analysis of blastocyst stage • Biopsy of several cells is possible Diagnosis more robust and accurate Less risk of misdiagnosis due to mosaicism Reduced impact of embryo biopsy • Blastocyst cryopreservation (vitrification) necessary • Can overcoming the principal challenges to accurate screening allow PGS to fulfill the potential predicted by theory?
  • 43.
    • 170 patients,mean age 38 years, 1-6 previous failed IVF cycles (mean 2) •Near 100% survival after biopsy, freeze and thaw • Pregnancy rate per cycle with transfer 87% • Blastocyst CGH- clinical results 72% Birth rate per cycle with transfer 79% • Implantation rate per embryo 67% 60% 28% * Control group matched for: maternal age, day-3 FSH, day of transfer, # oocytes retrieved, # of failed cycles *p0.0003 - Extremely promising for single embryo transfer
  • 44.
    Blastocyst CGH- ratesof pregnancy loss • Embryo loss rates are low • 91% of embryos that produced a fetal sac resulted in an ongoing third trimester pregnancy or live birth • 97% of embryos that produced a fetal heart beat resulted in an ongoing third trimester pregnancy or live birth • Expected pregnancy loss rate for IVF patients in this age range is ~25%
  • 45.
    Blastocyst CGH- clinicalresults 100 90 80 70 60 50 40 Implantation rate Aneuploidy rate 30 20 10 0 30-34 35-38 39-42 43-50 Cycles with all embryos aneuploid
  • 46.
    Questions • Canthe results obtained in the current study be replicated in a randomized controlled trial? • How much of the observed benefit is due to transfer in a subsequent cycle? • Aneuploidy explains most of the decline in IVF success with advancing maternal age. What explains the remainder? • What patient groups will benefit the most from this type of screening?
  • 47.
    United Kingdom (Oxford) Elpida Fragouli Samer Alfarawati United States (Livingston, NJ) Pere Colls Tomas Escudero Colorado Center for Reproductive Medicine Mandy Katz-Jaffe John Stevens Bill Schoolcraft N-neka Esprit-Ngachou Jill Fischer Cristina Gutierrez-Mateo Santiago Munne Renata Prates Jorge Sanchez Sophia Tormasi John Zheng Dagan.Wells@obs-gyn.ox.ac.uk