Download as PPSX, PPTX

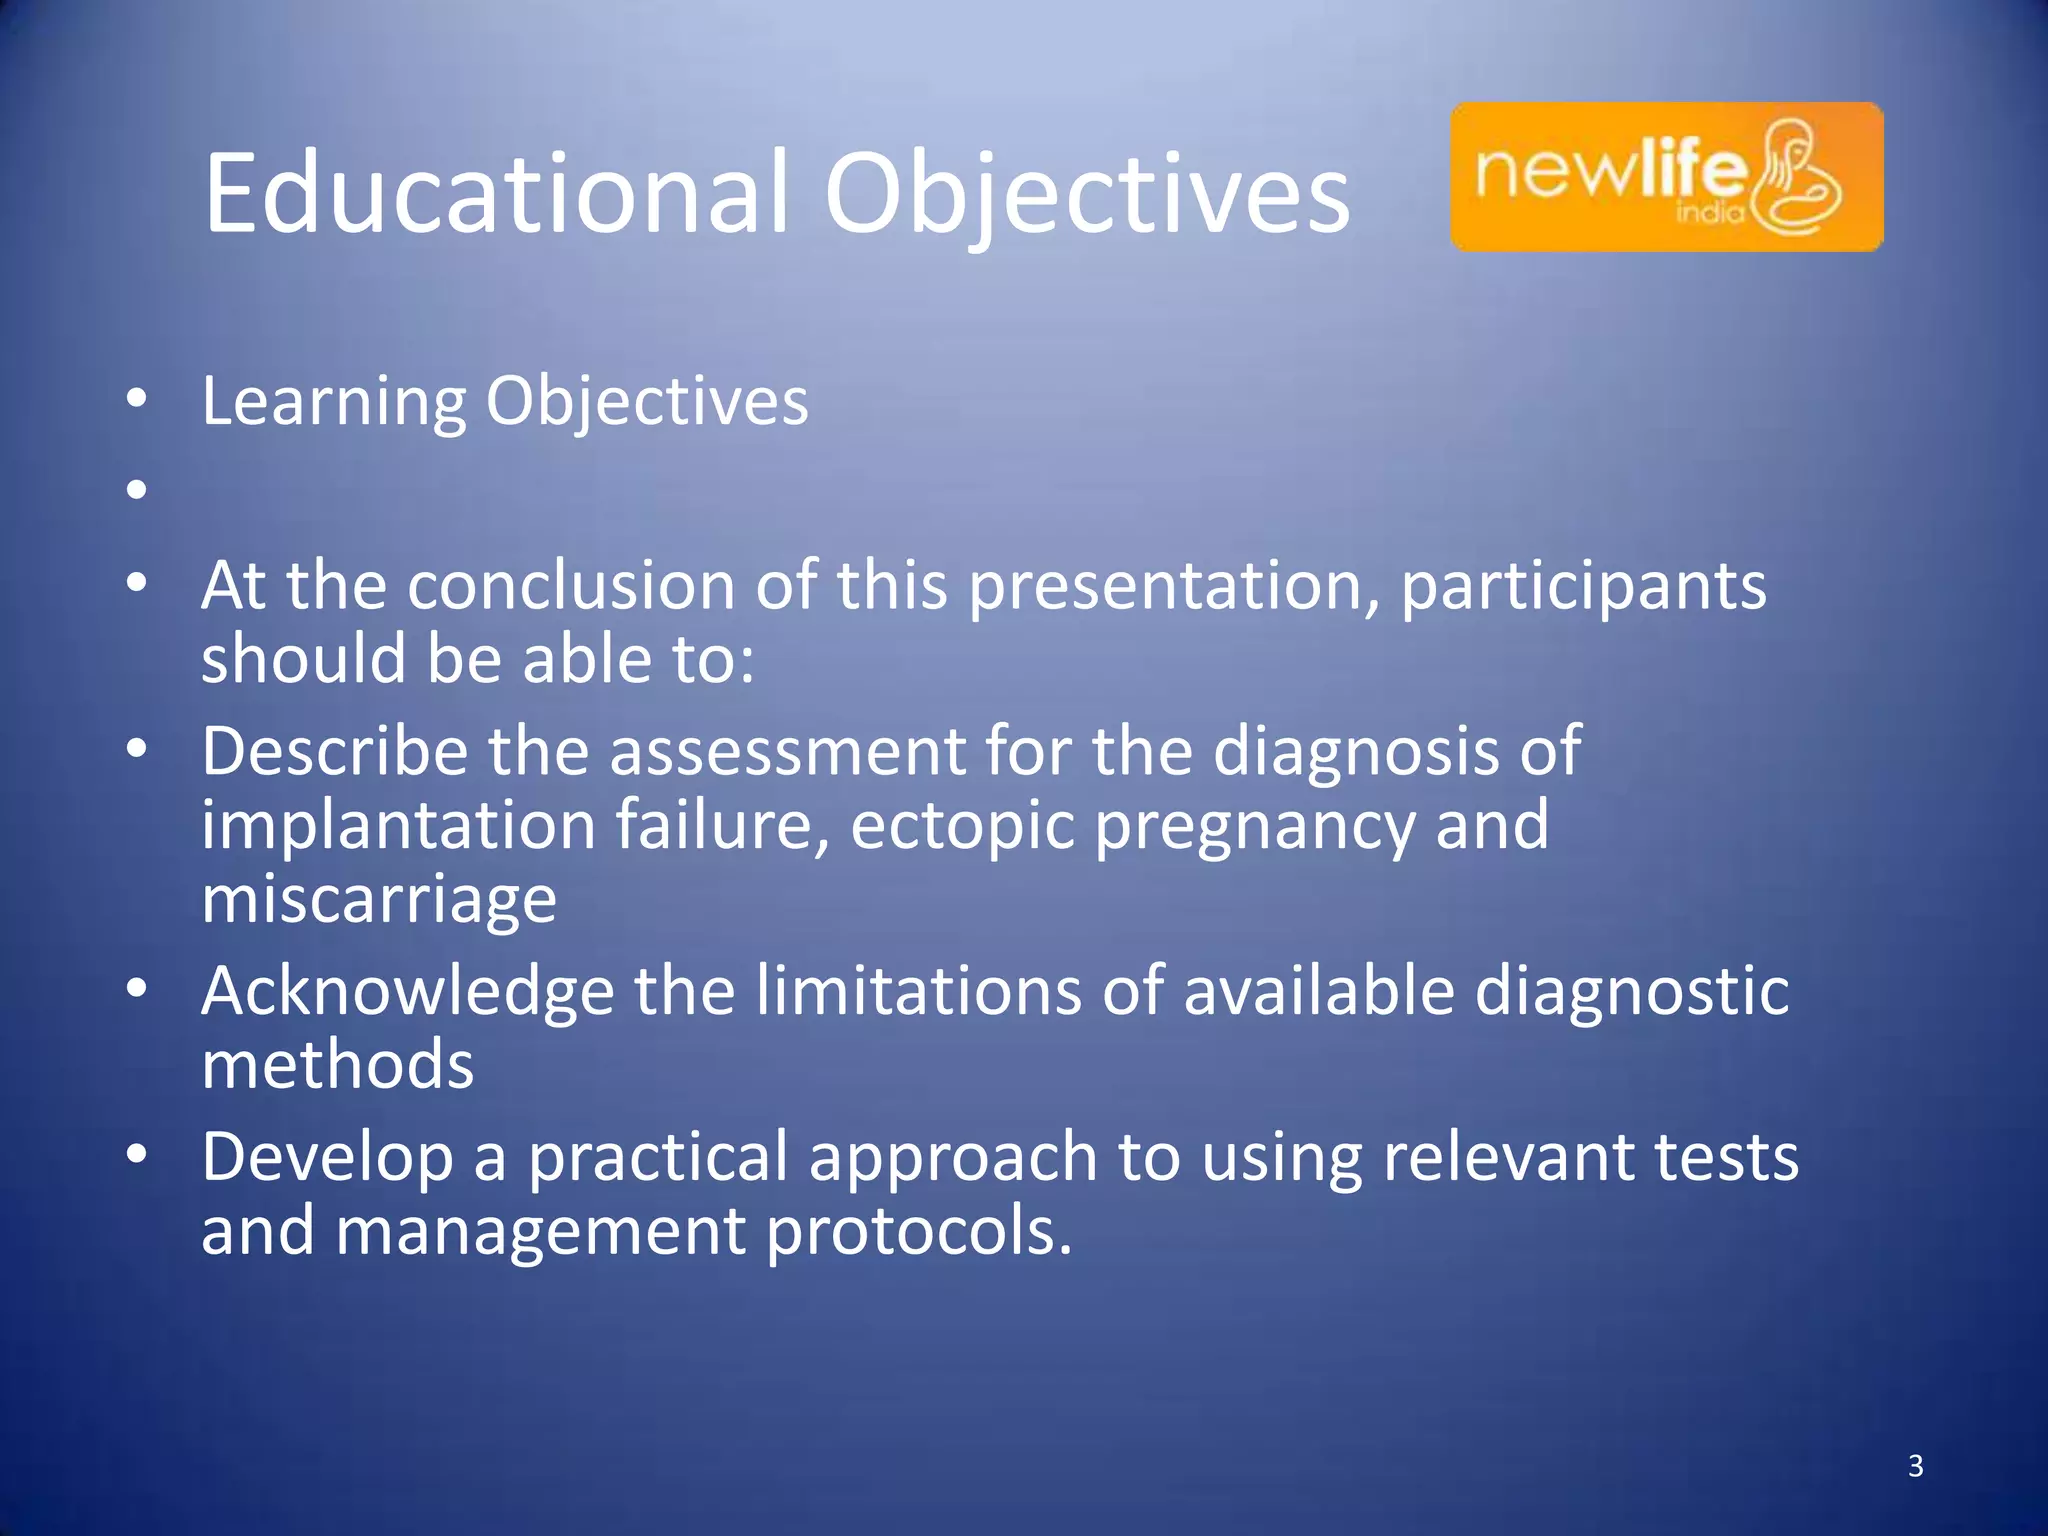

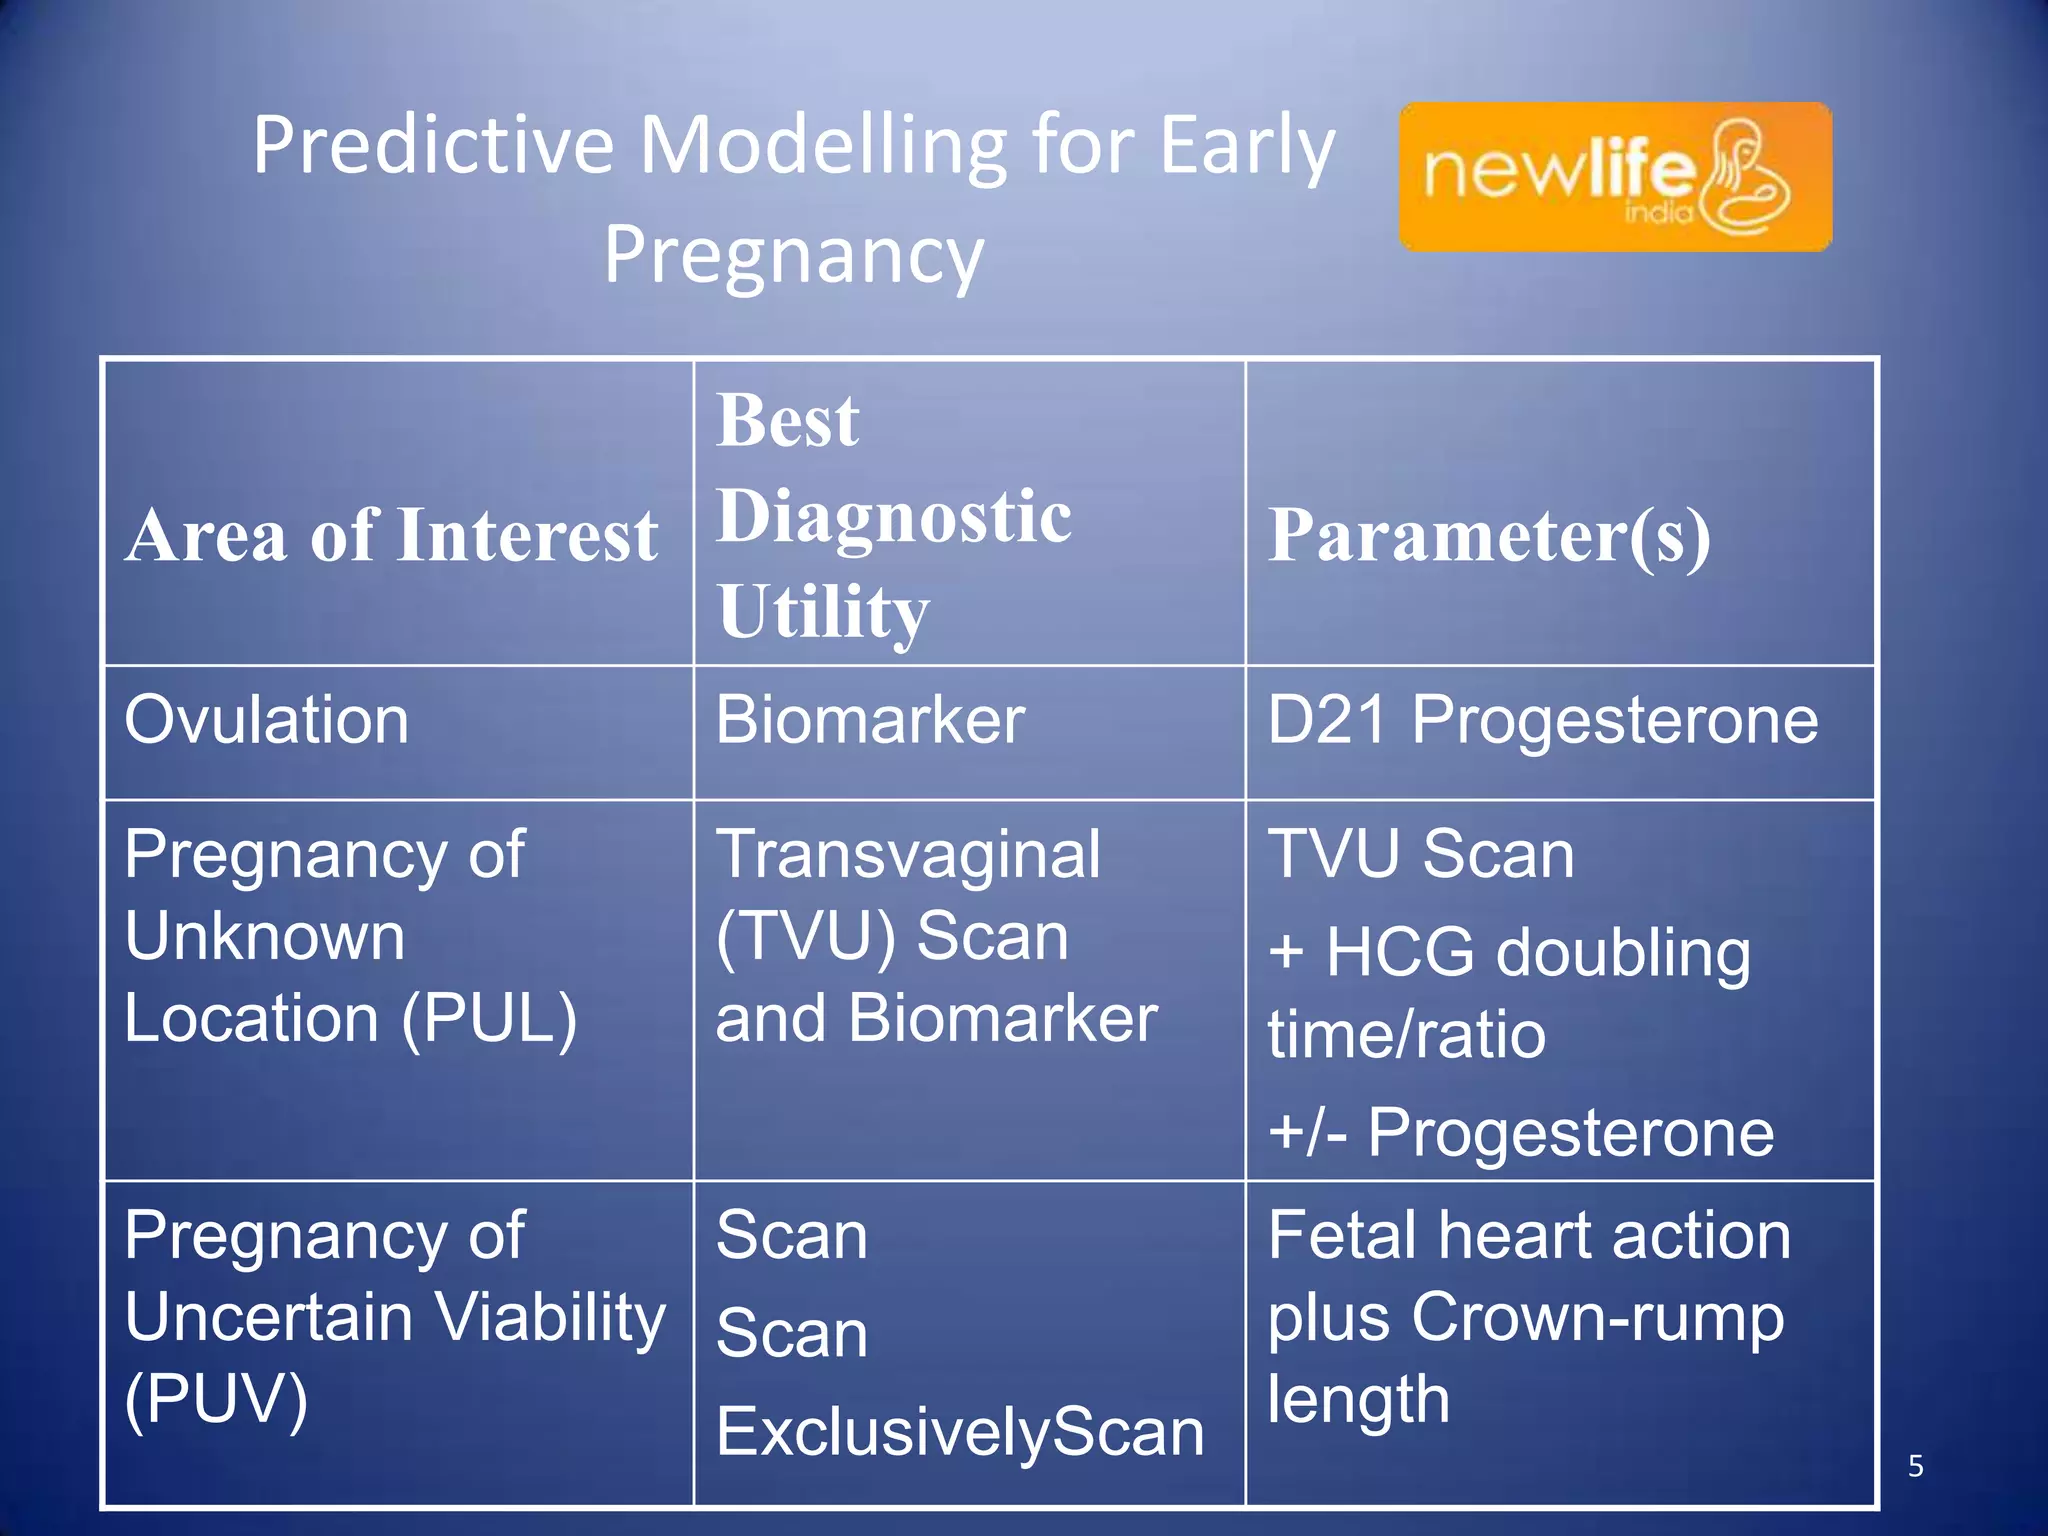
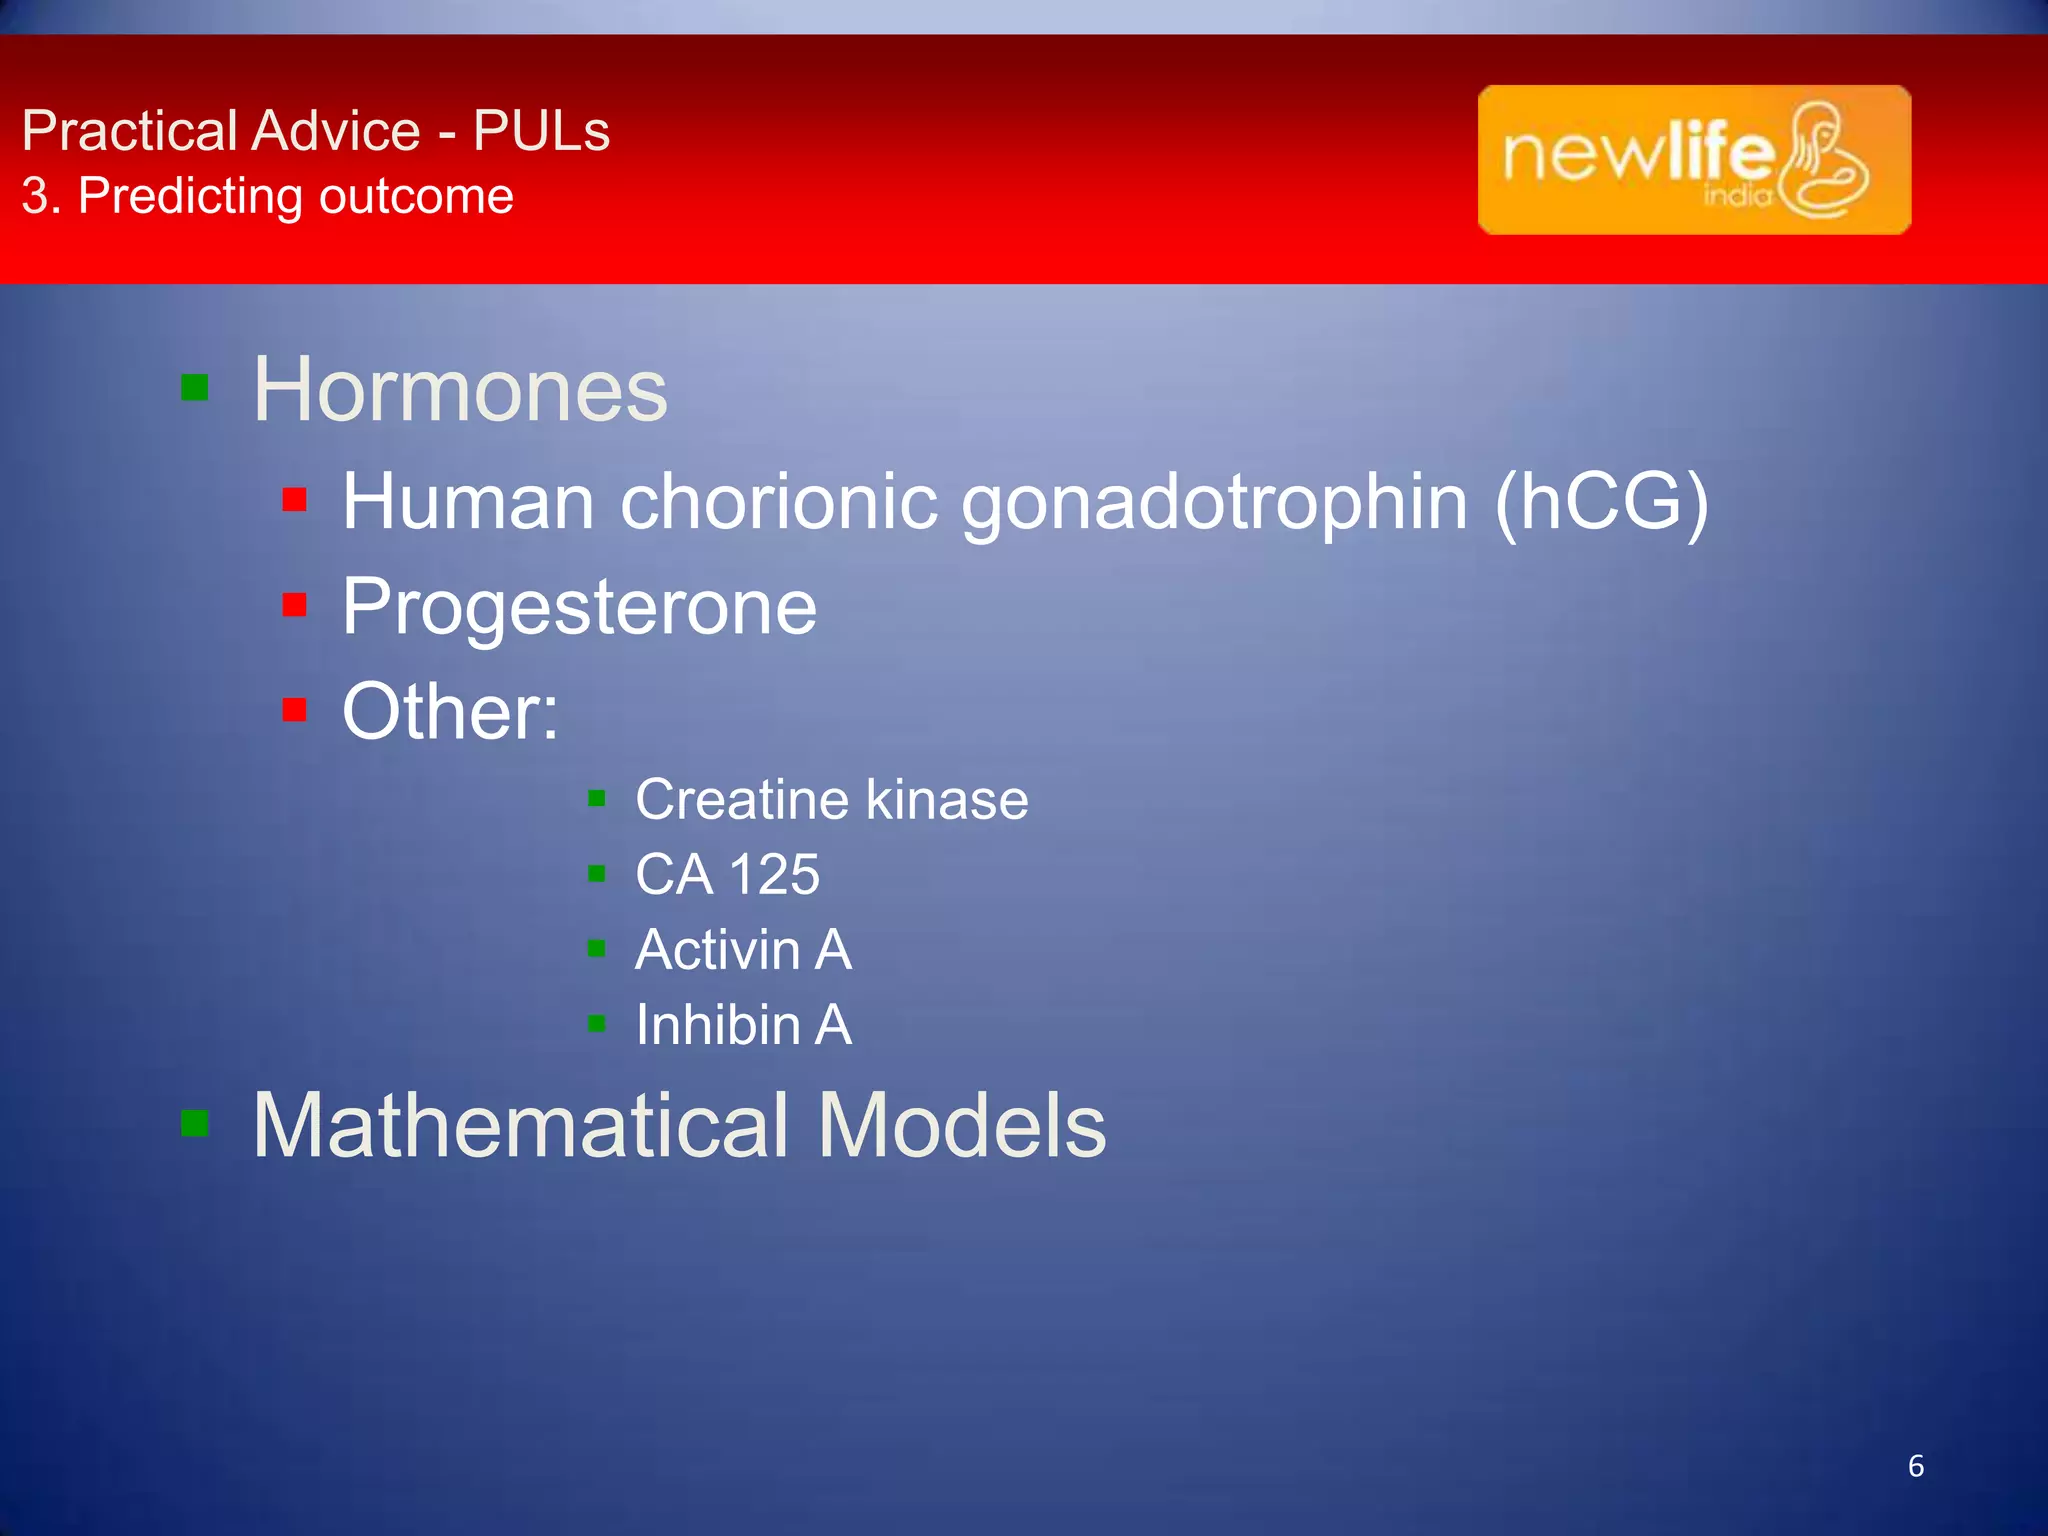
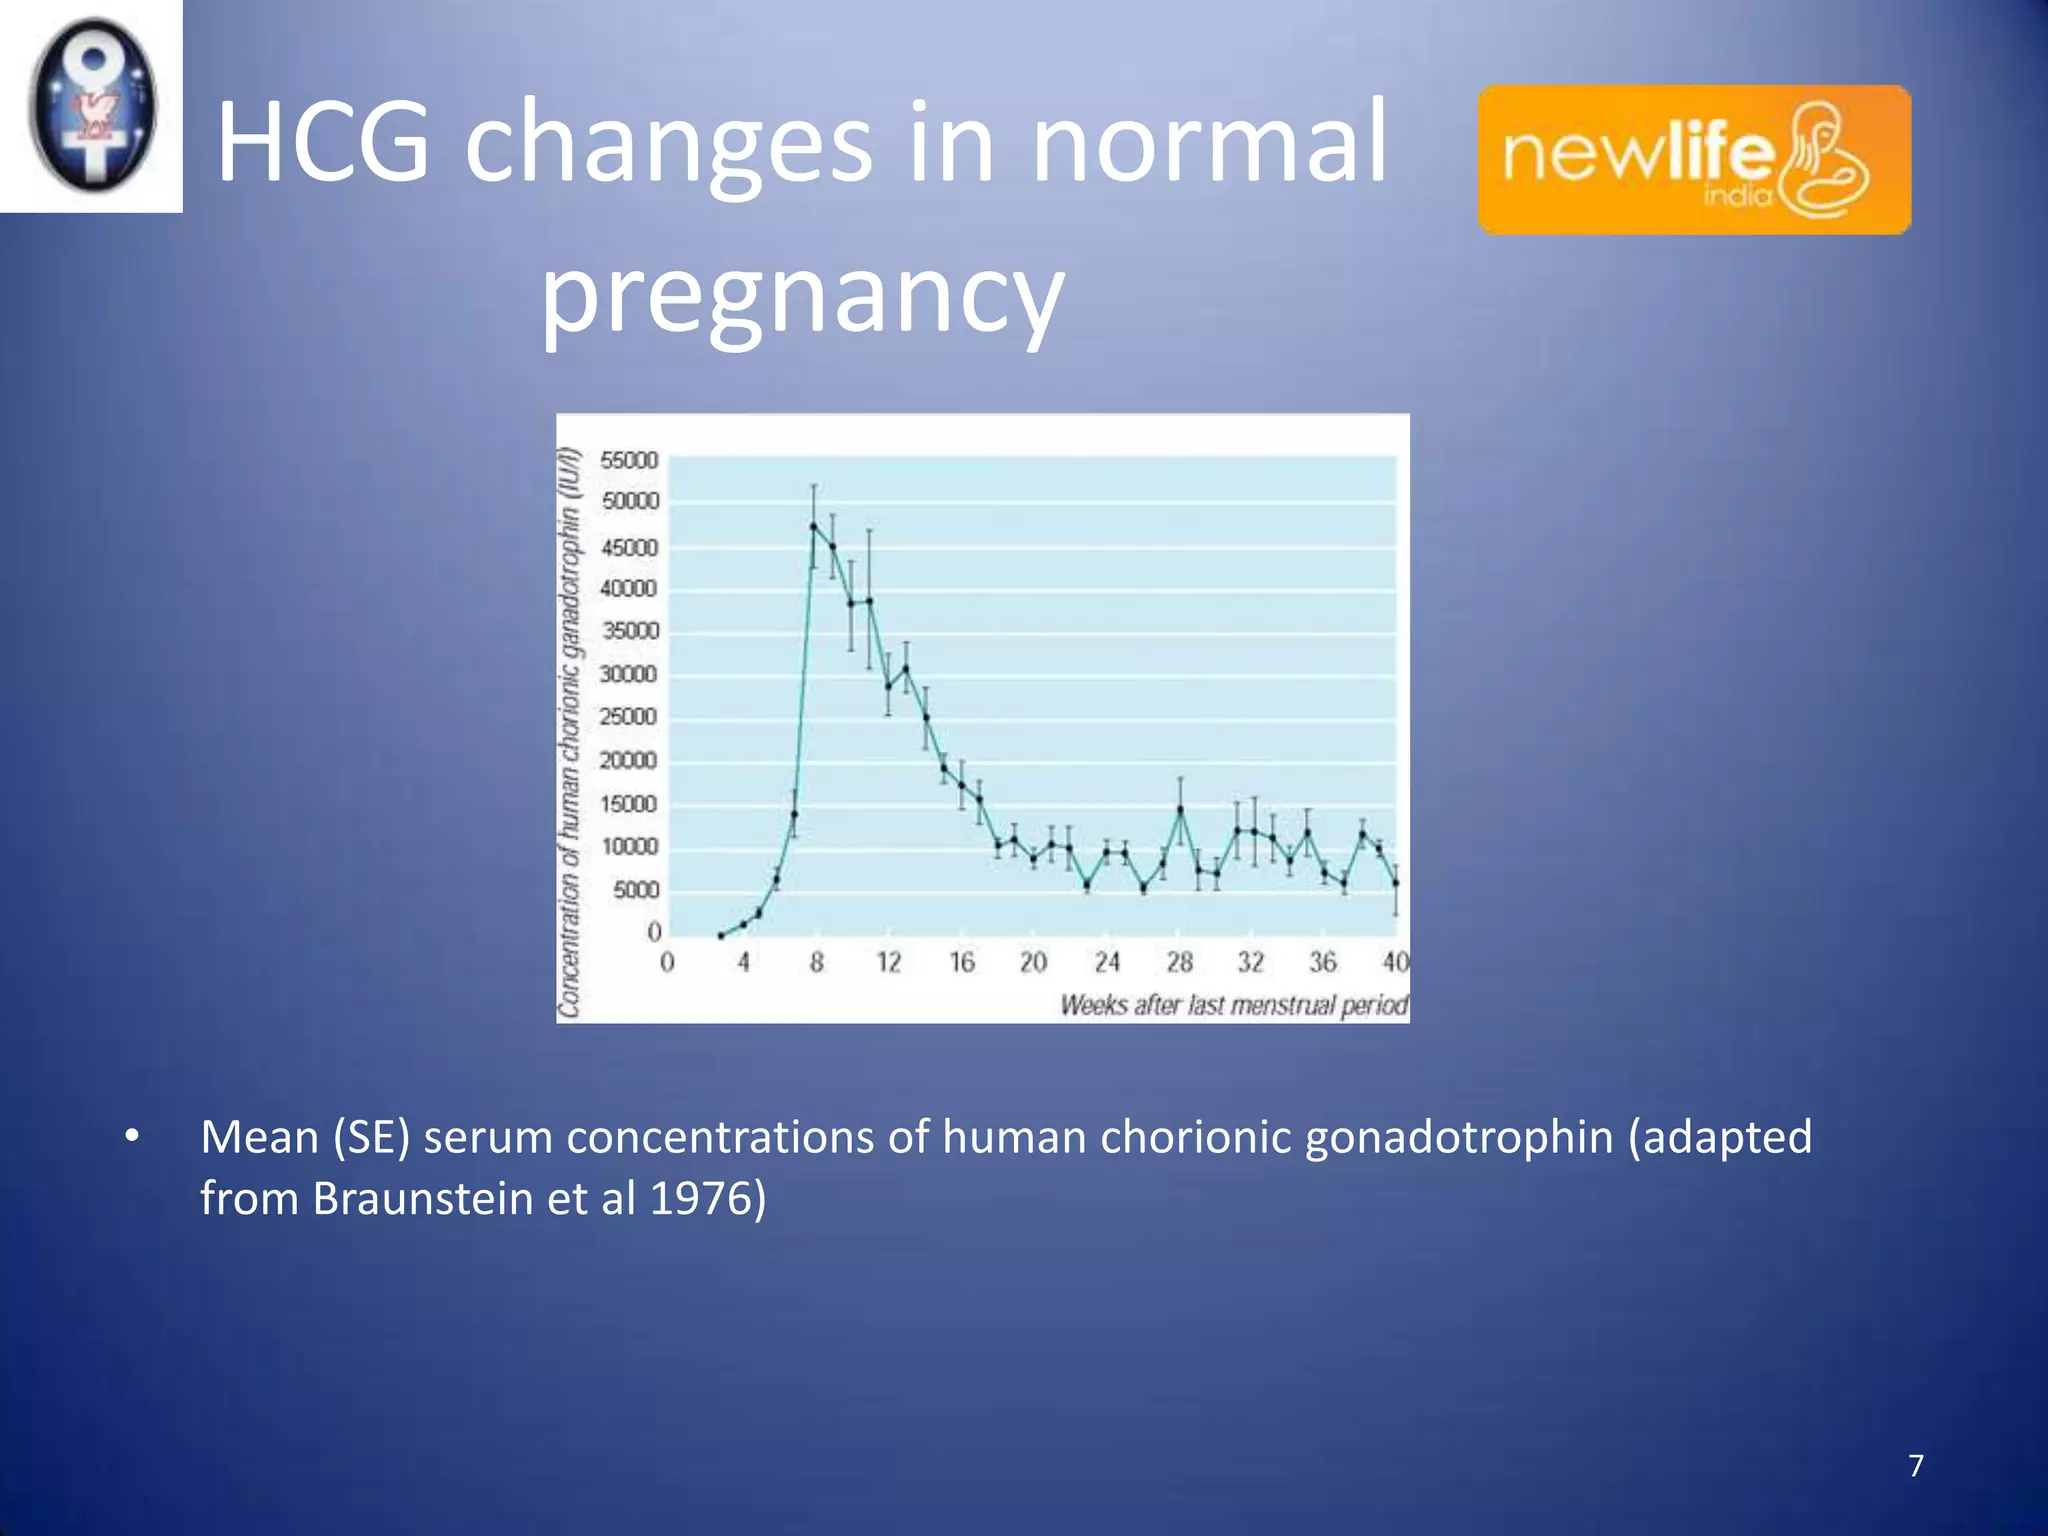
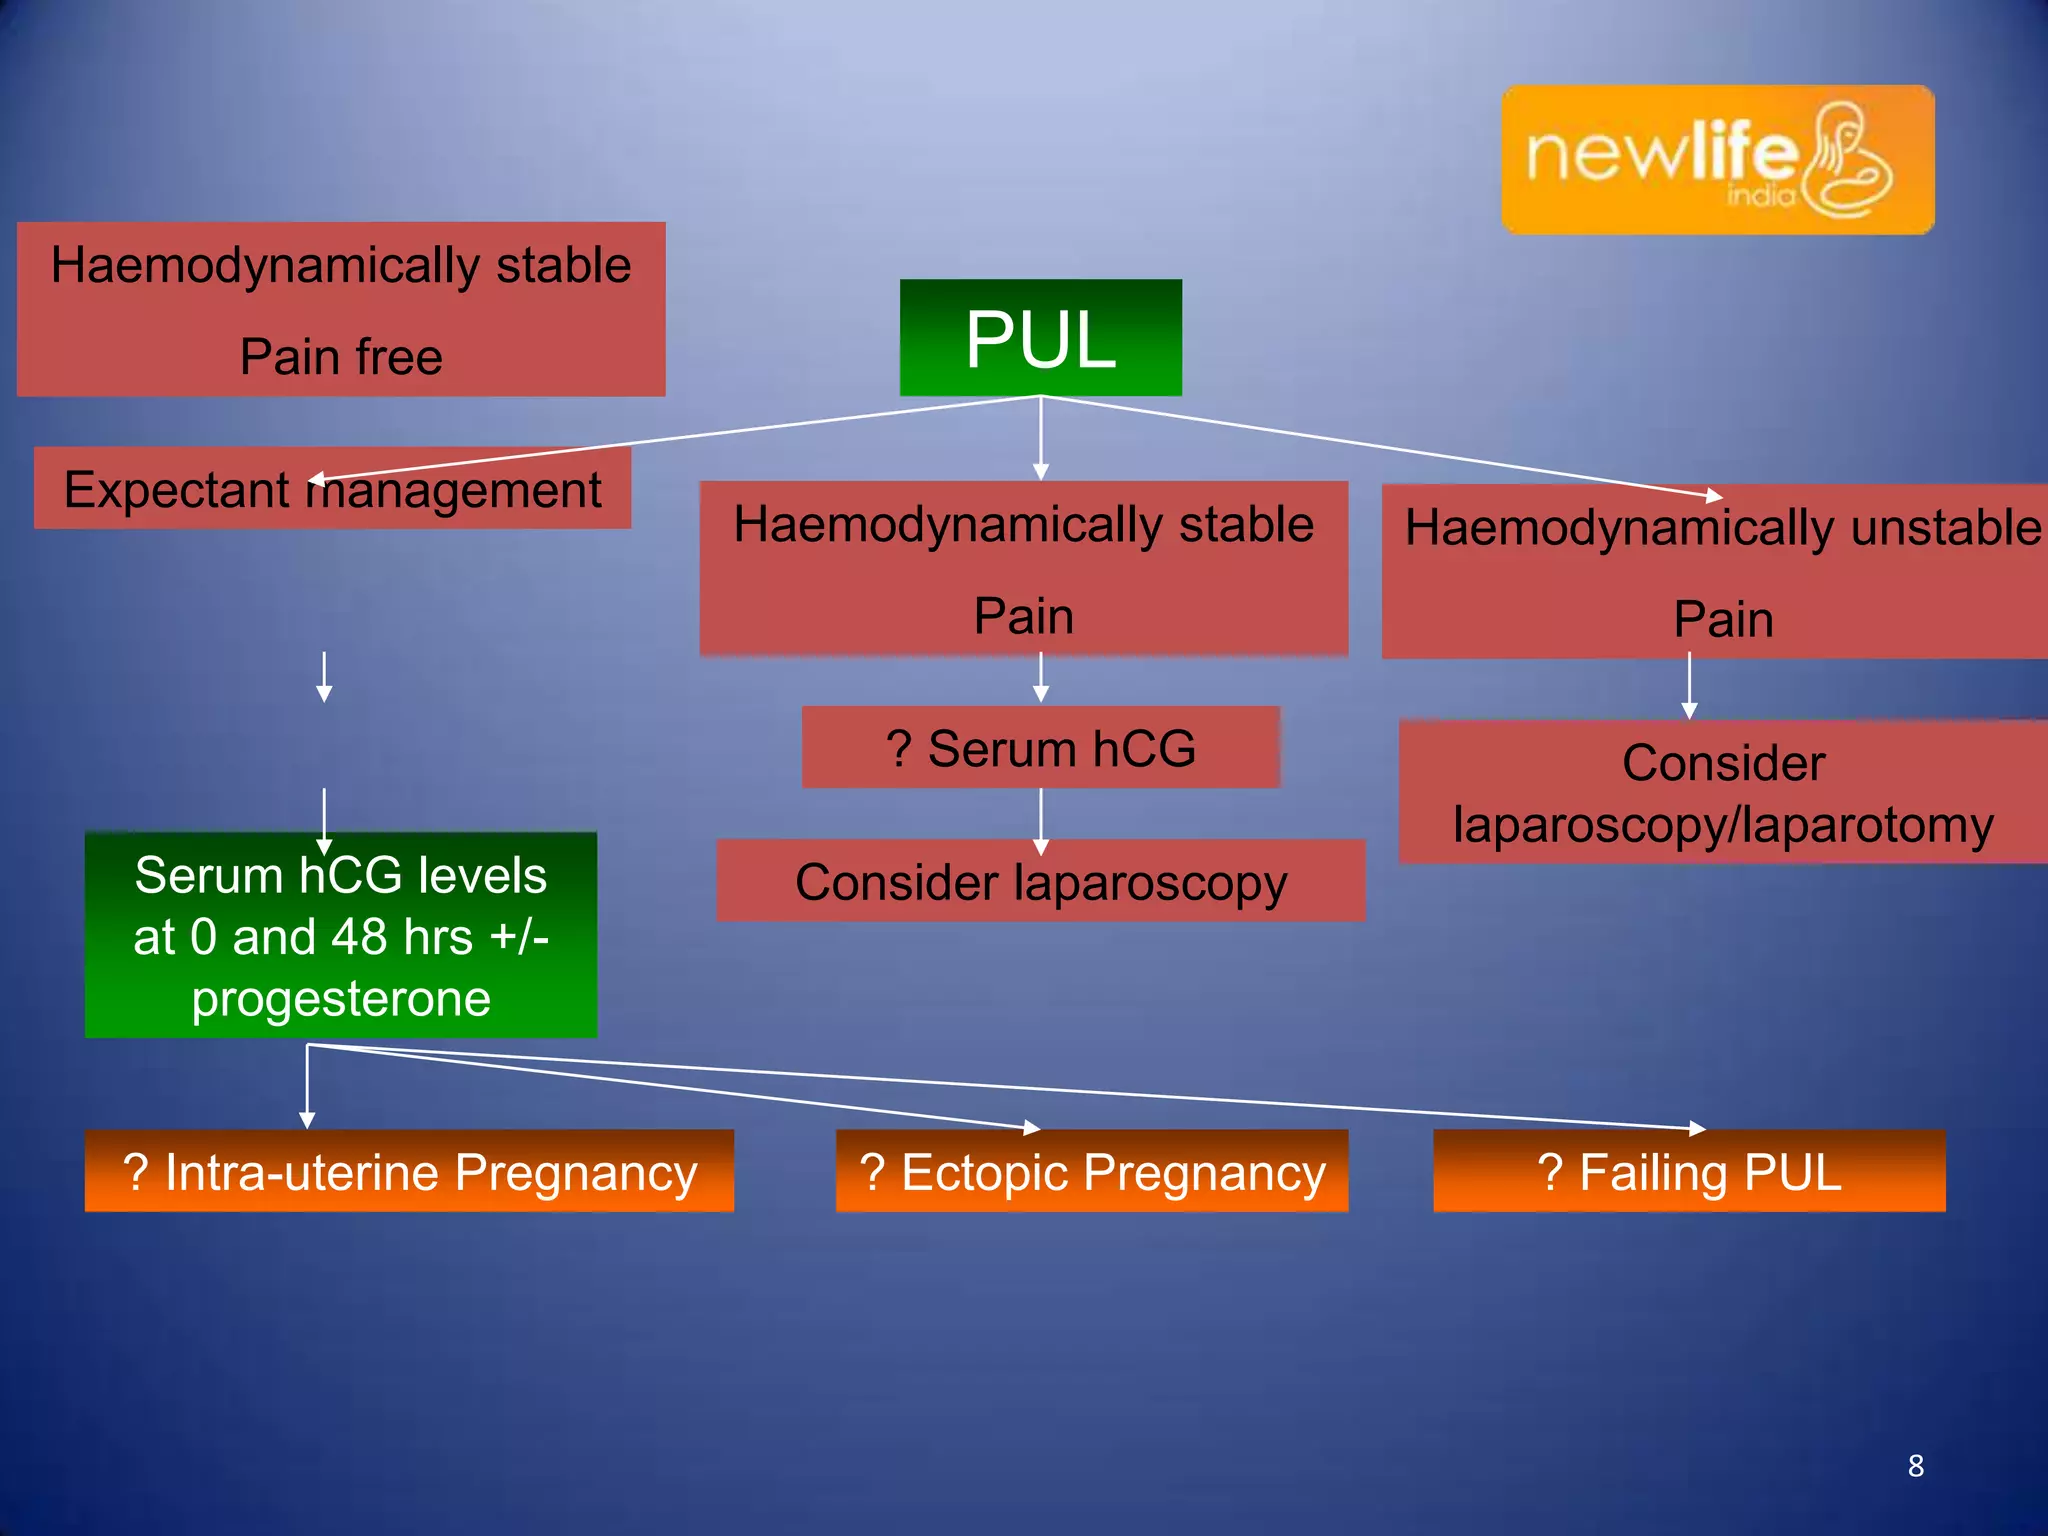
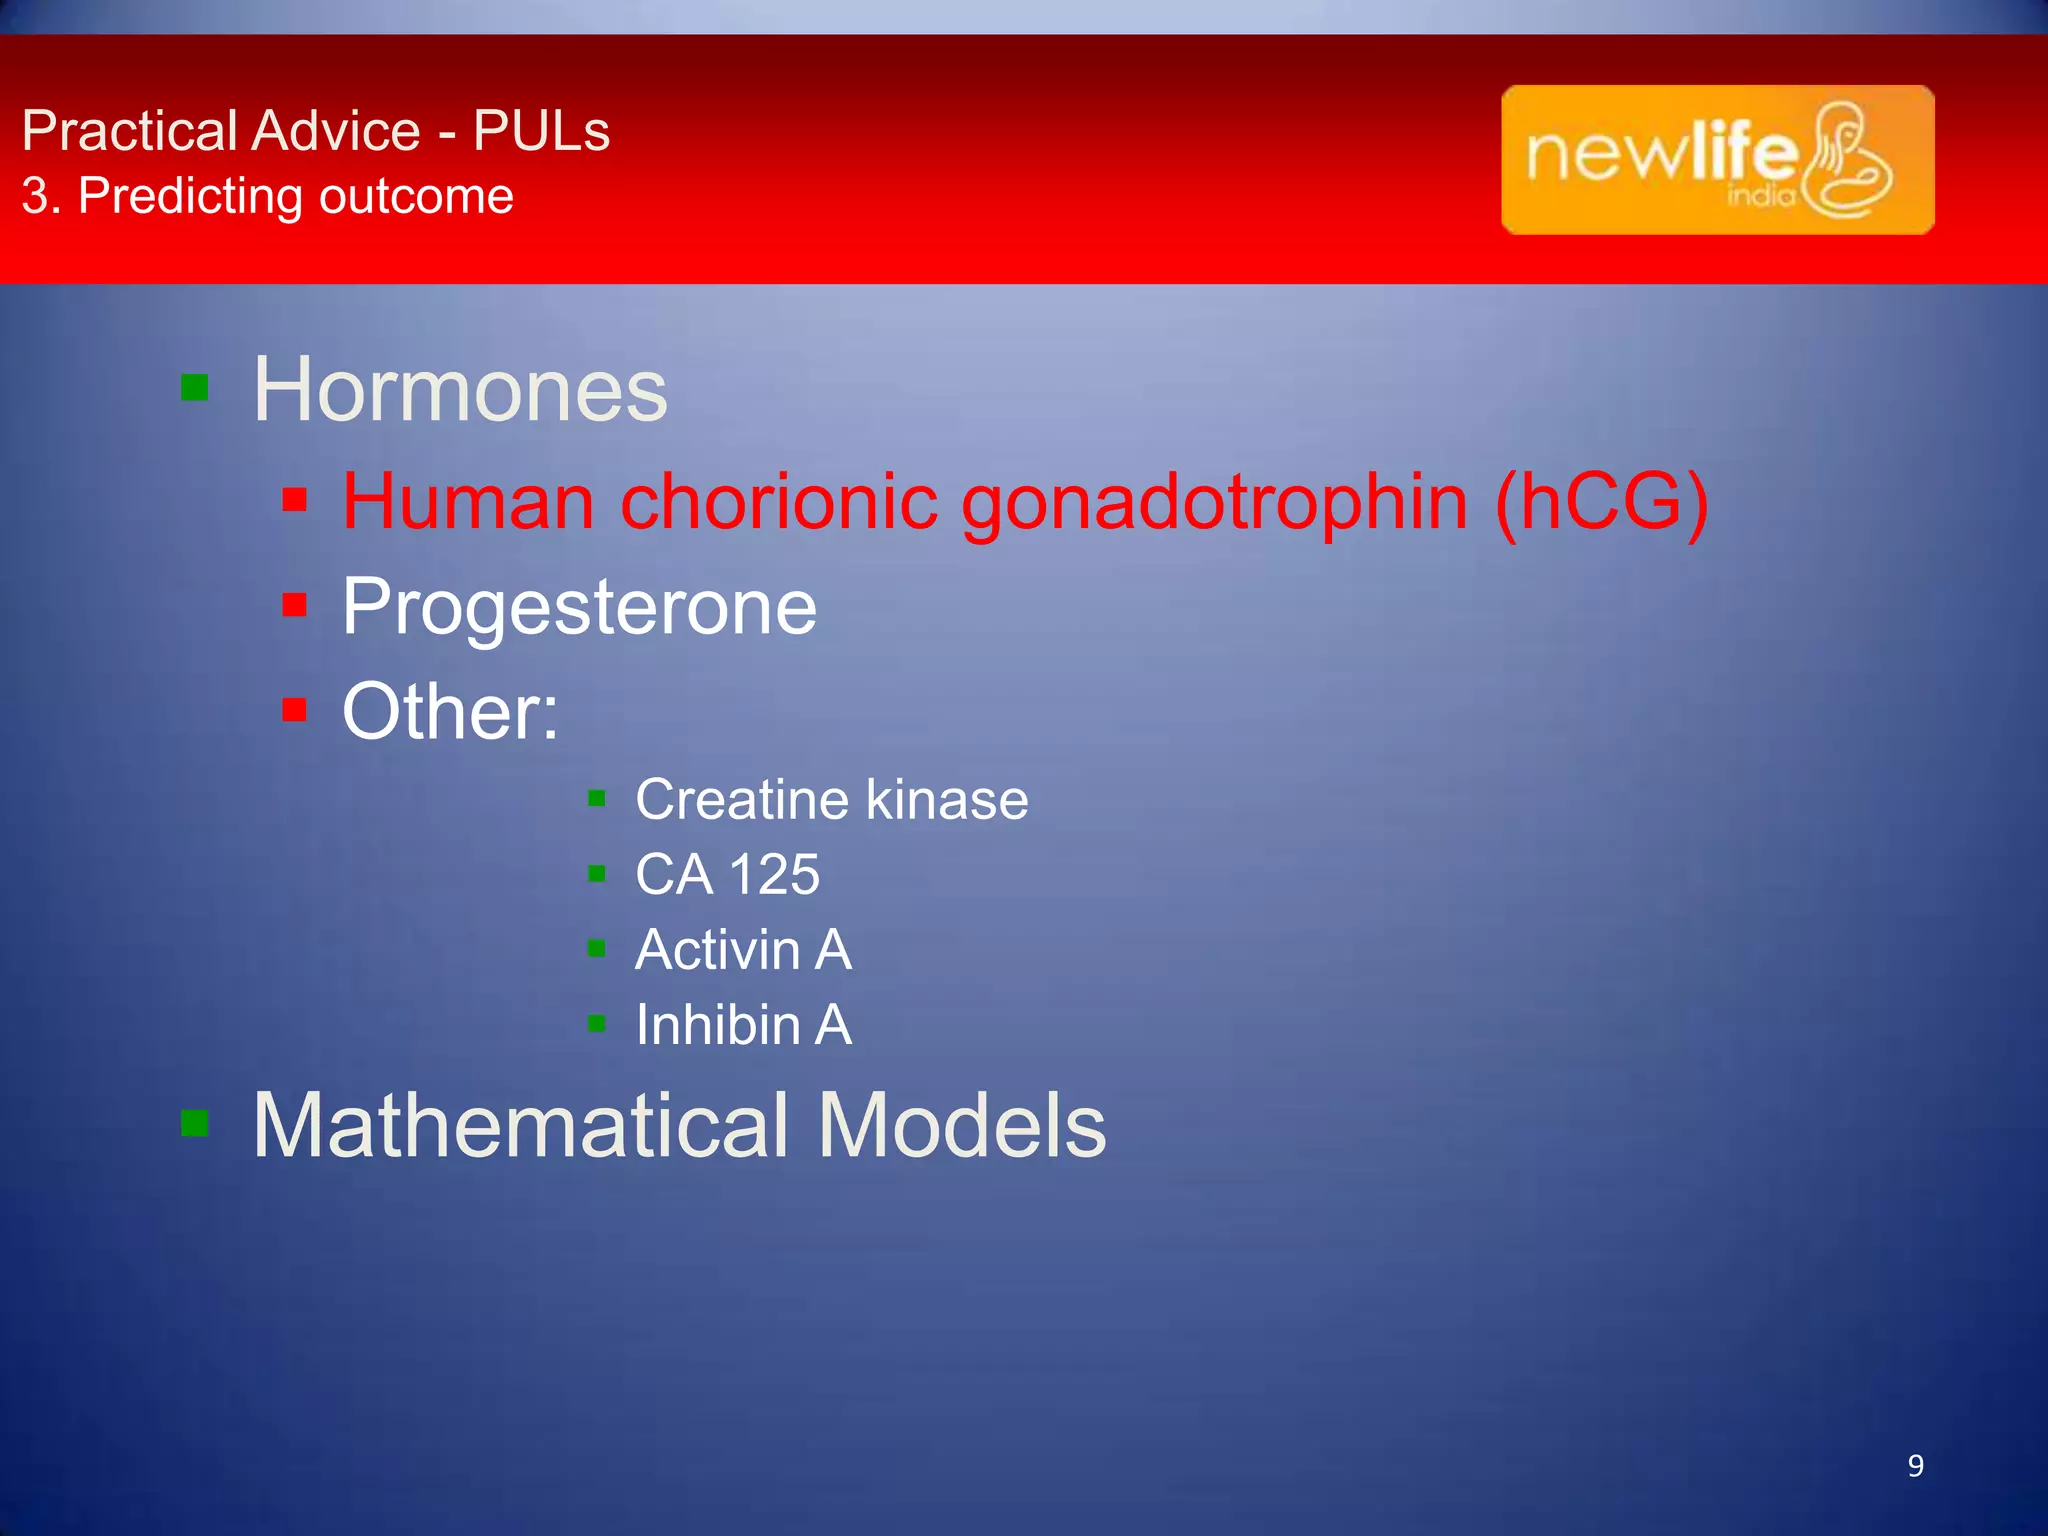
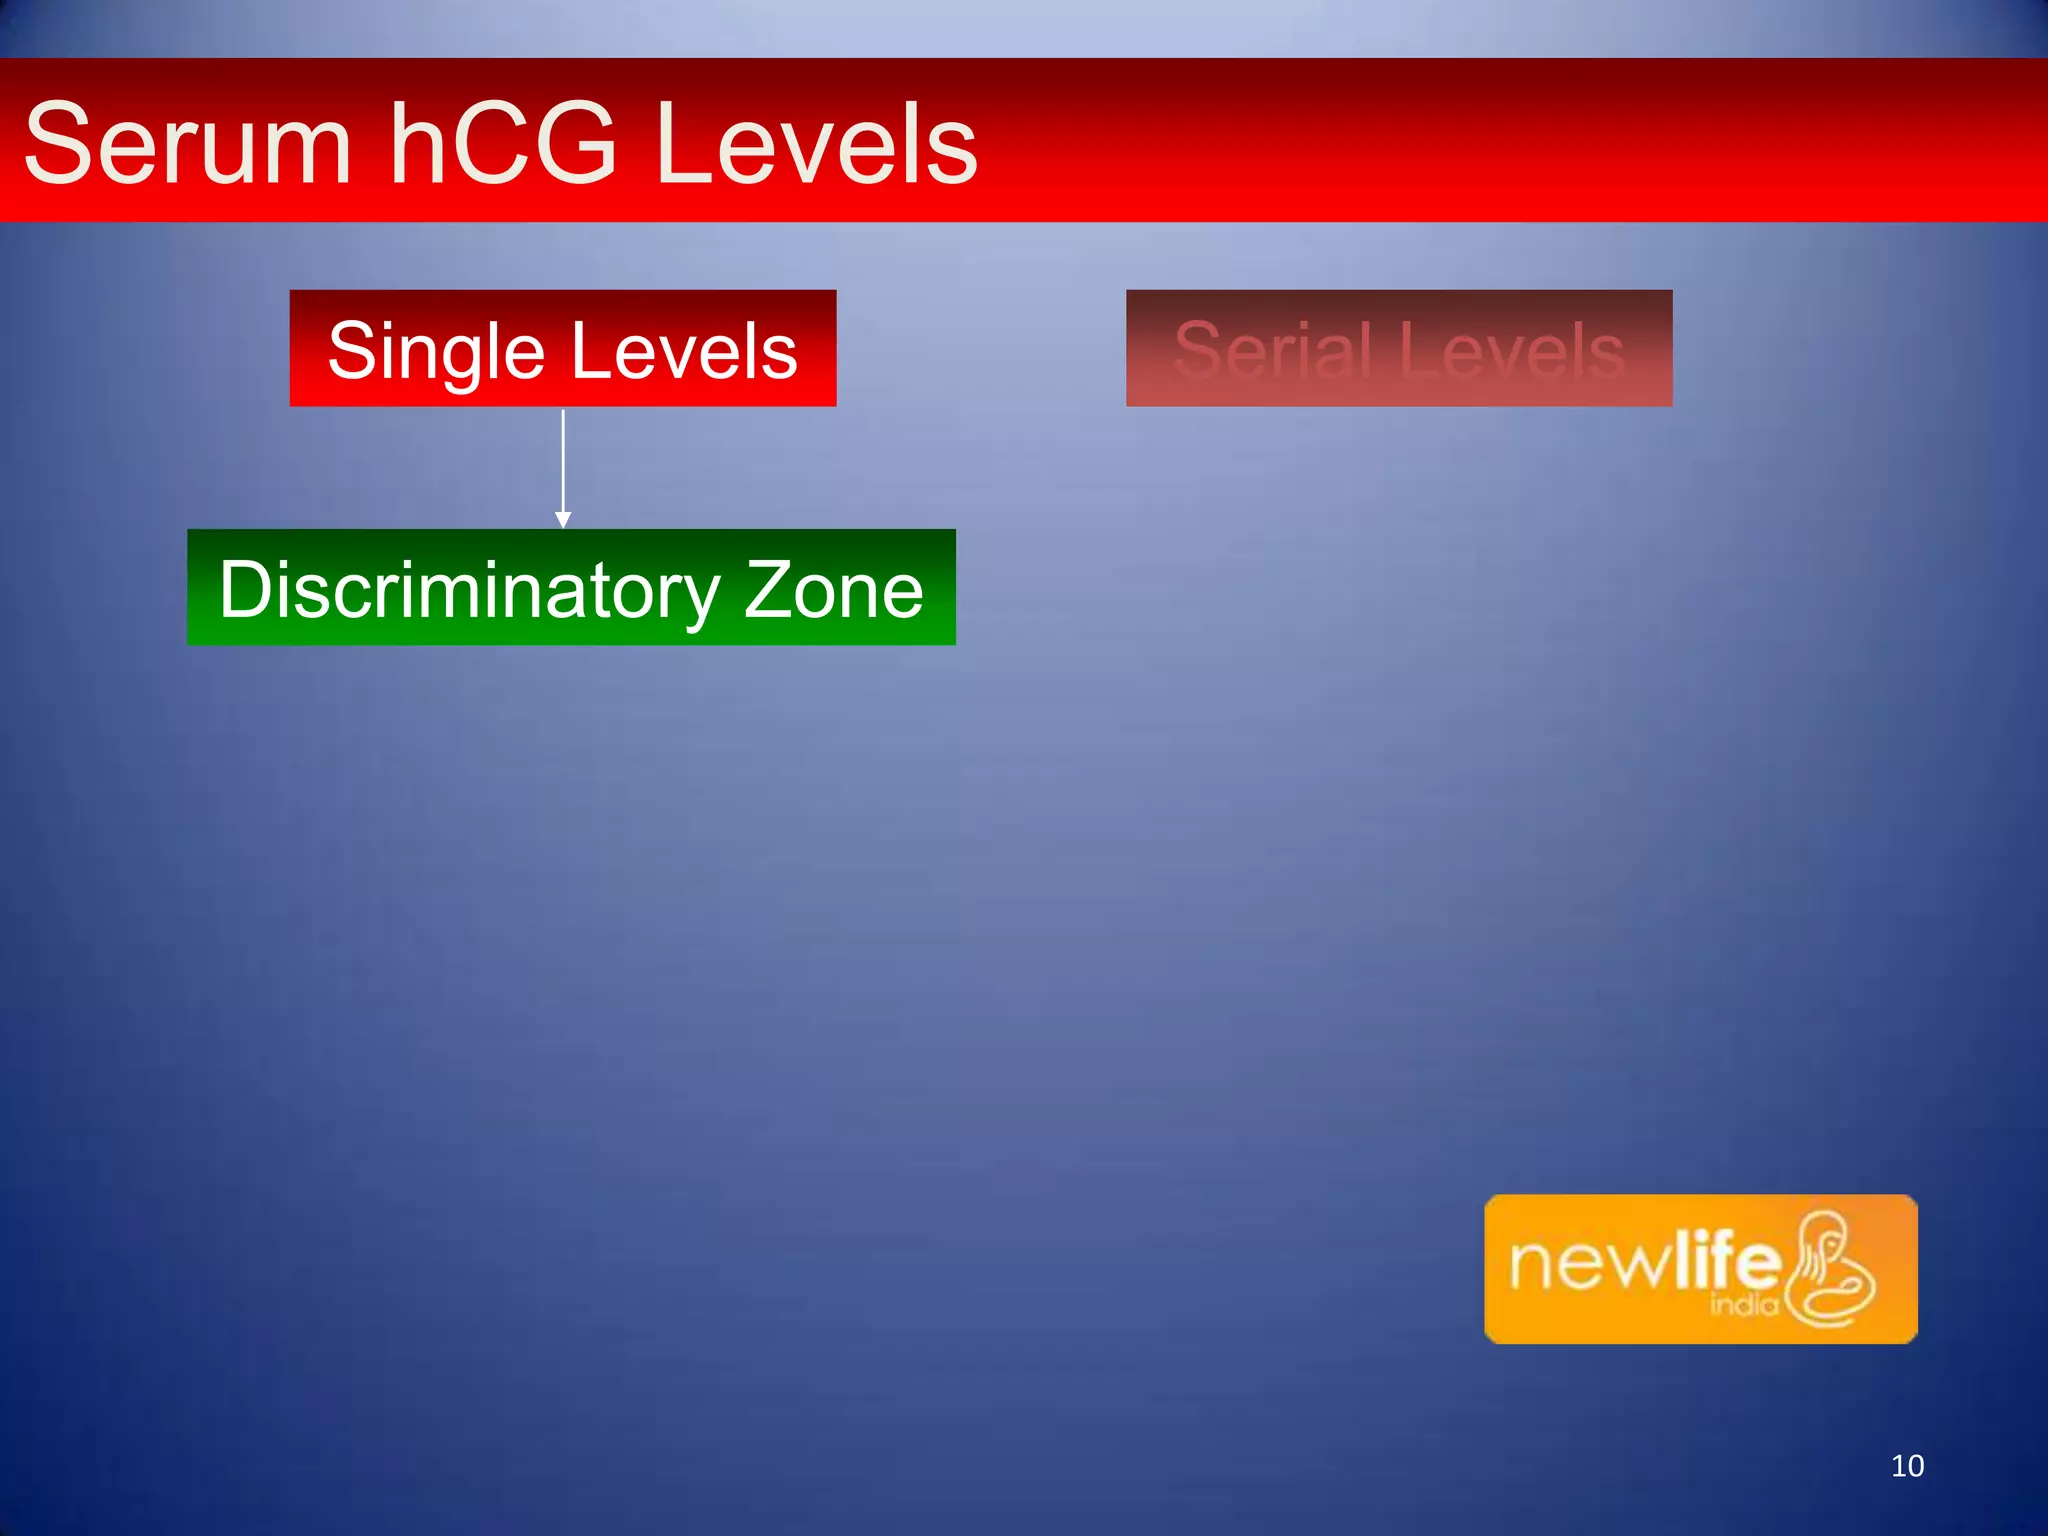
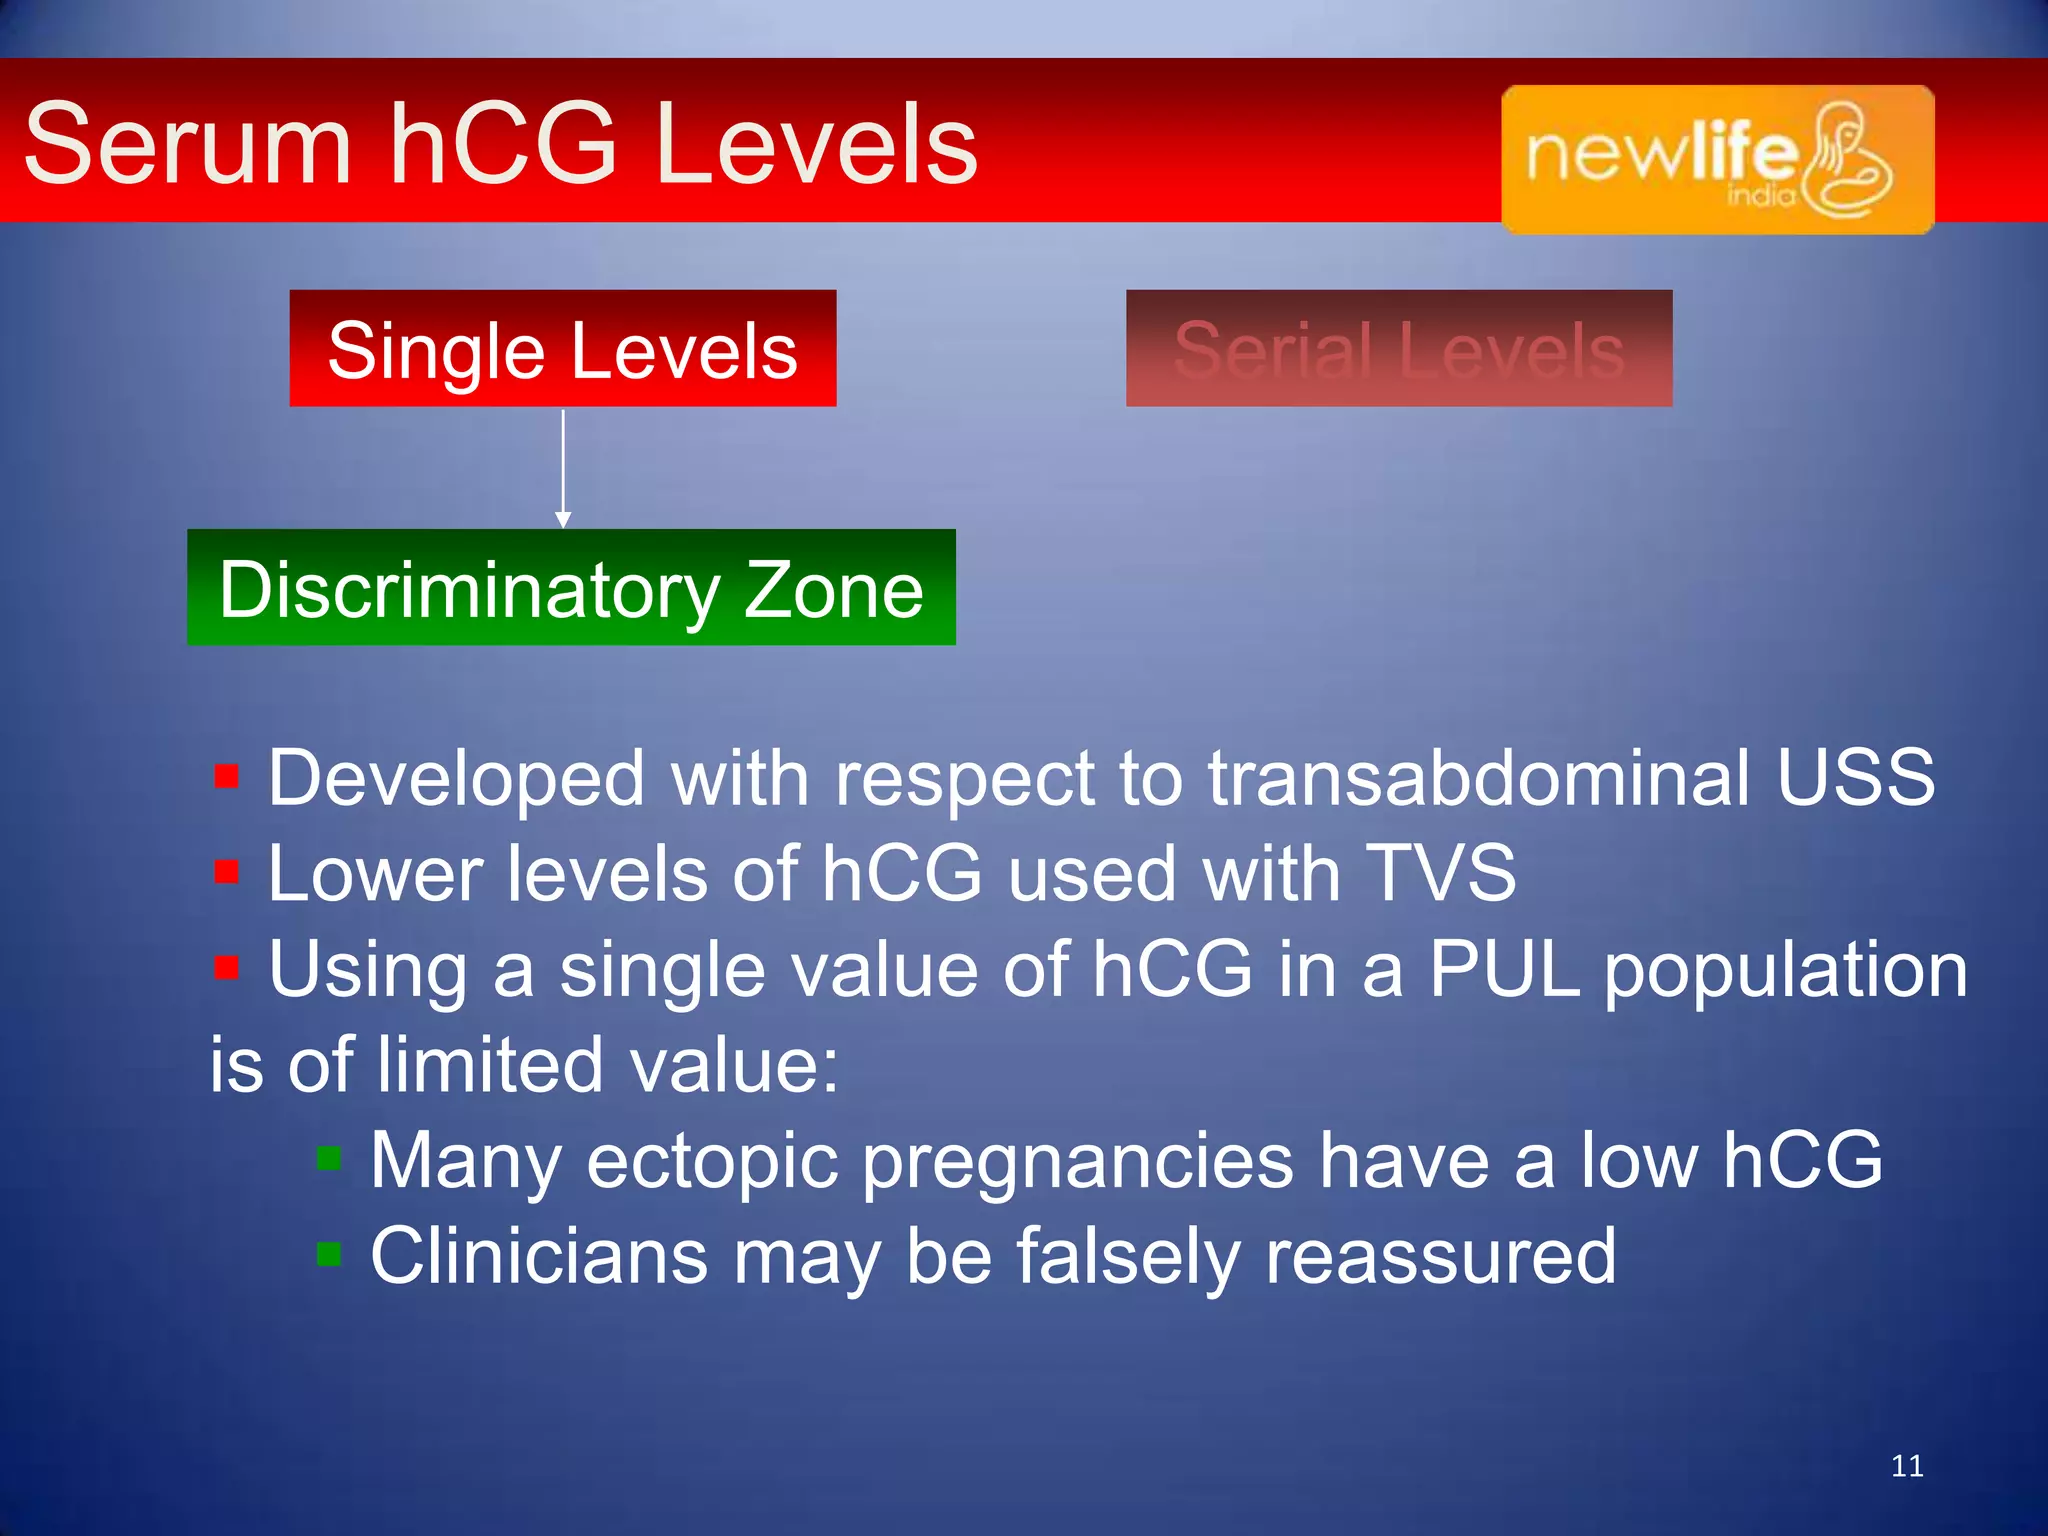
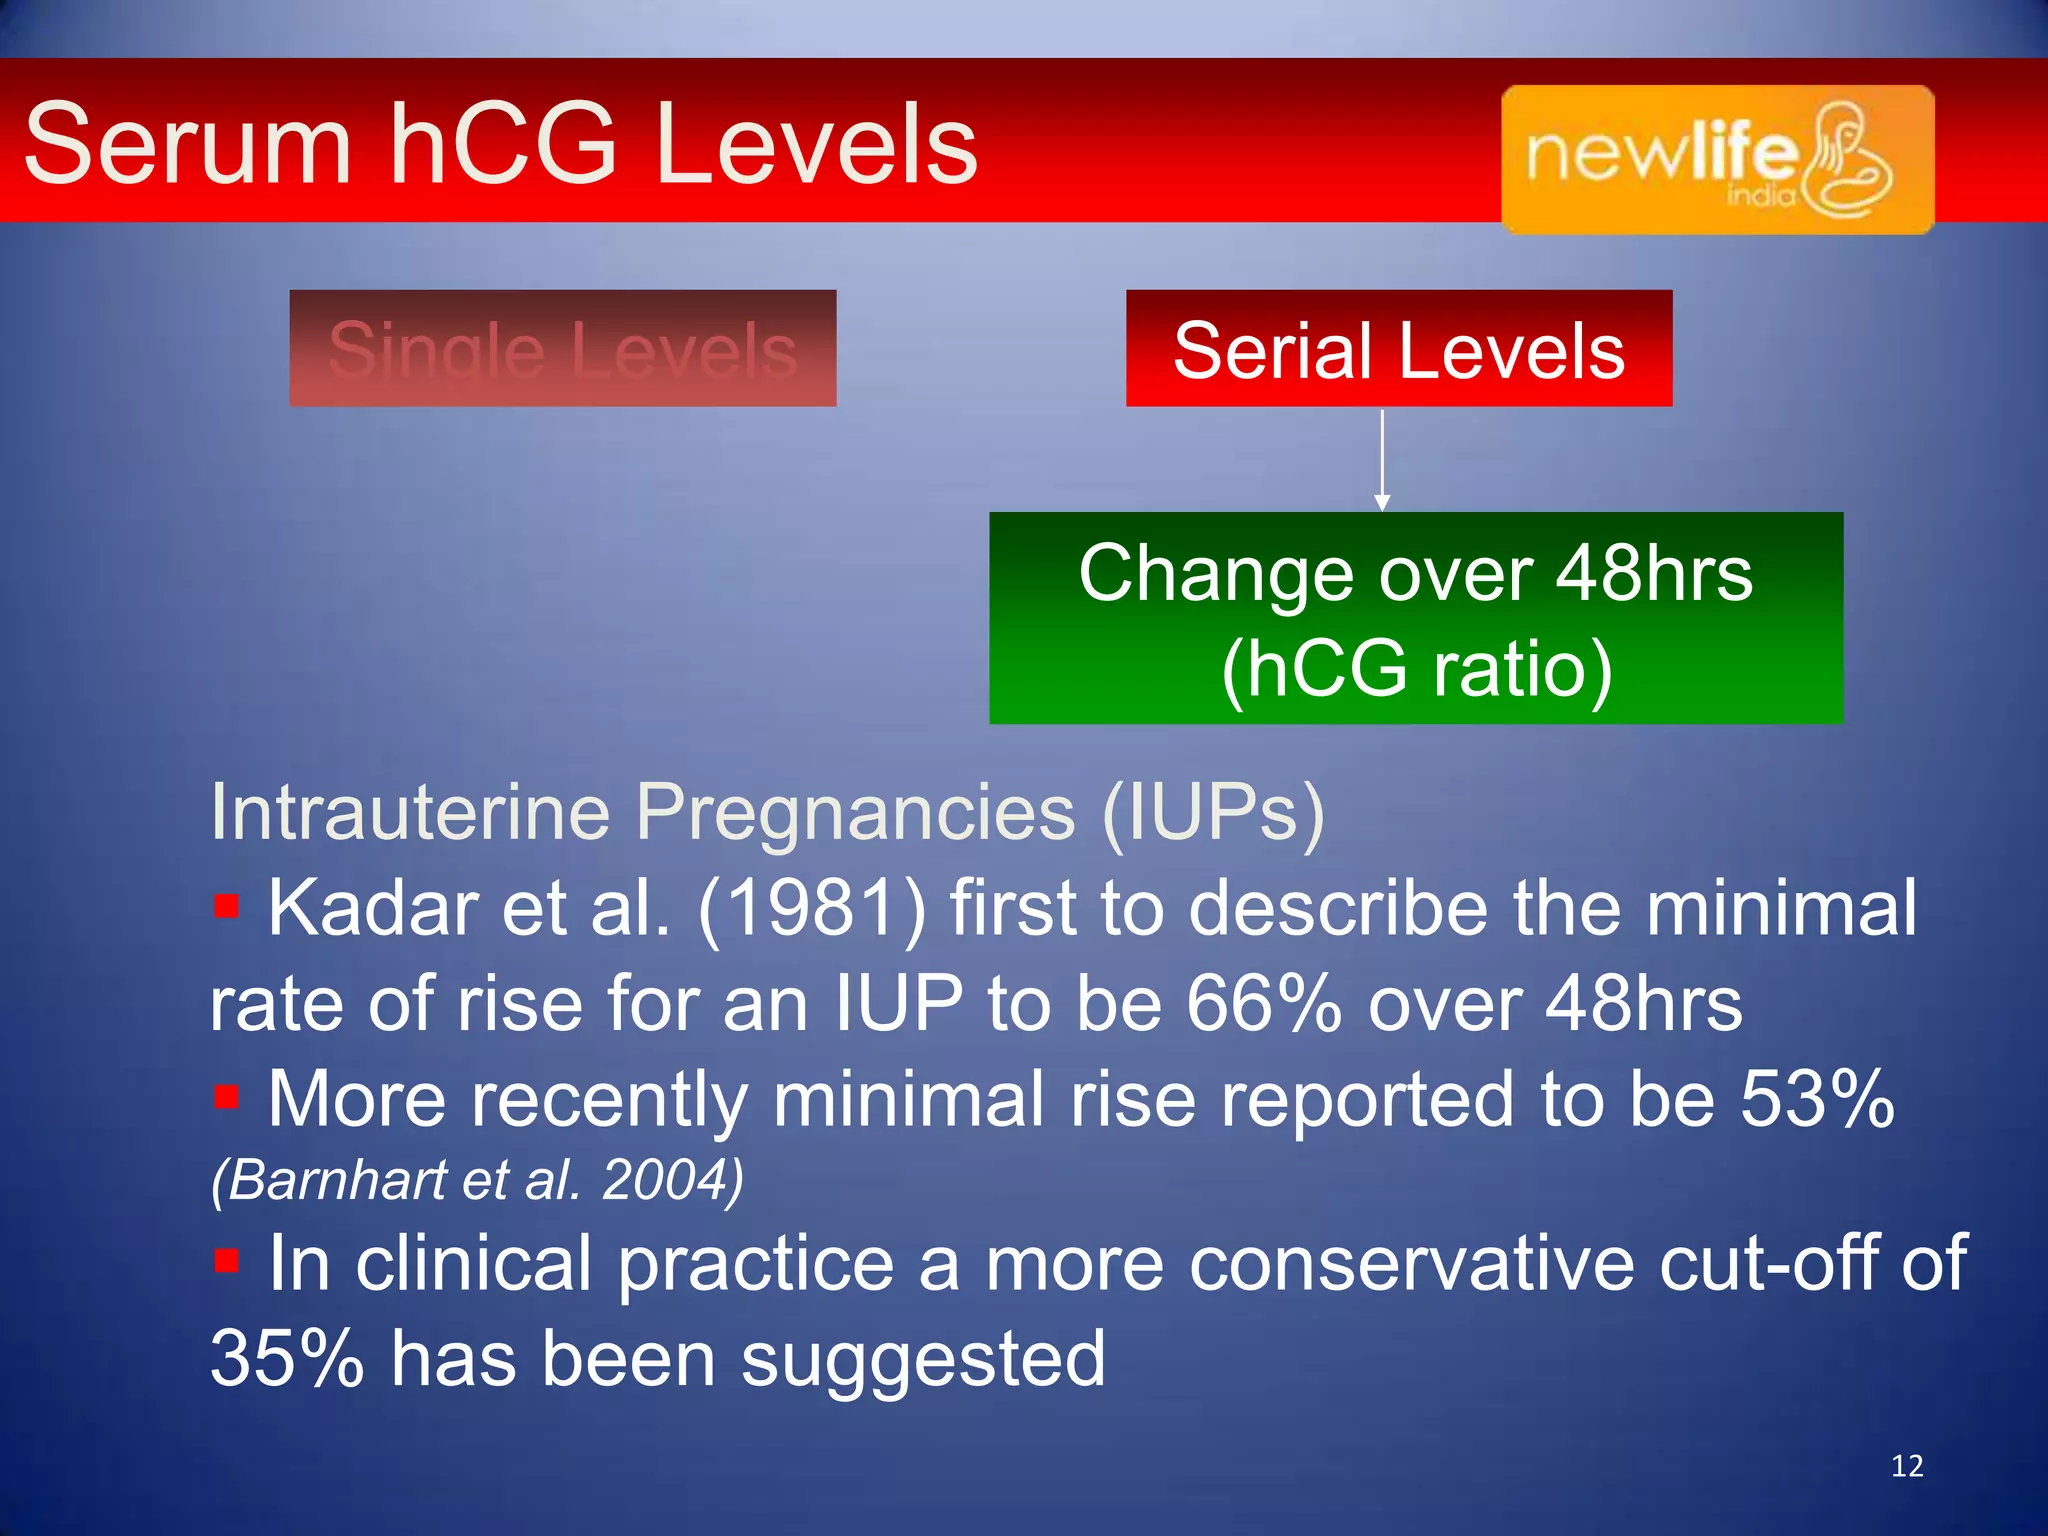
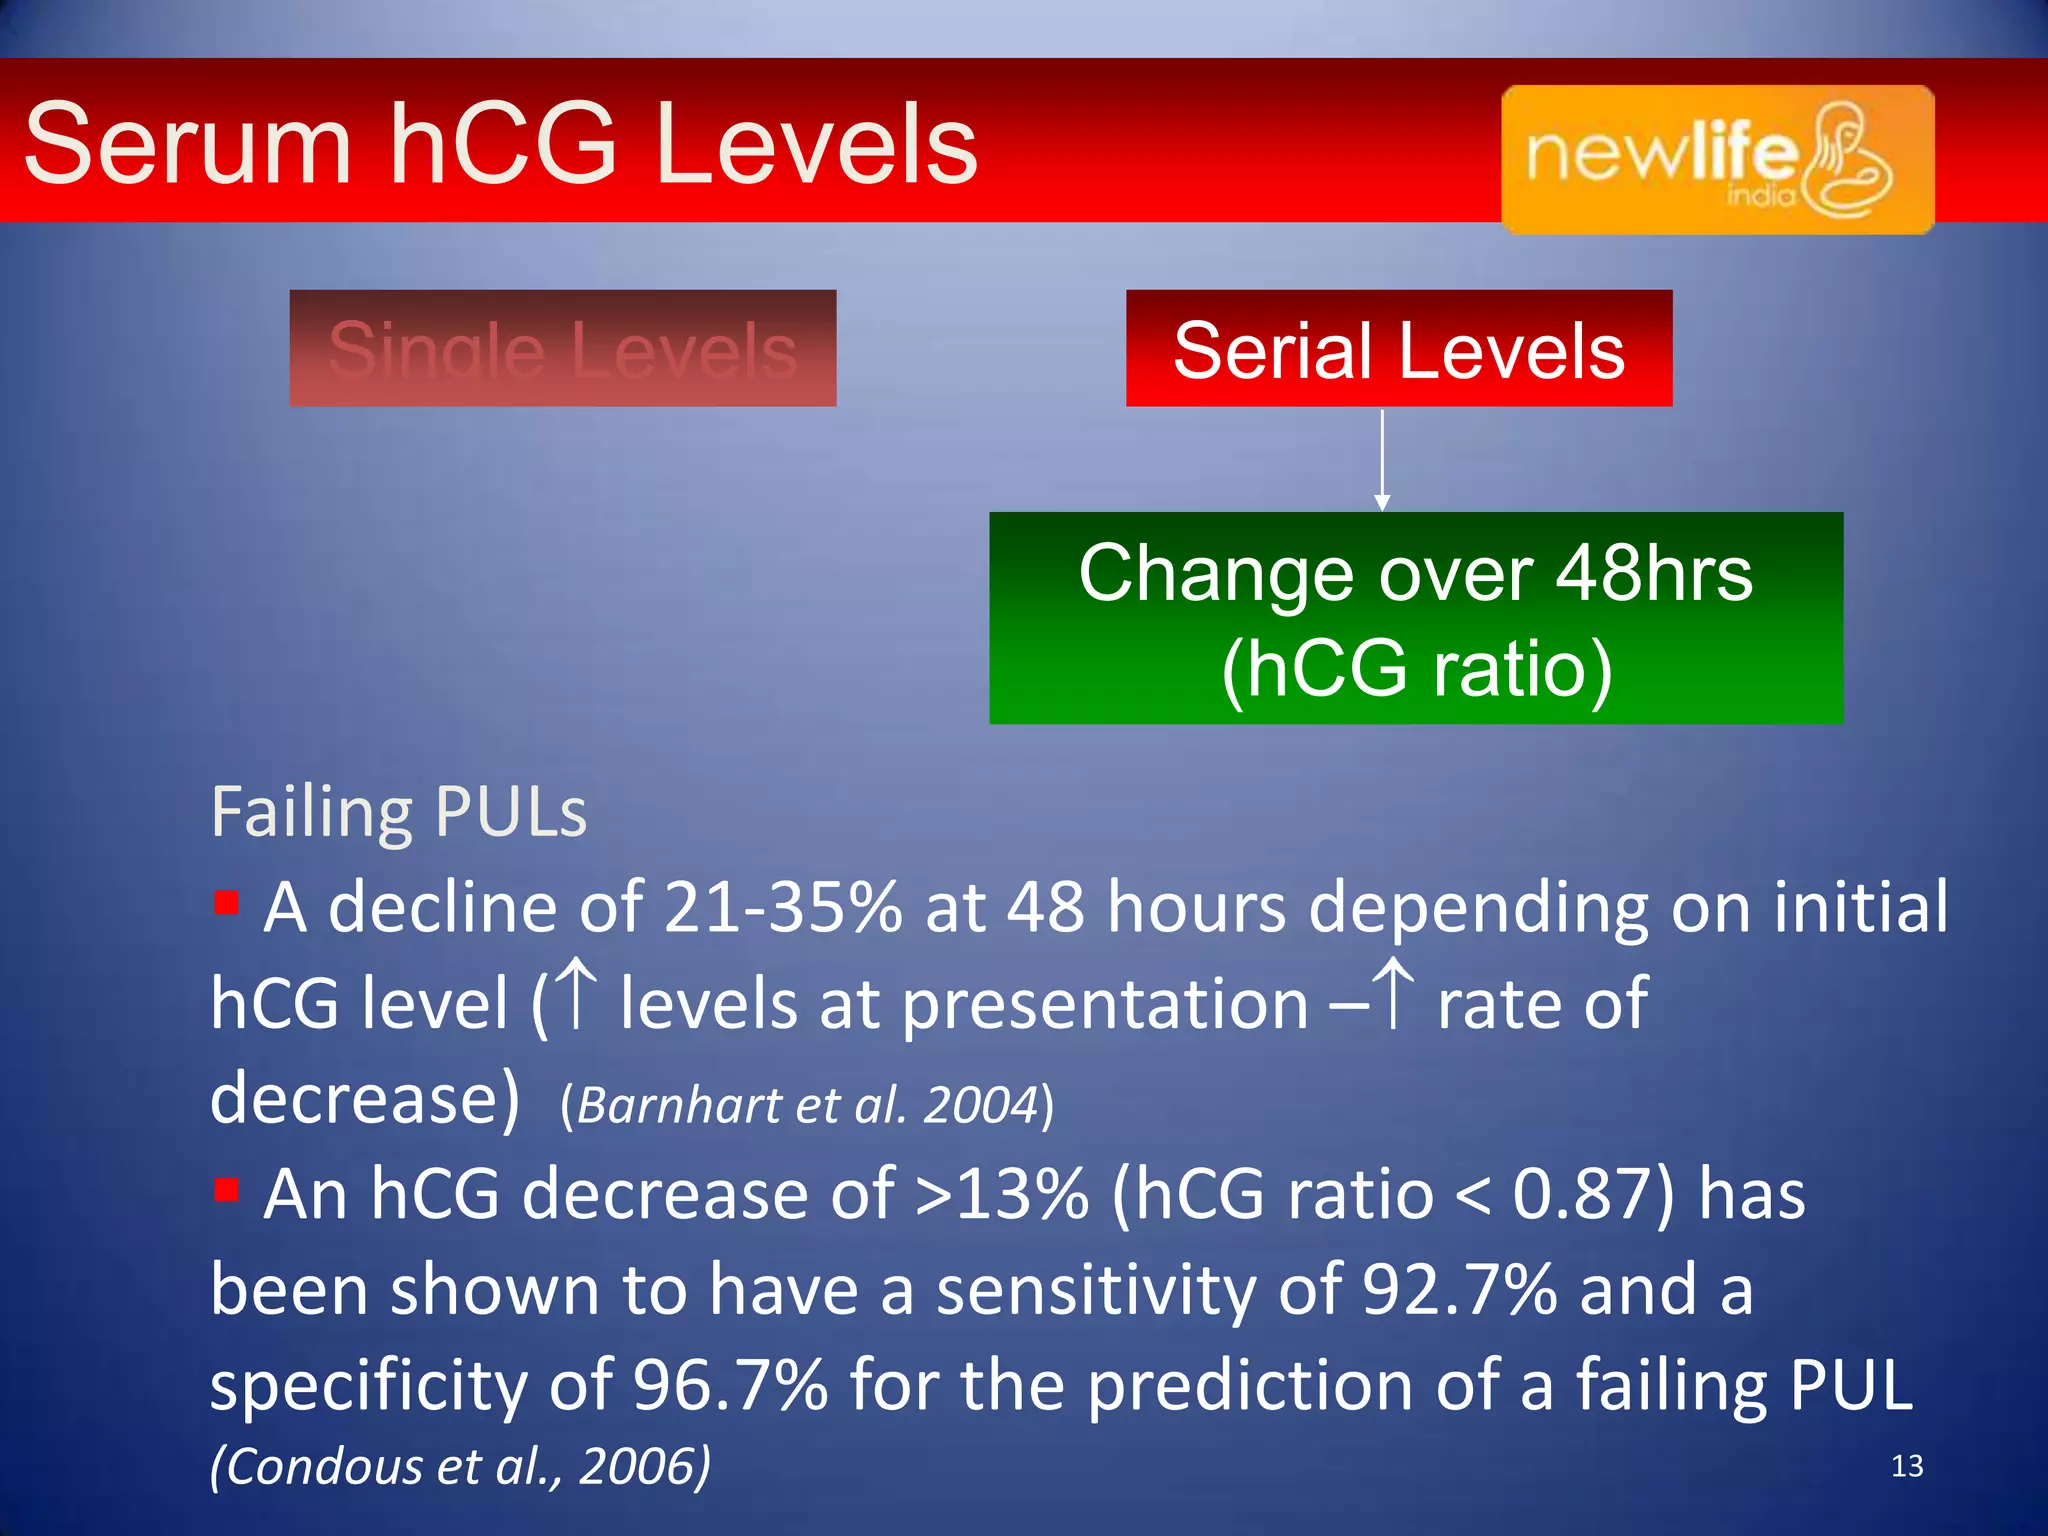
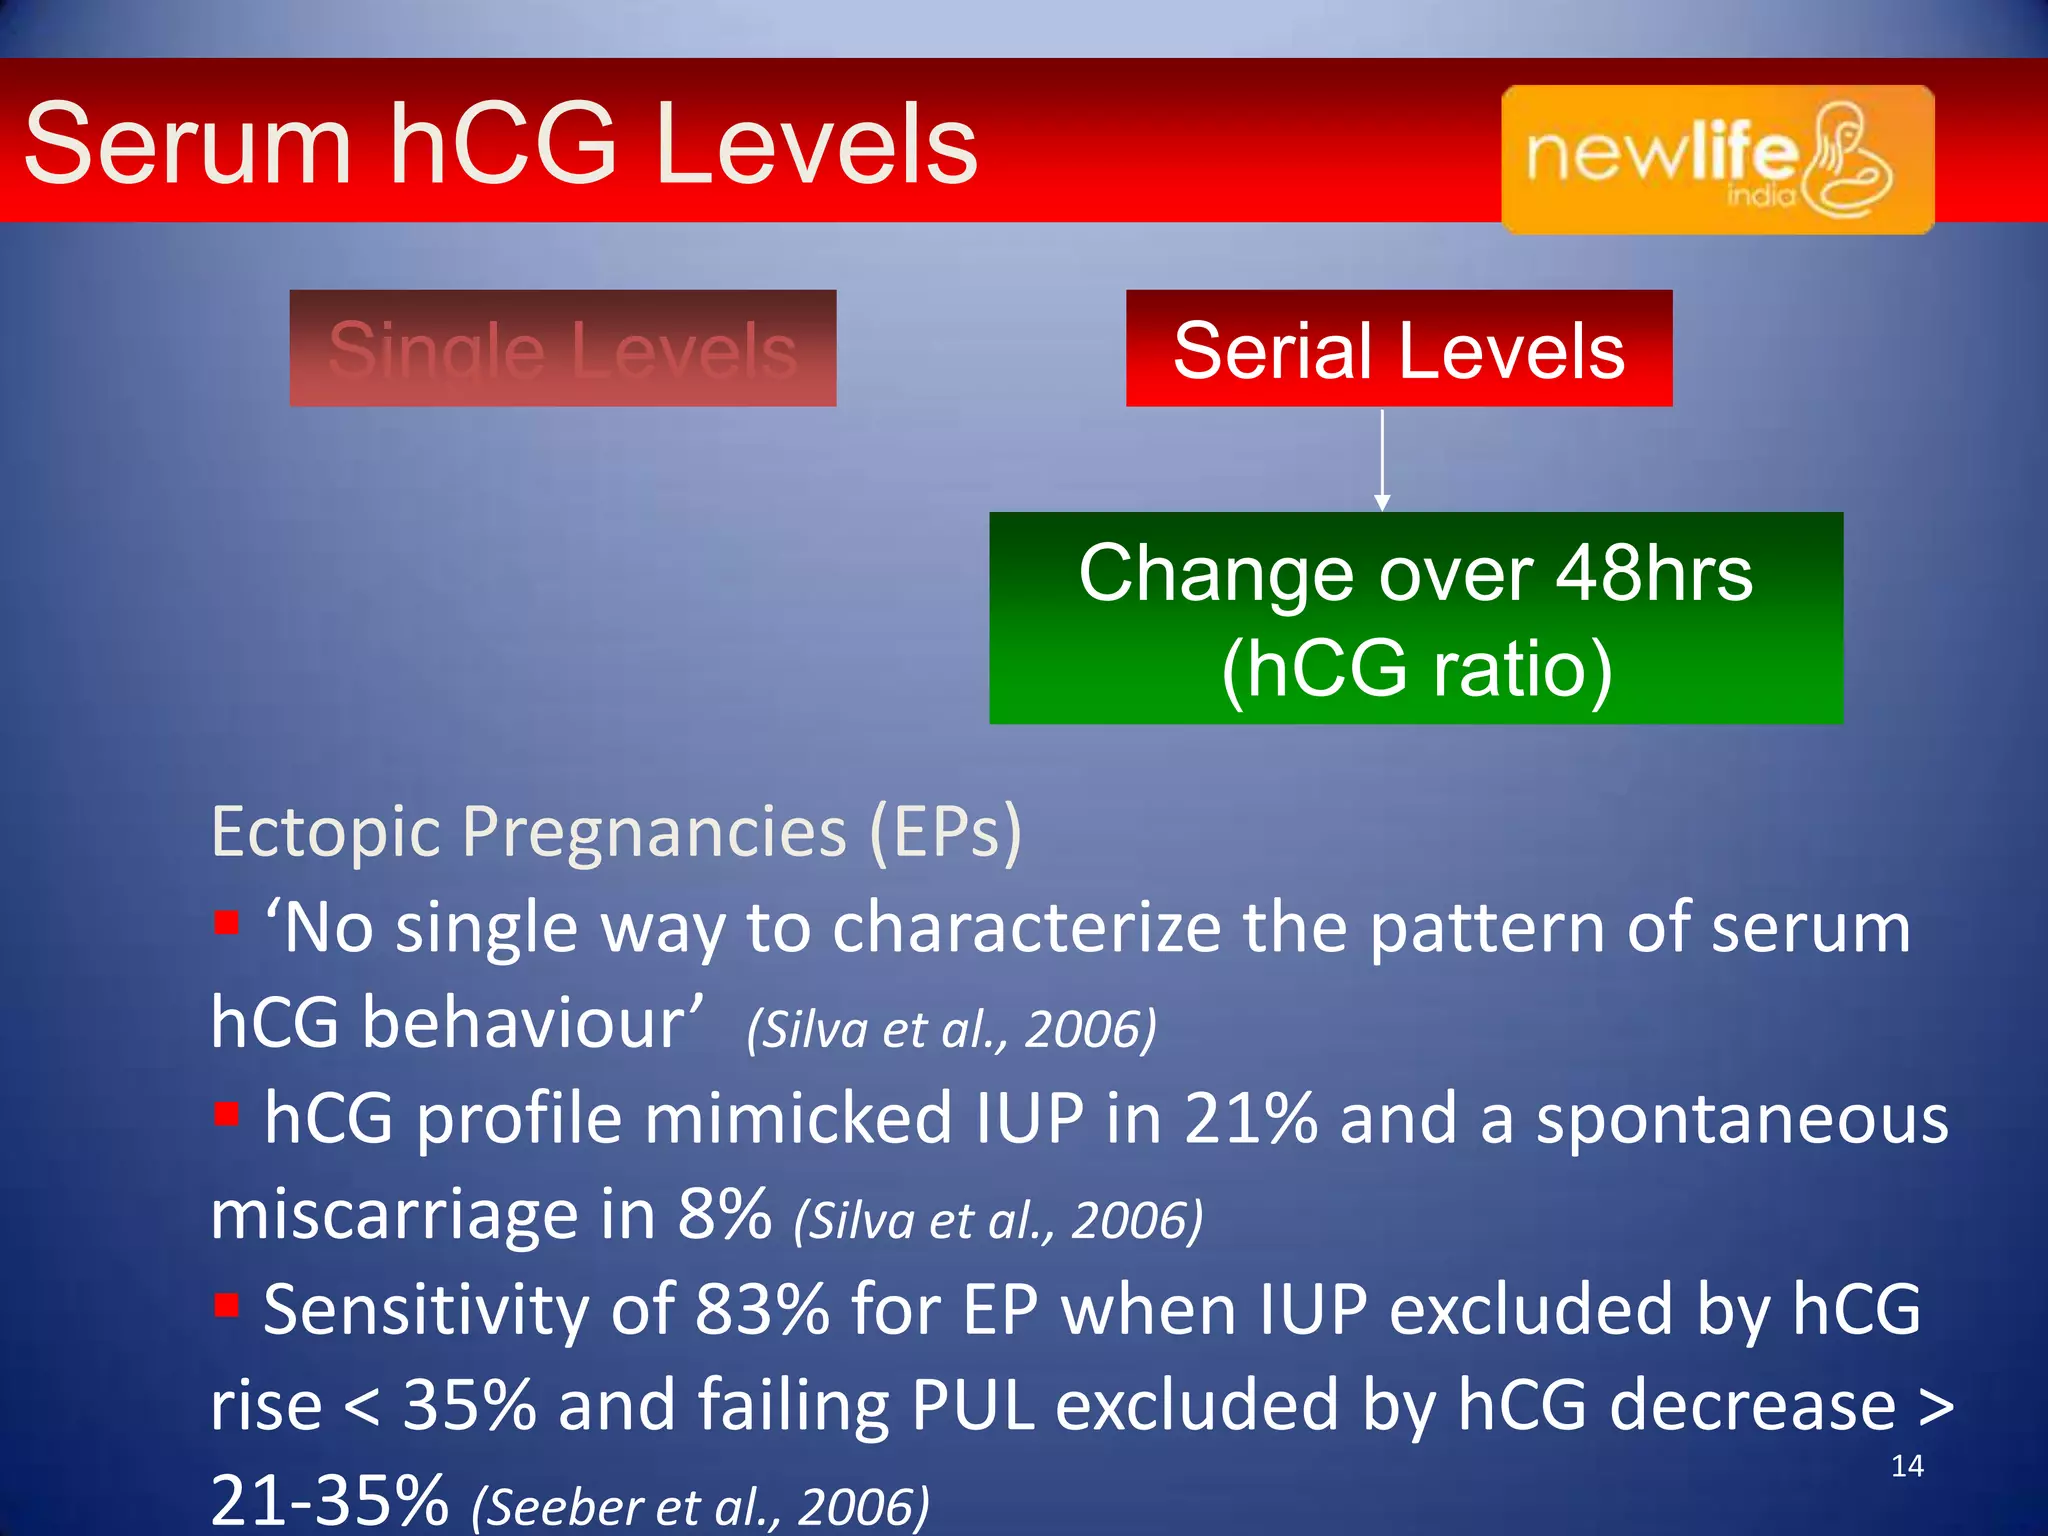
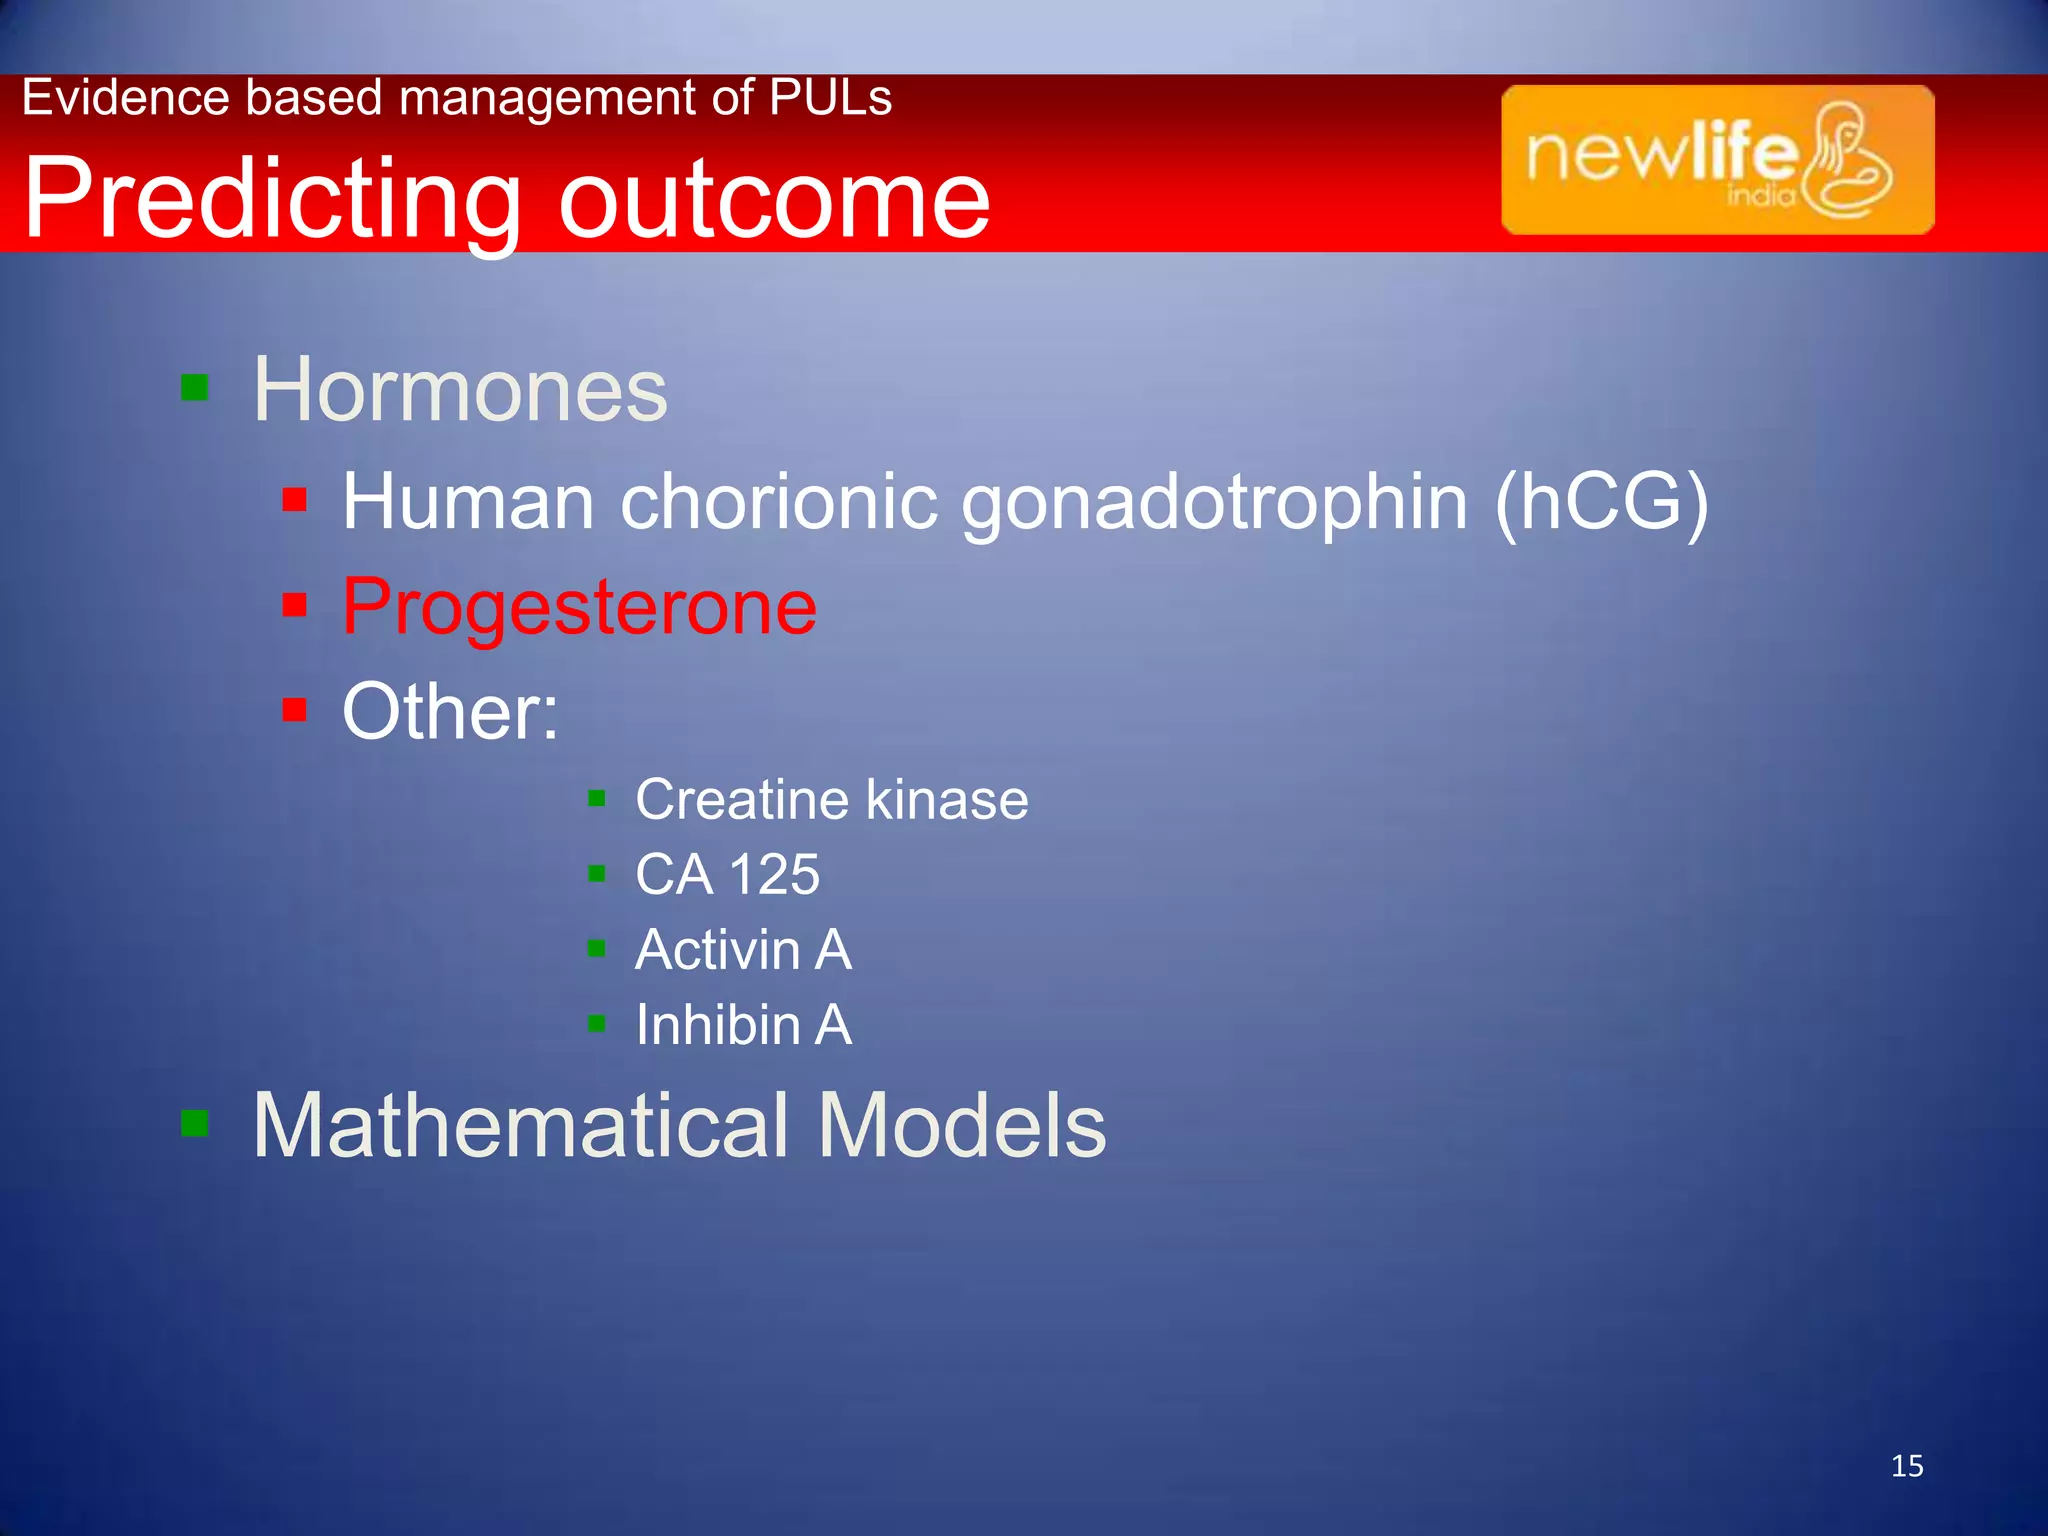
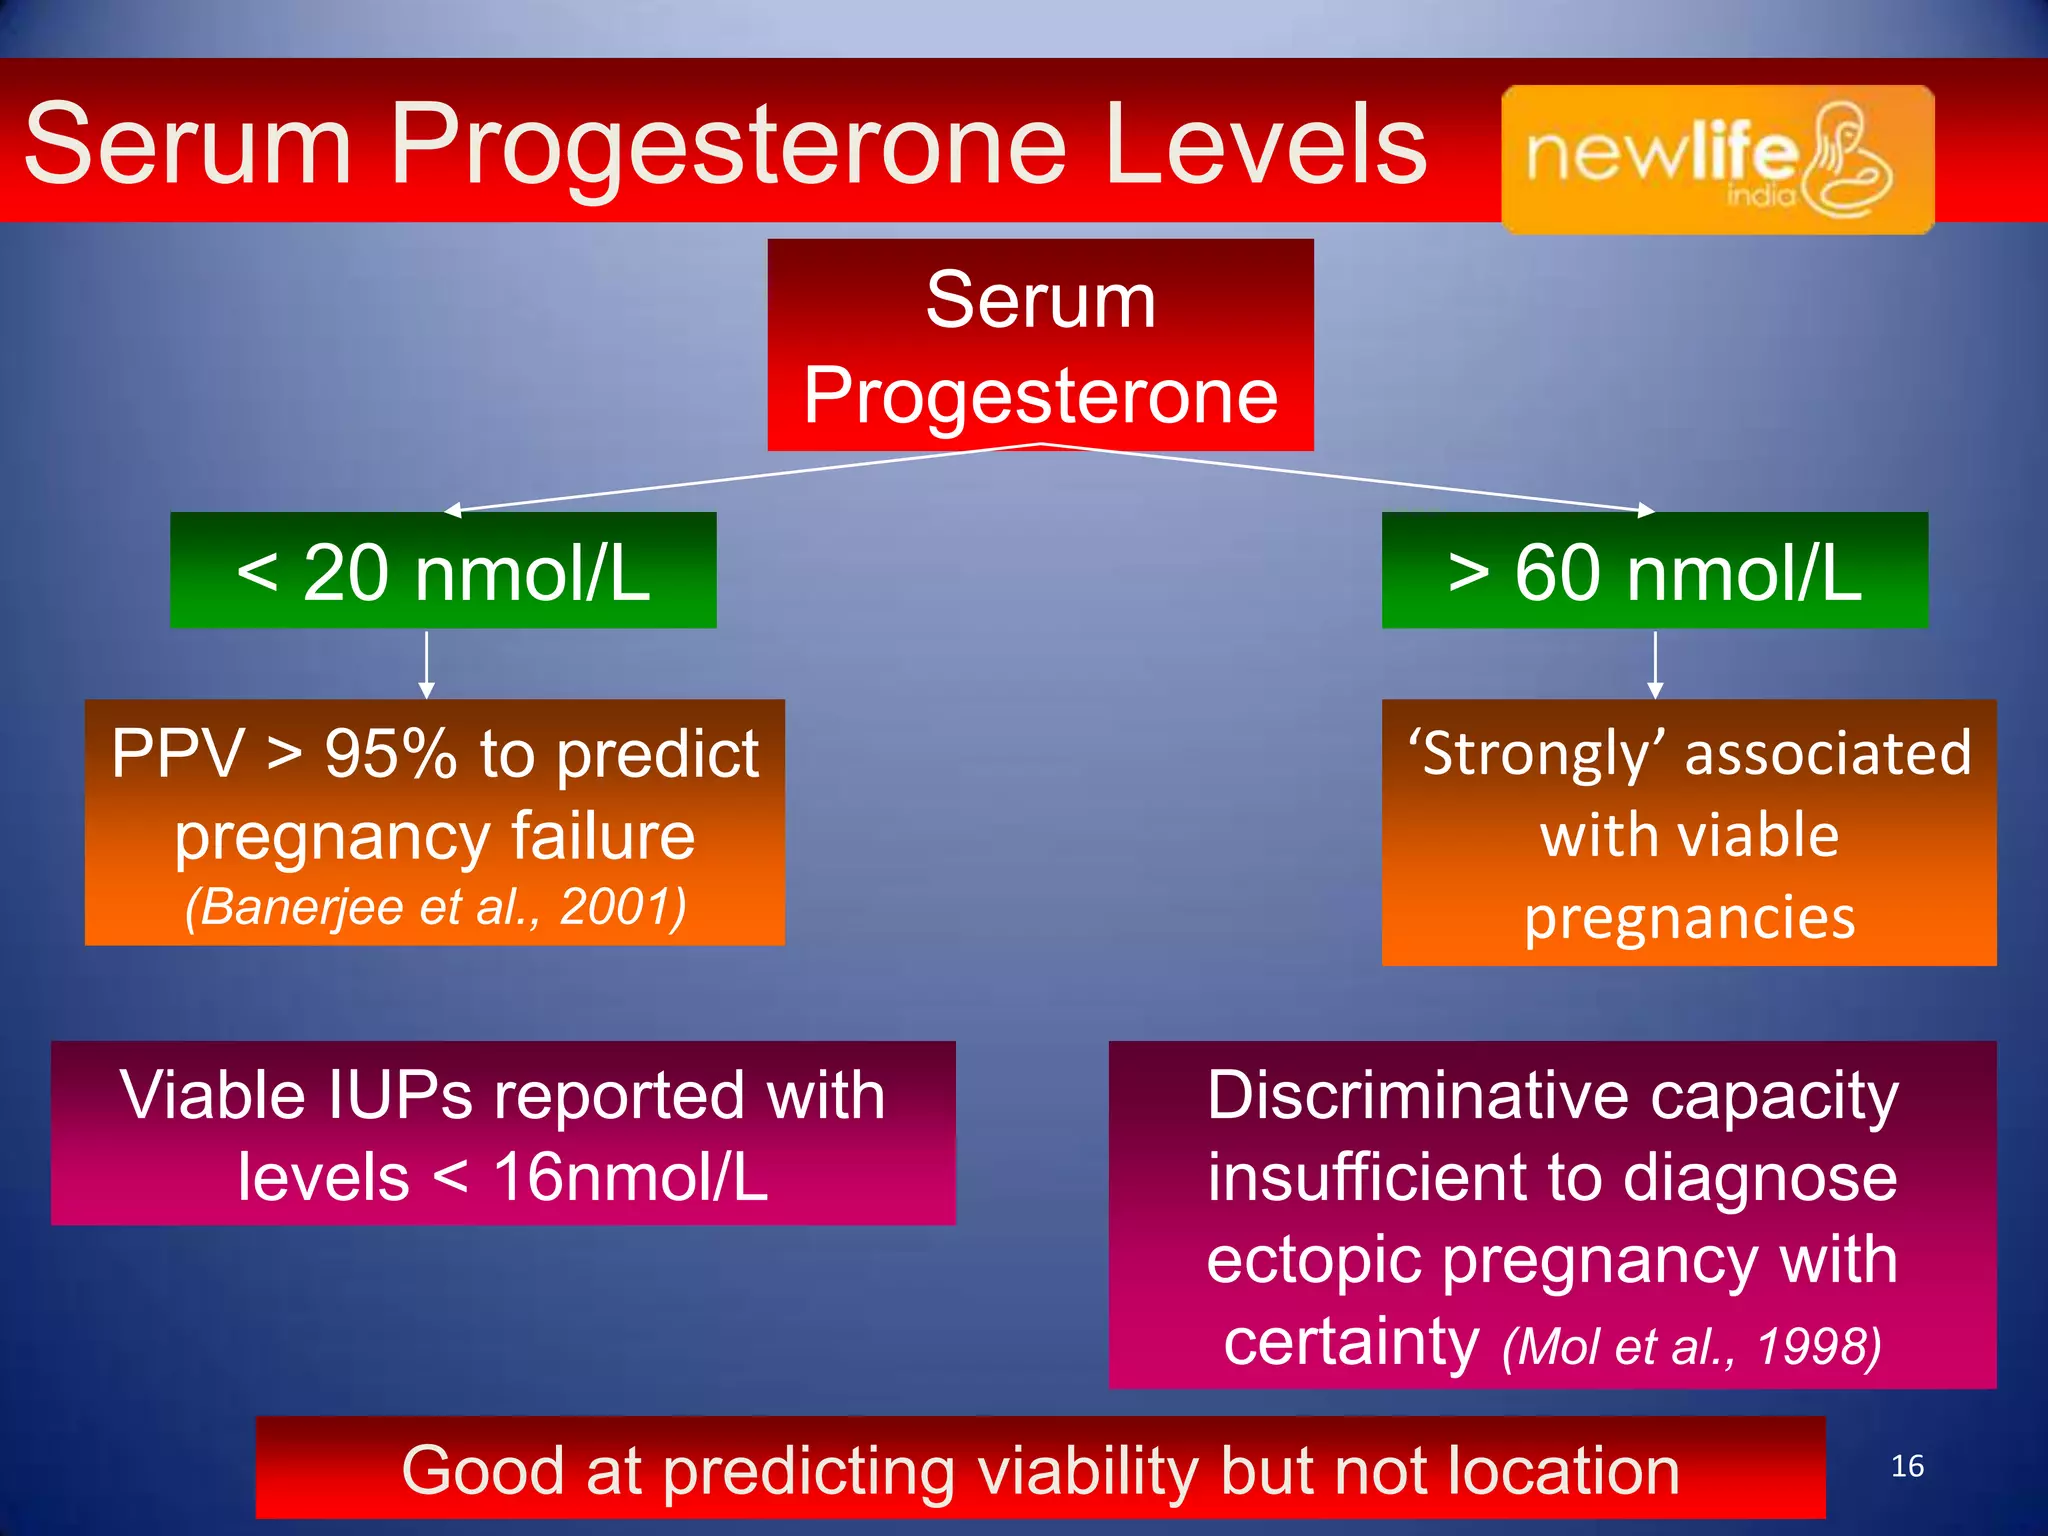
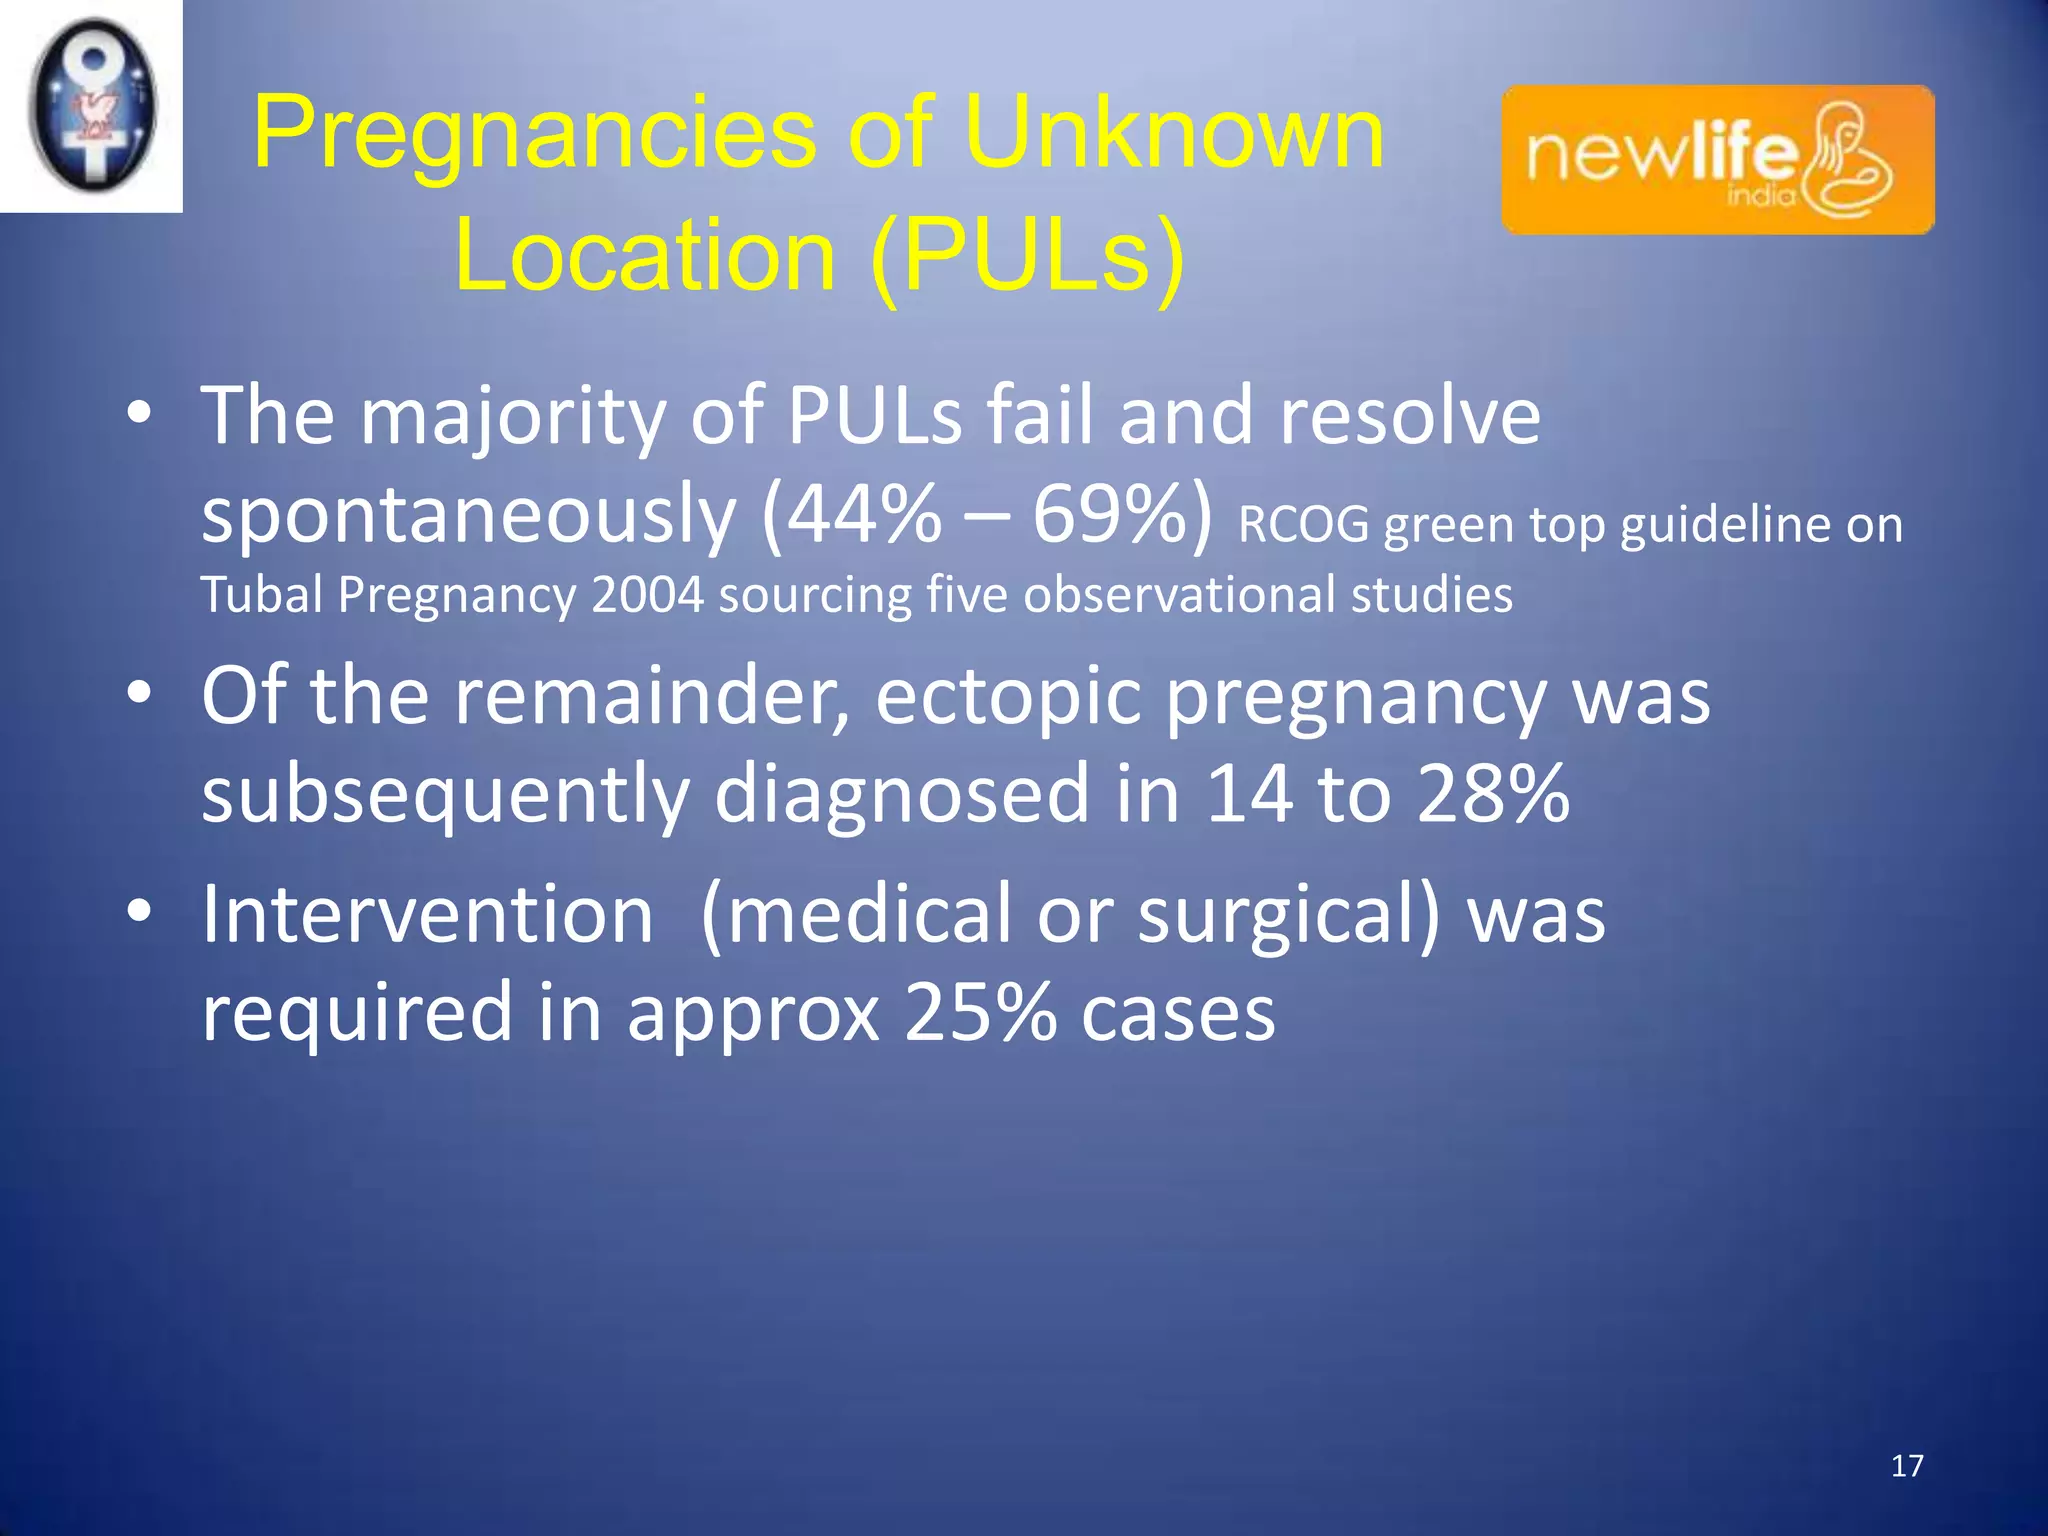
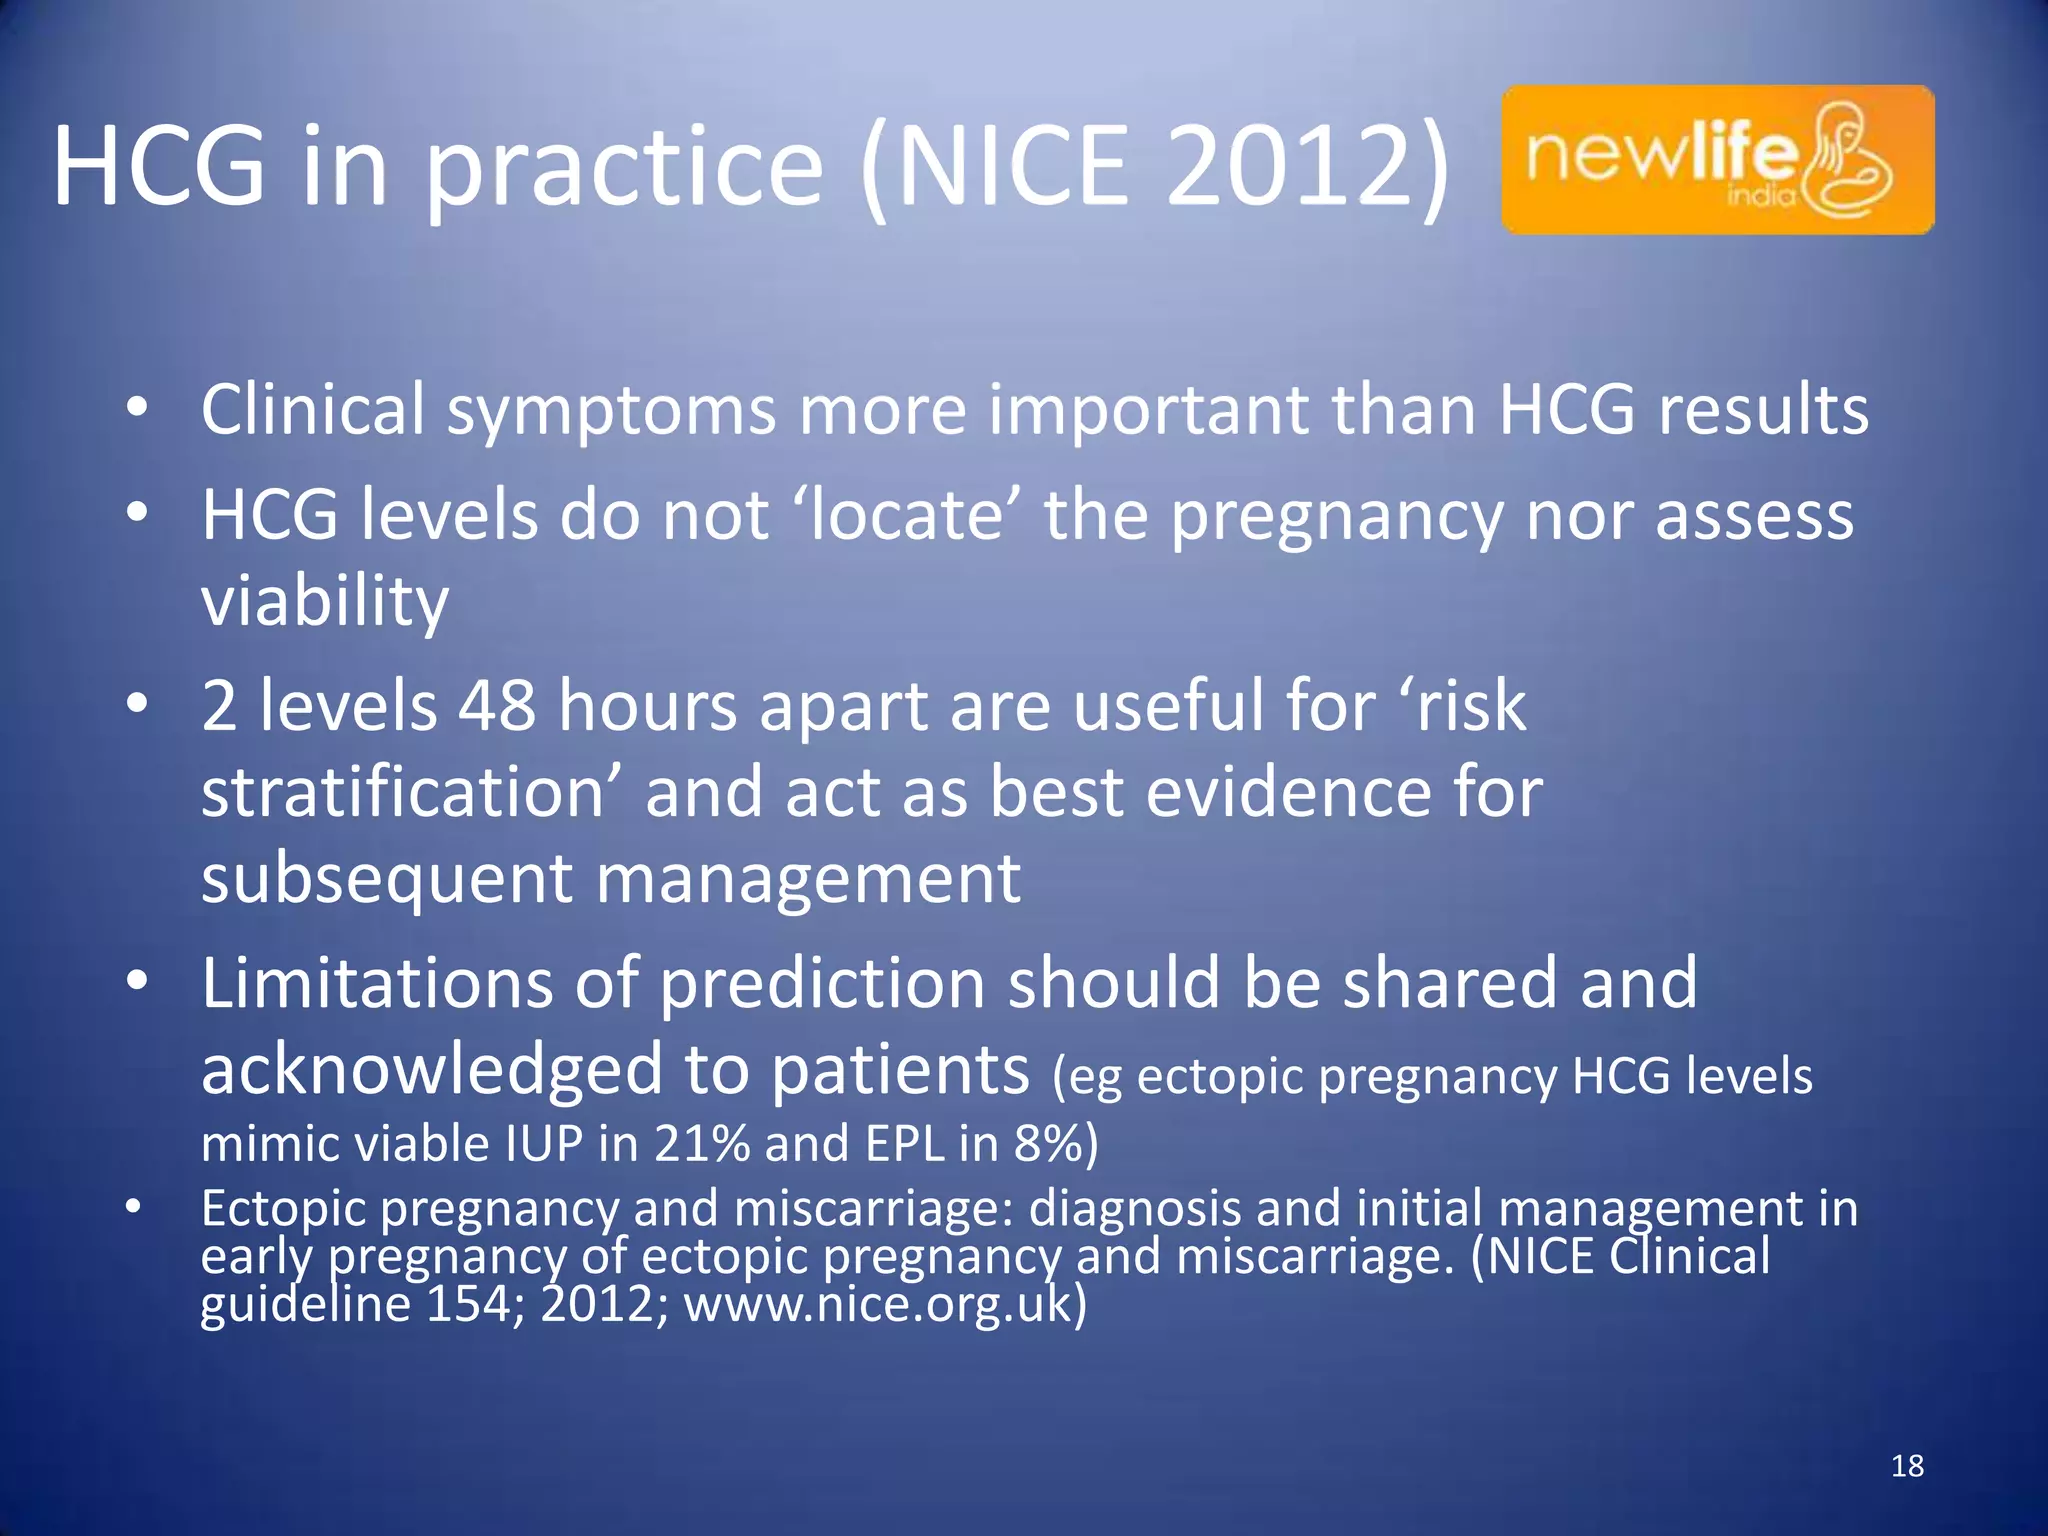
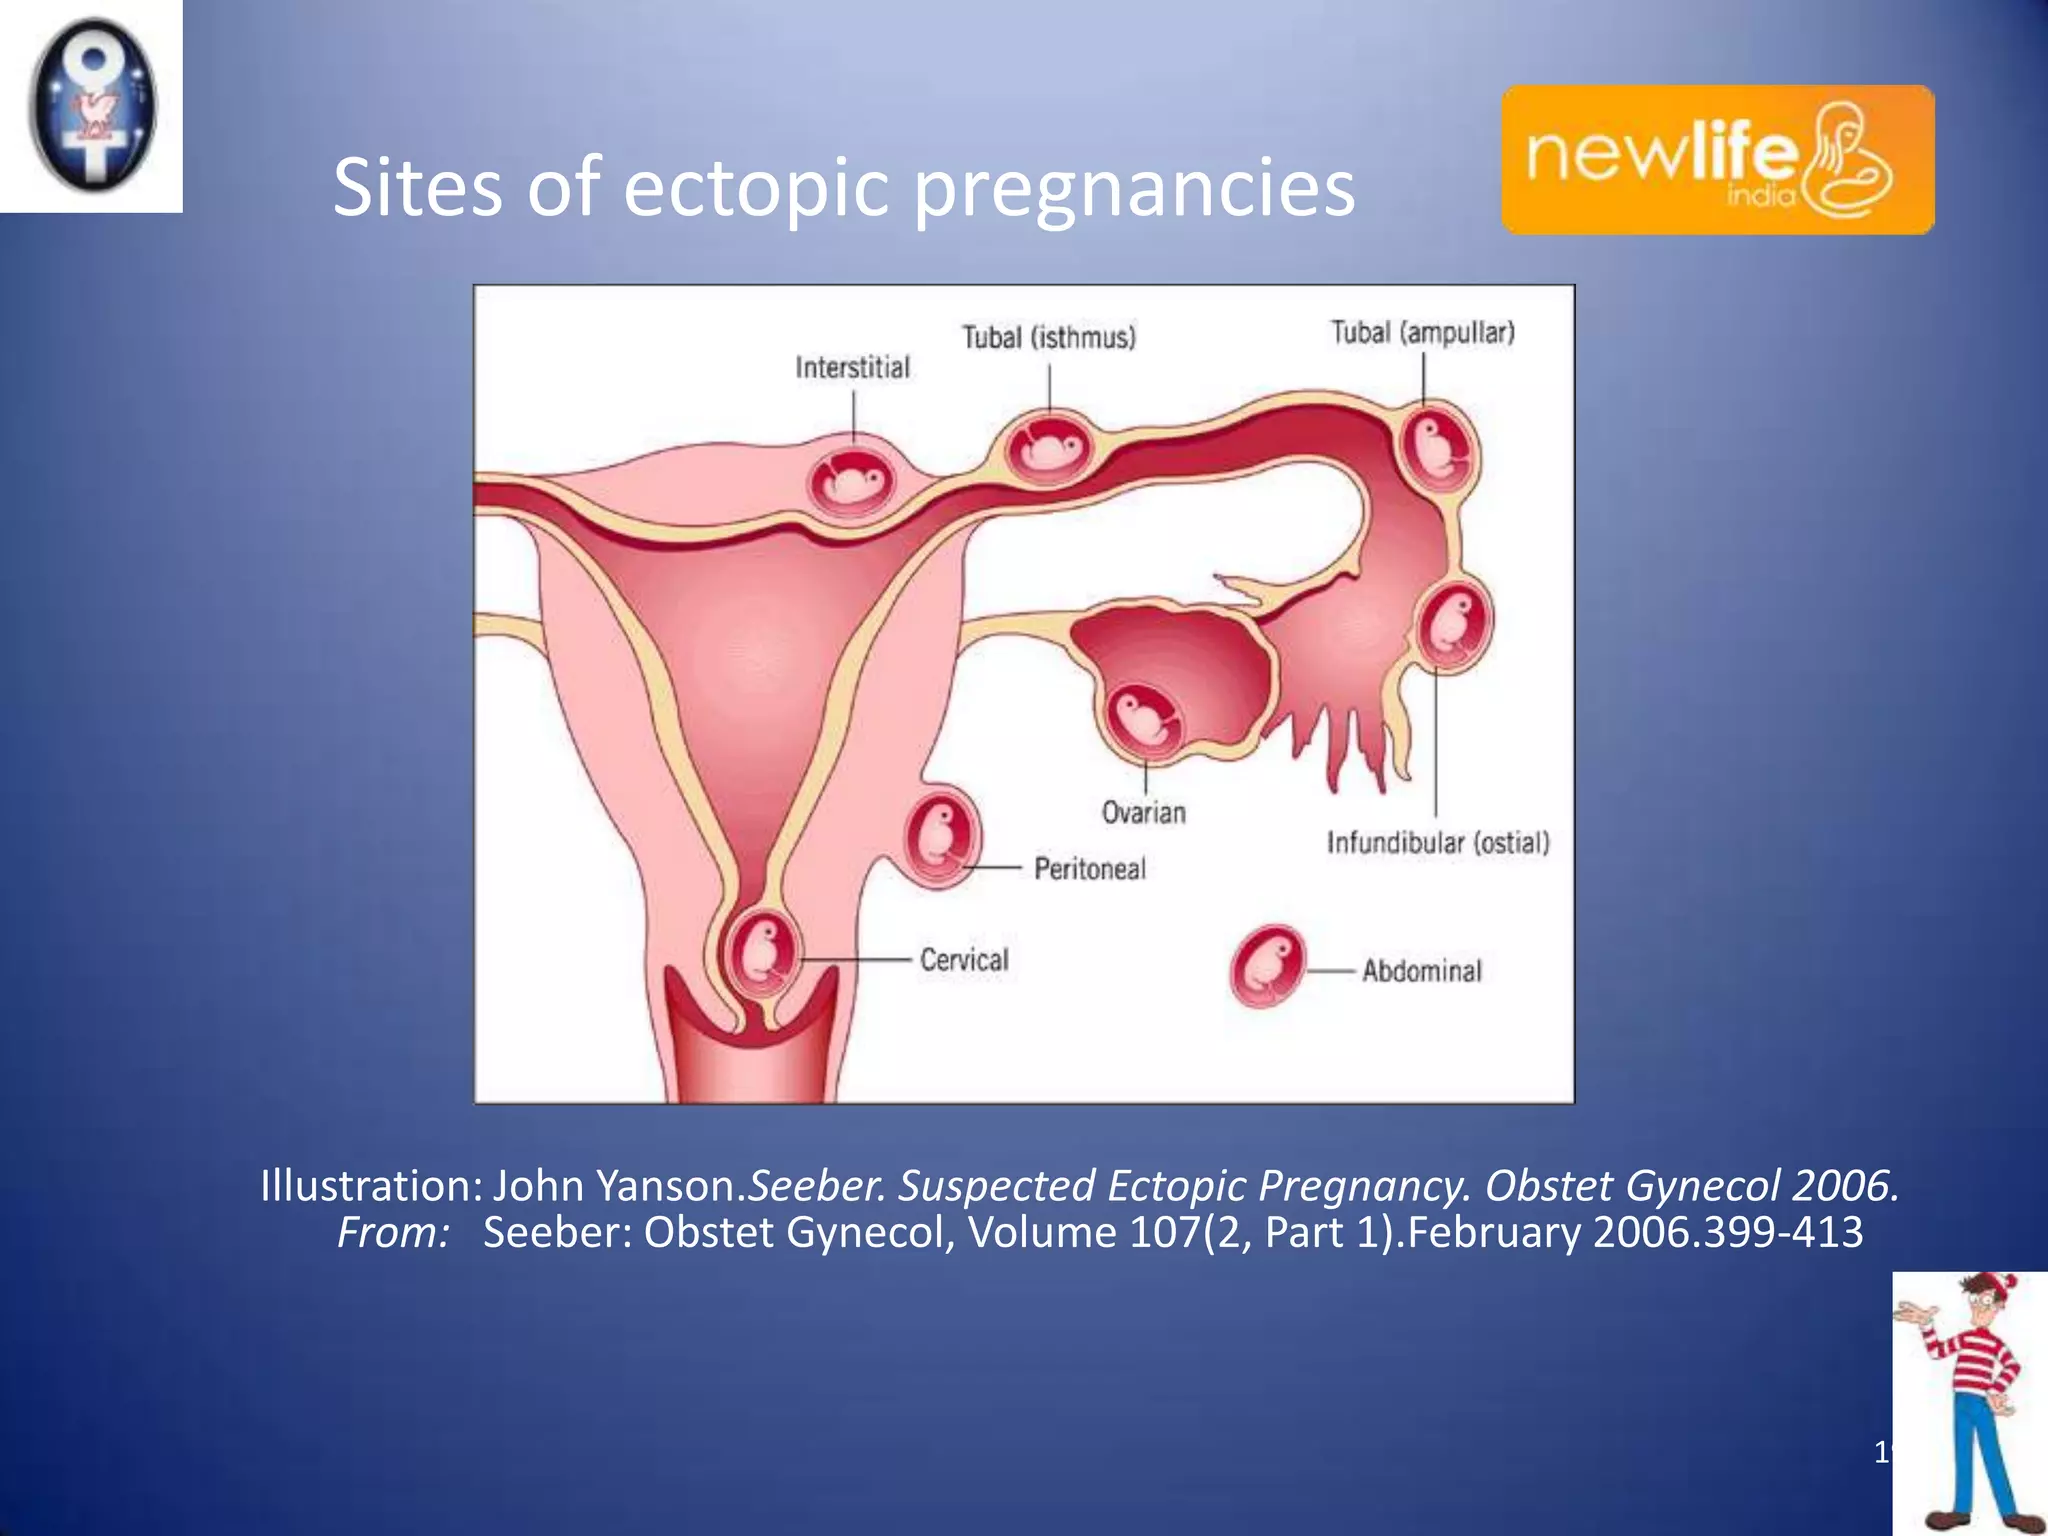

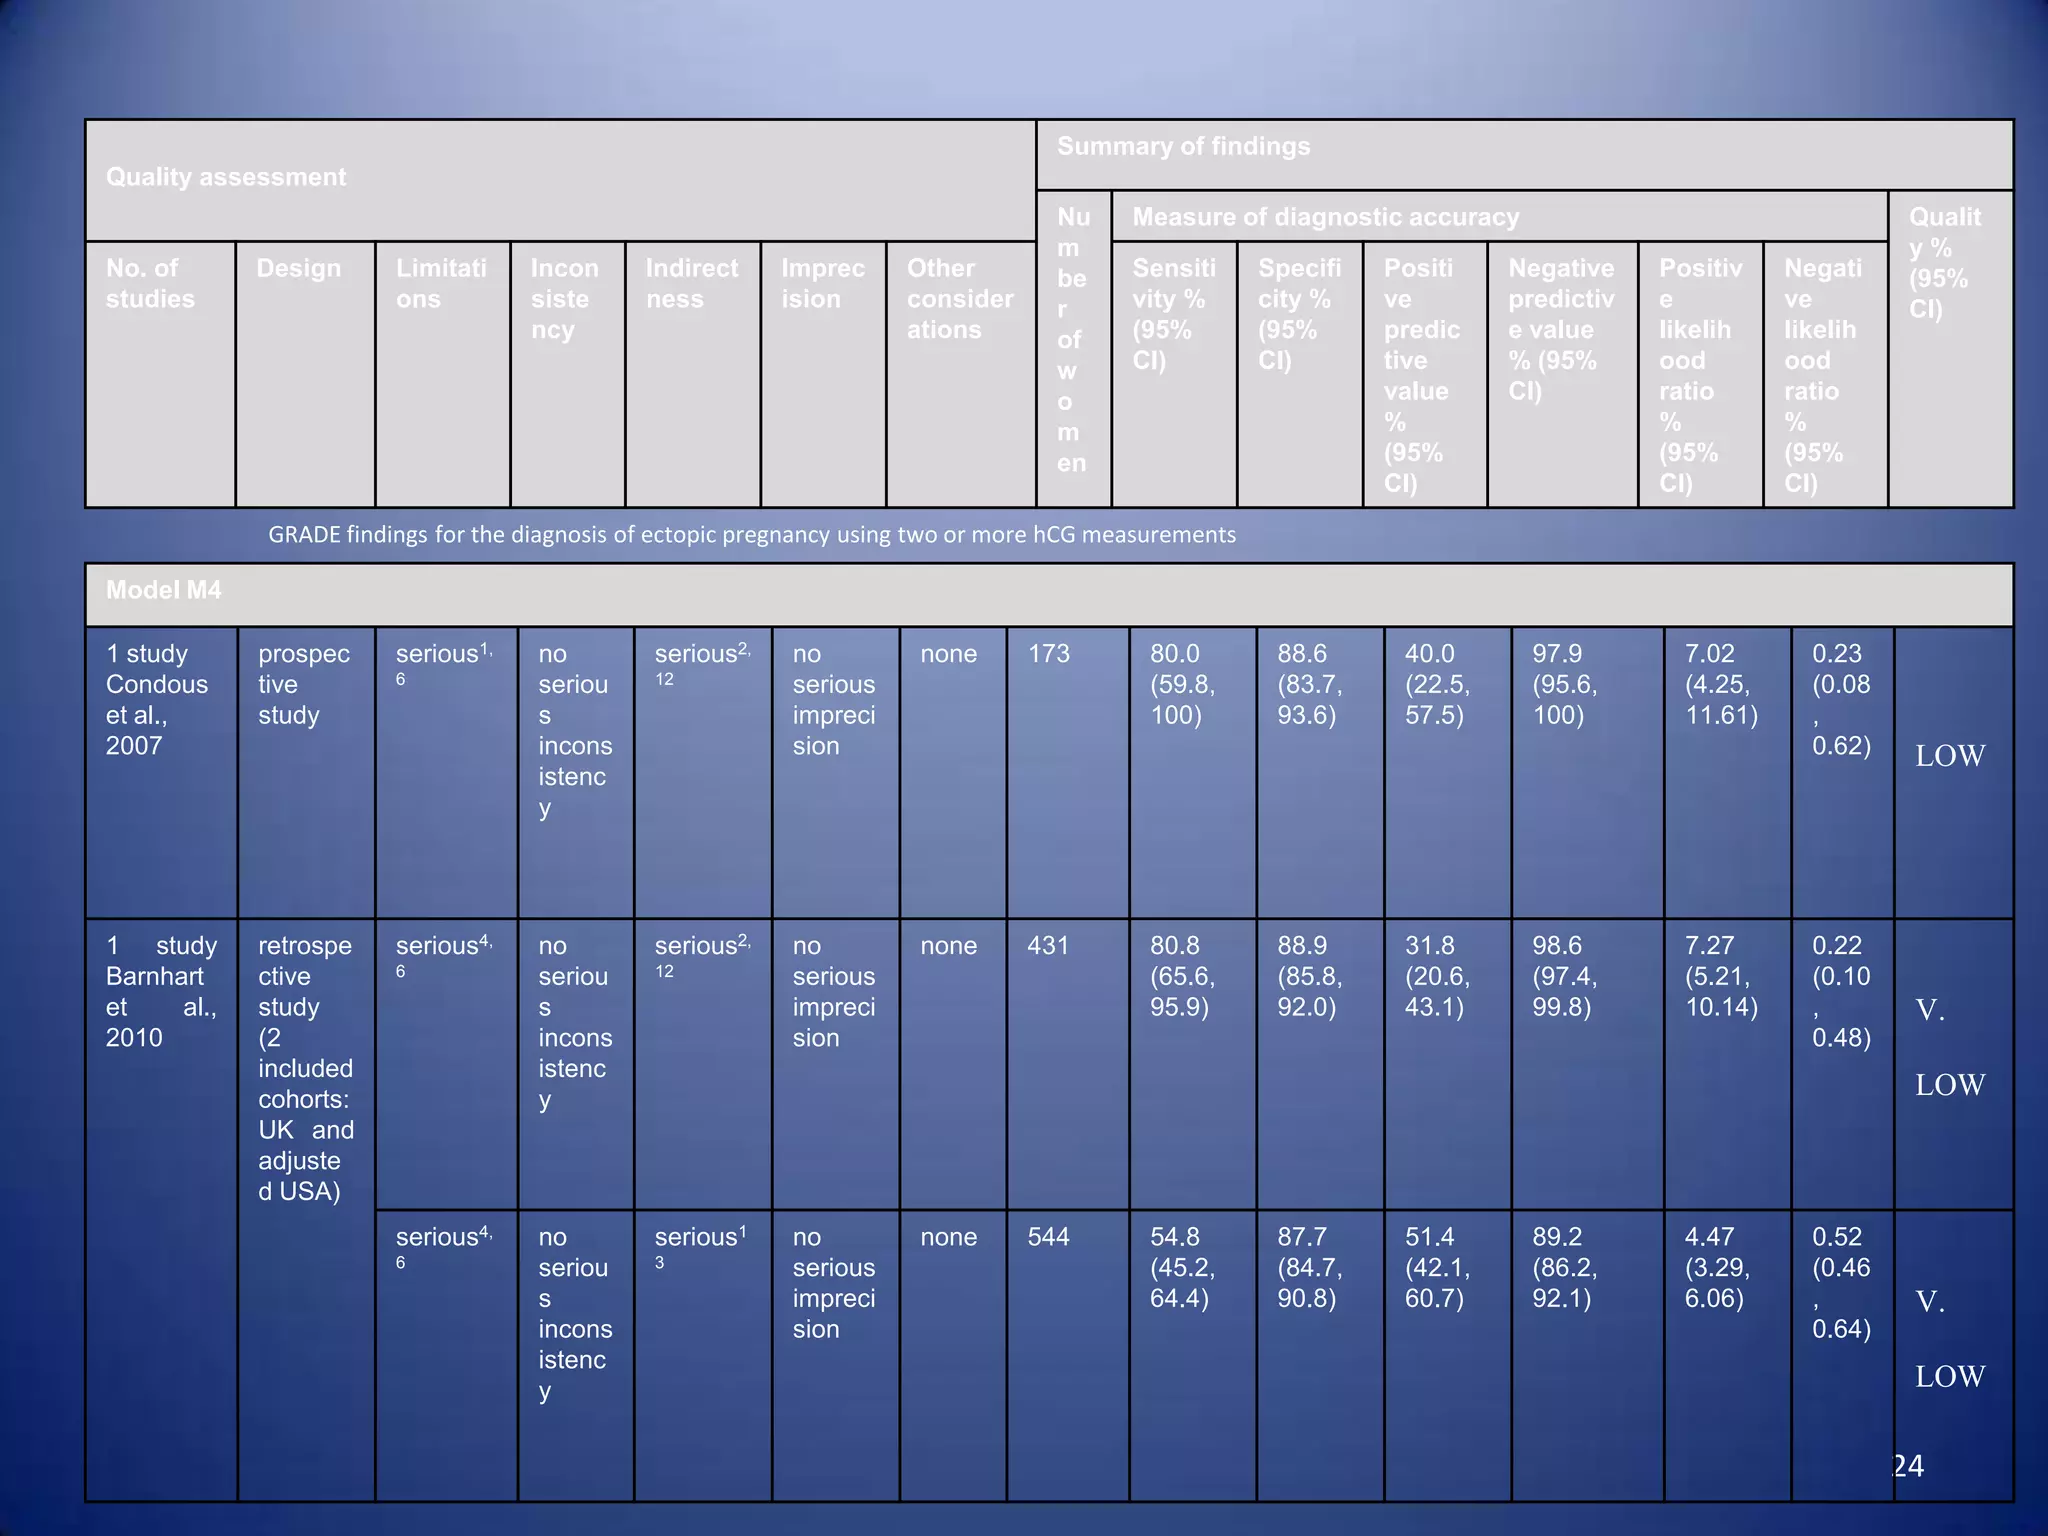
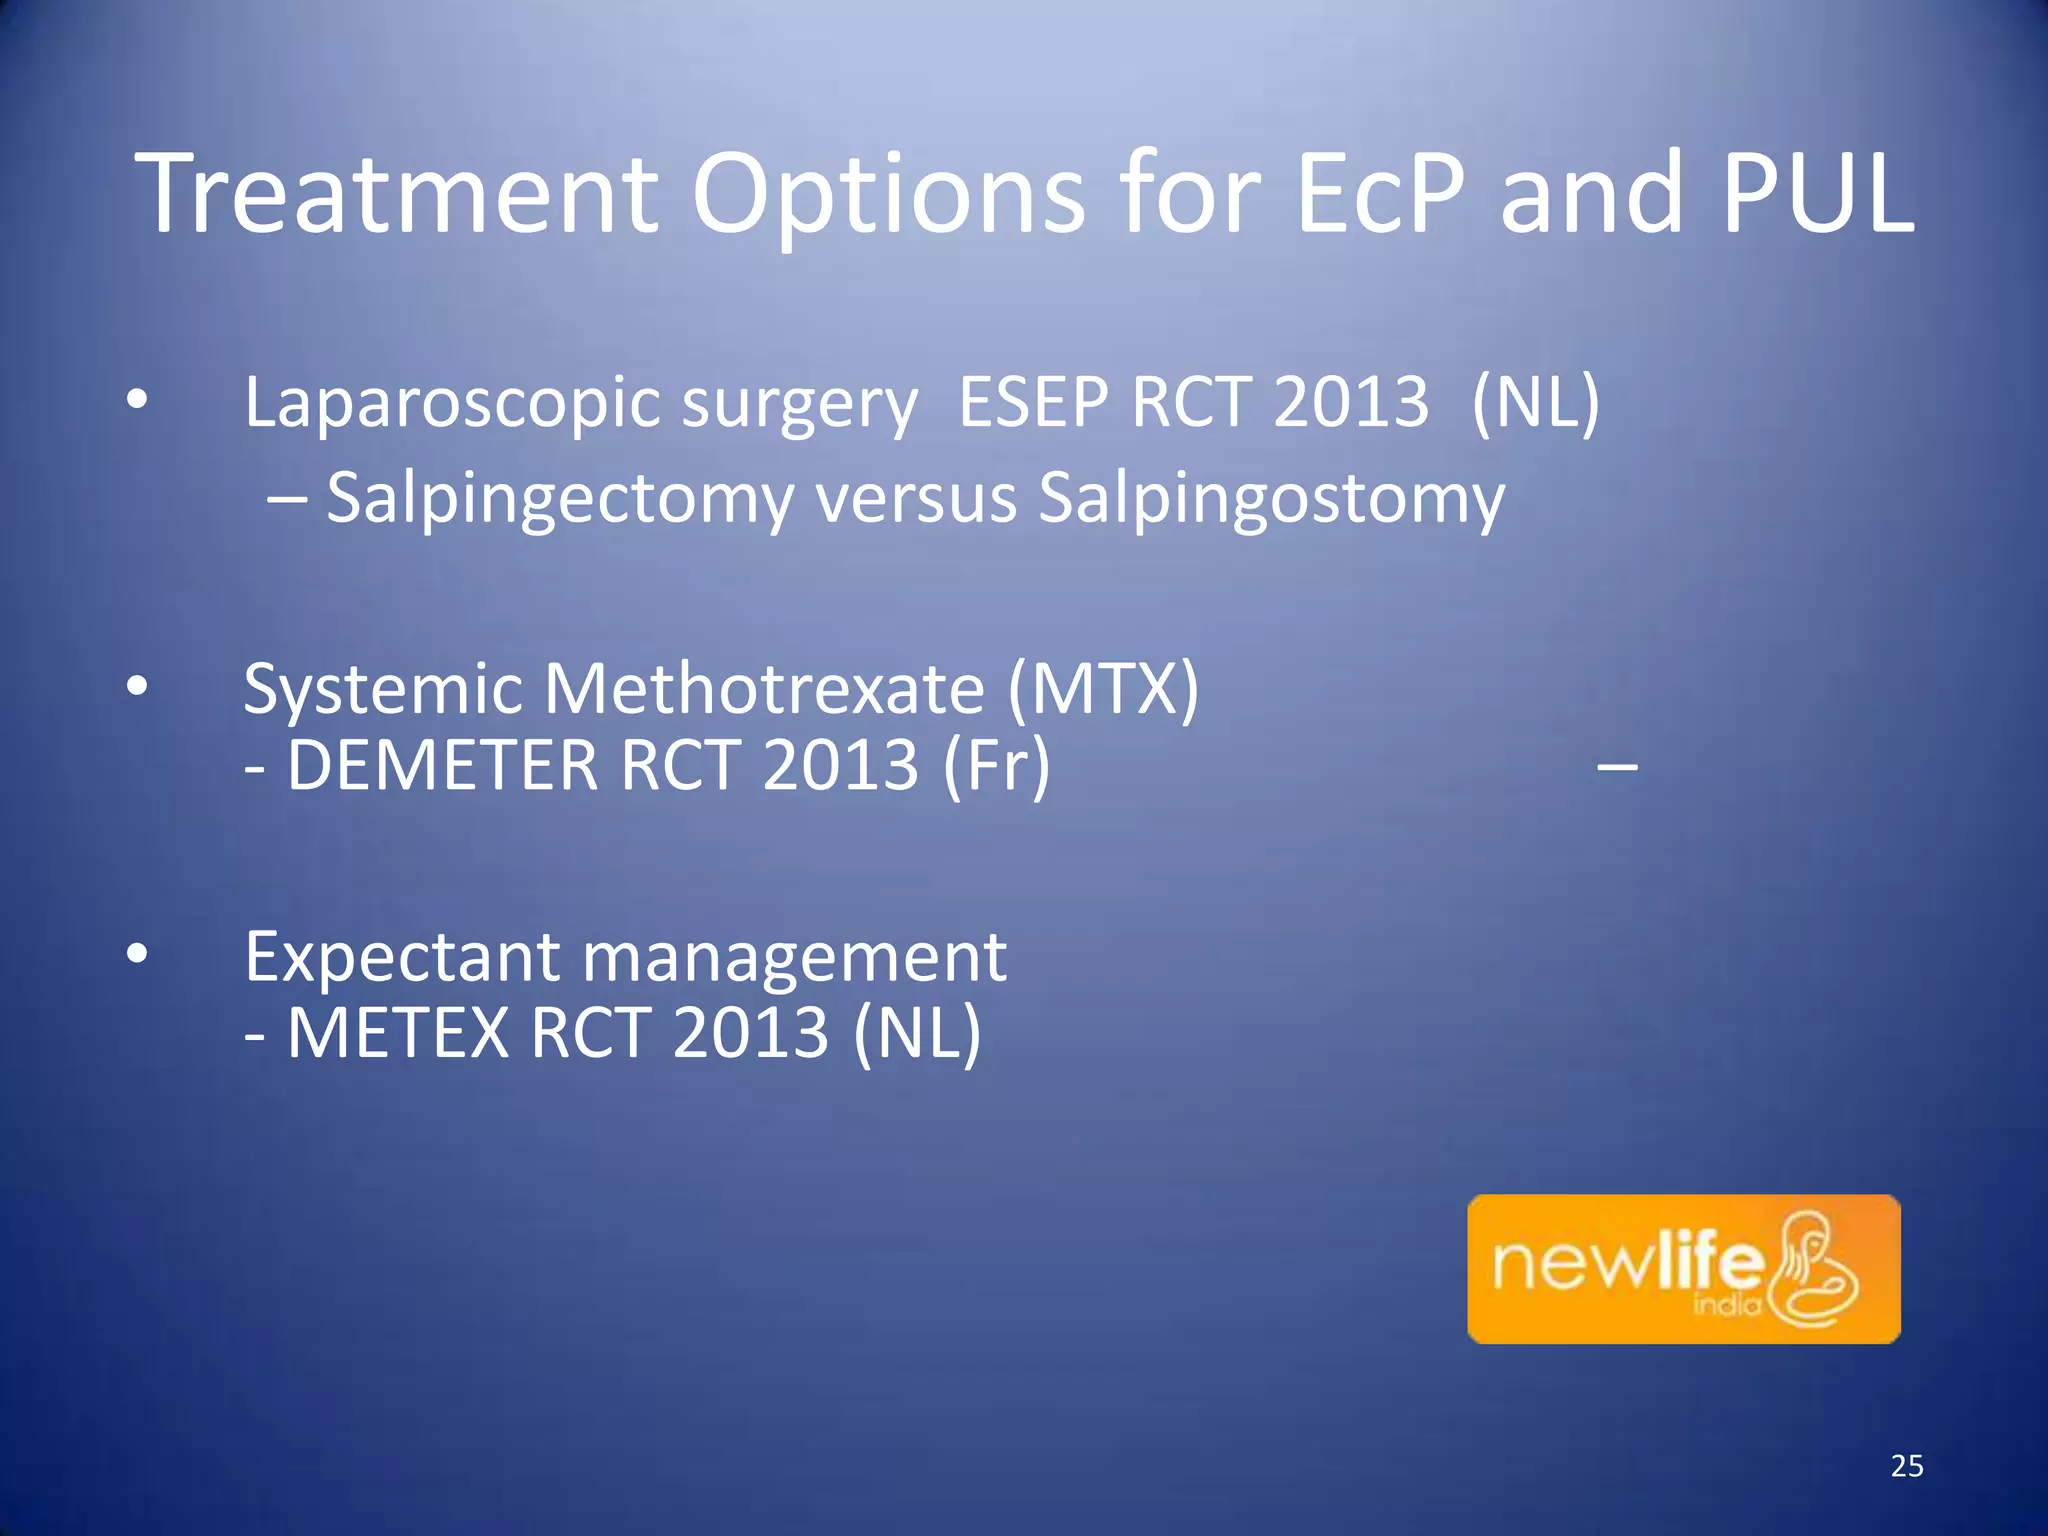
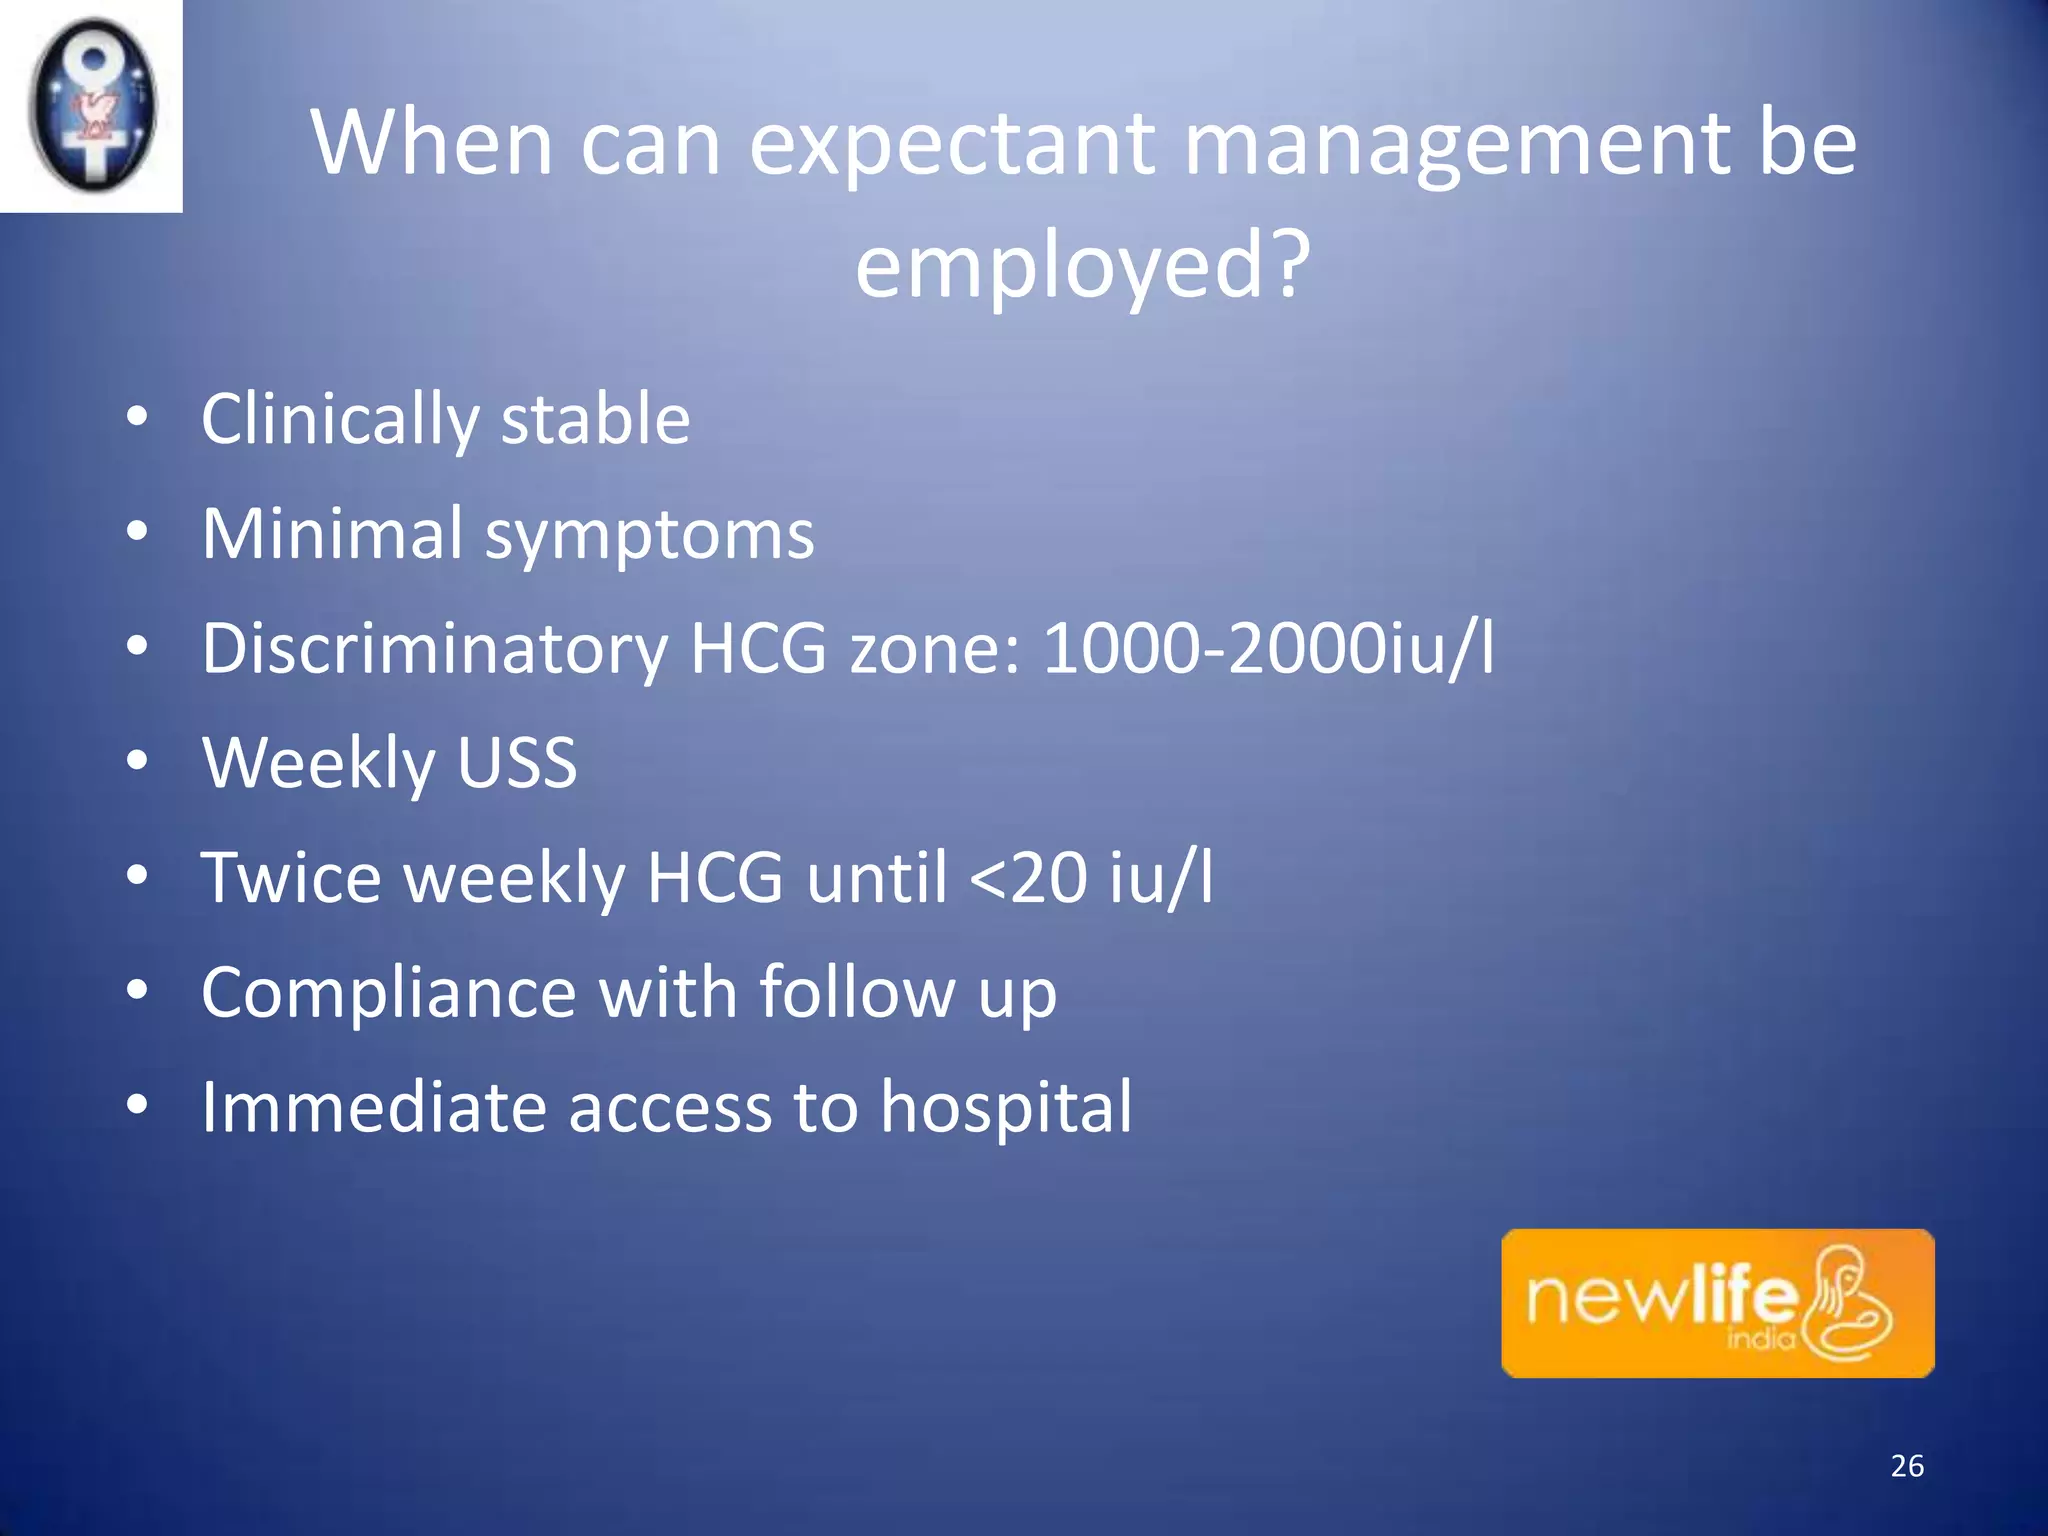
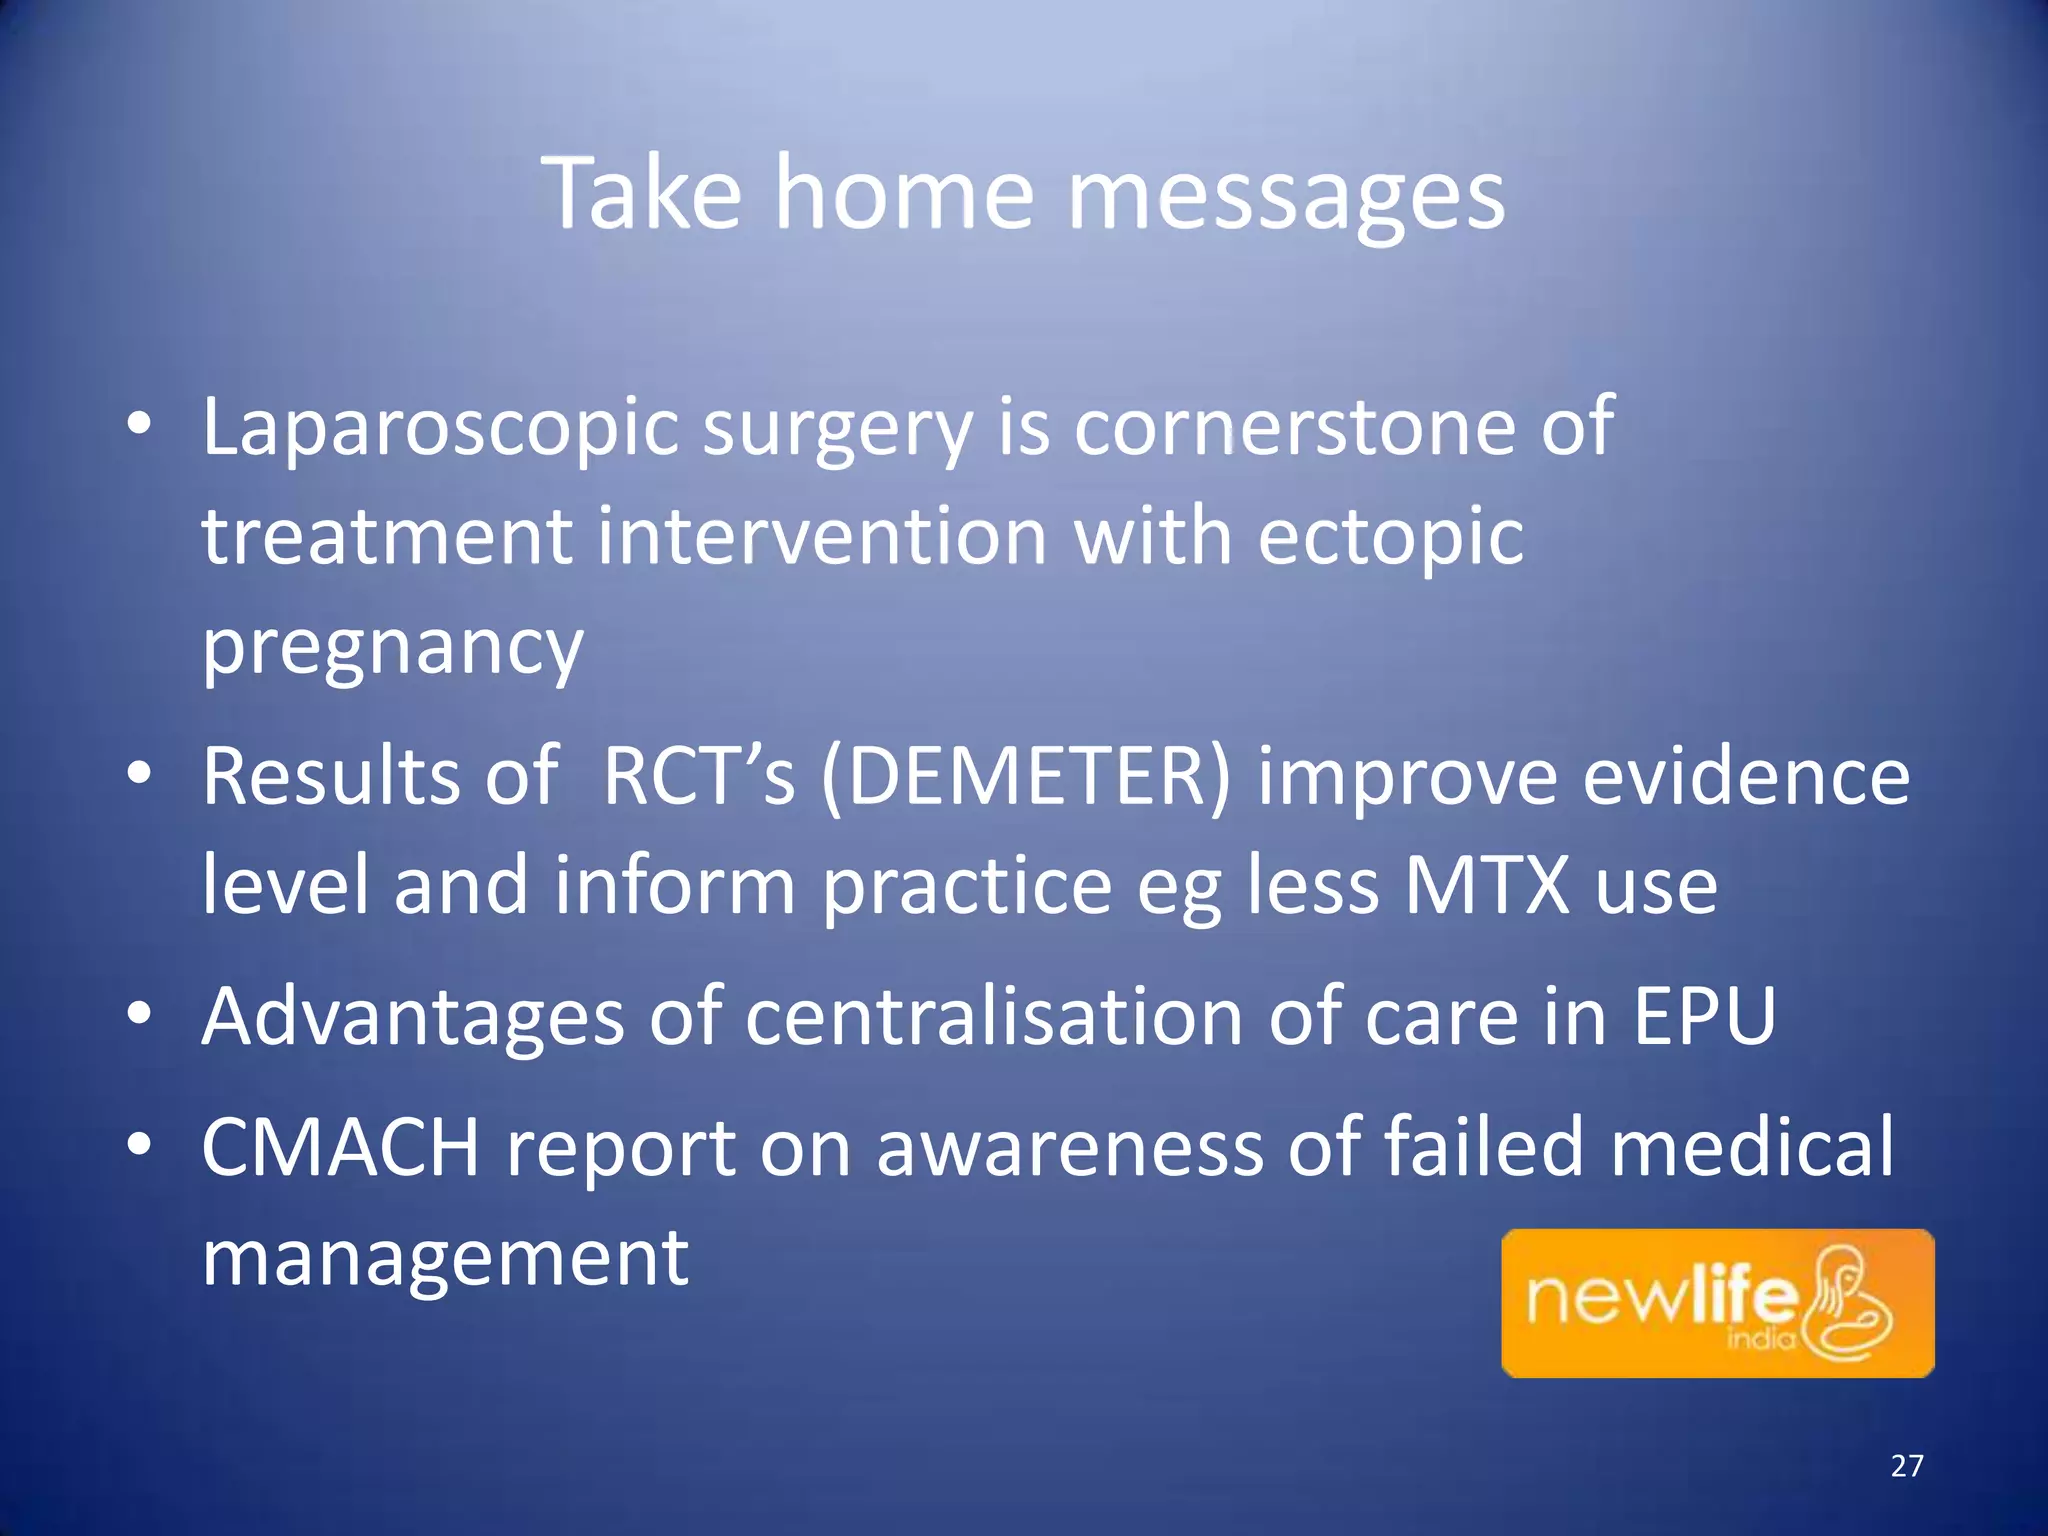


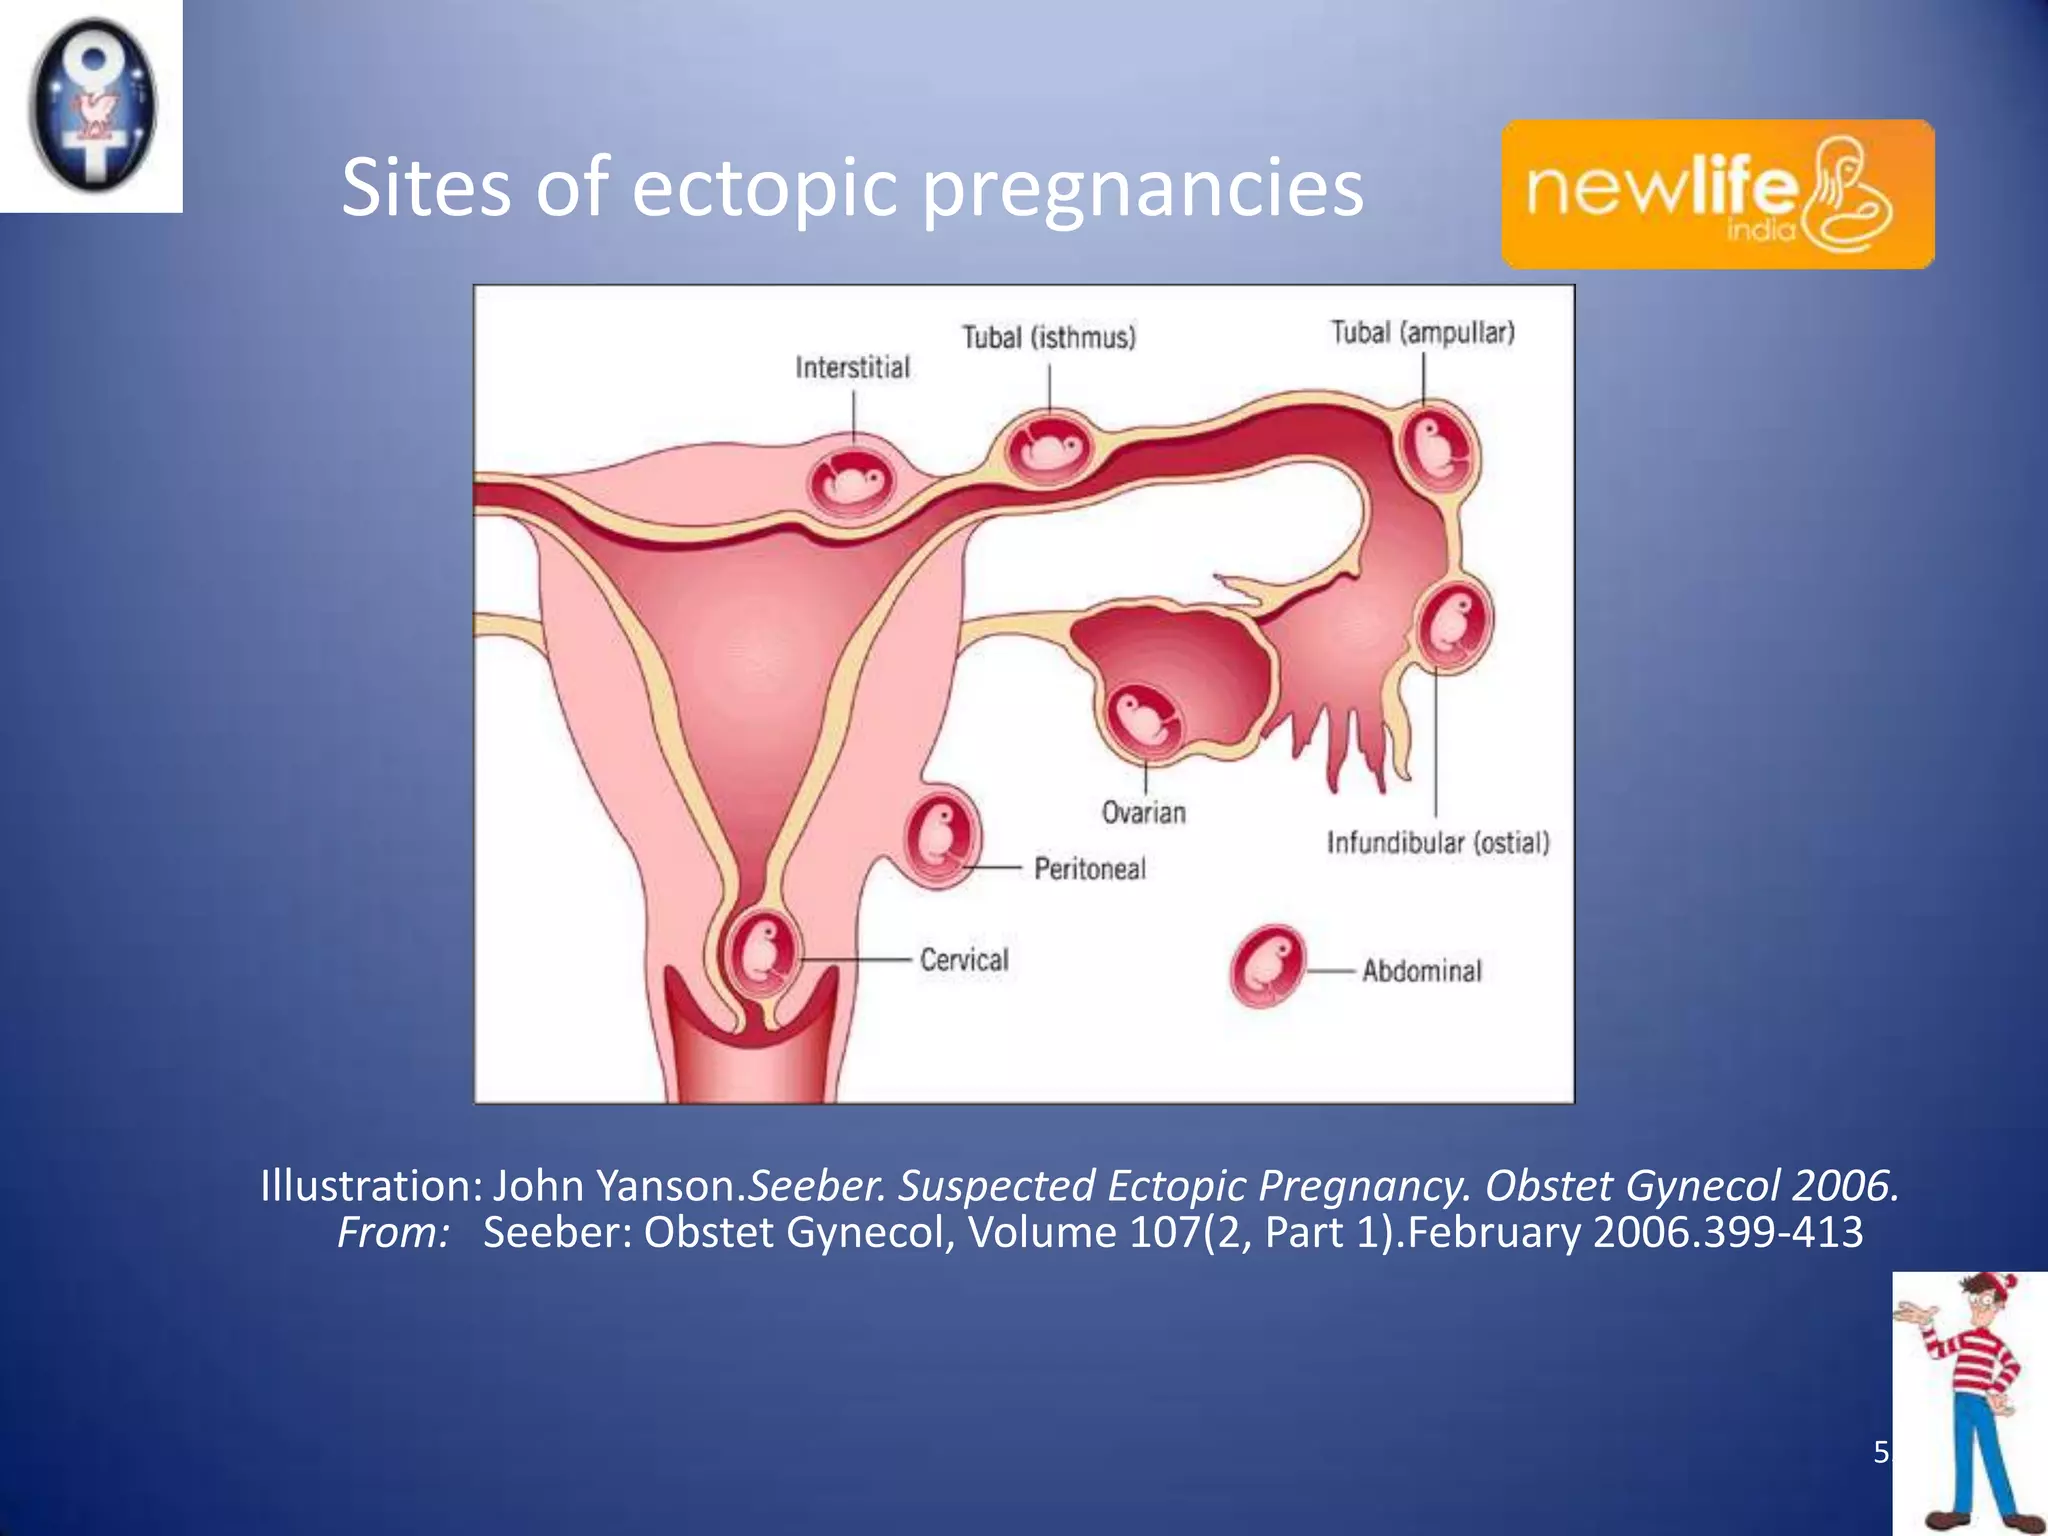

The document discusses the assessment and diagnosis of implantation failure, ectopic pregnancy, and miscarriage, highlighting limitations in current diagnostic methods and the importance of using relevant tests. It outlines various predictive modeling parameters, including the role of hormone levels such as human chorionic gonadotrophin (hcg) and progesterone in determining pregnancy outcomes. The author emphasizes the need for a practical and evidence-based approach for management while noting that a significant percentage of pregnancies of unknown location resolve spontaneously or require intervention.


