Download as PDF, PPTX
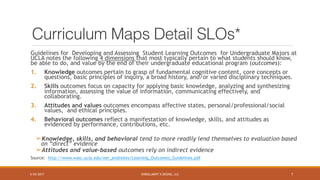
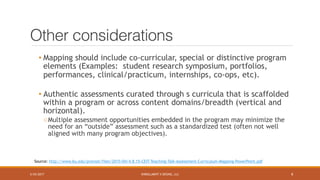

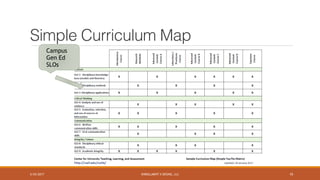
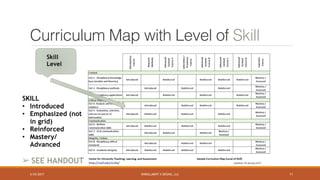
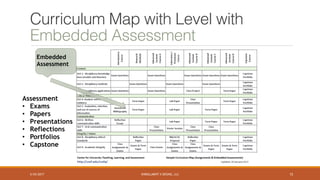
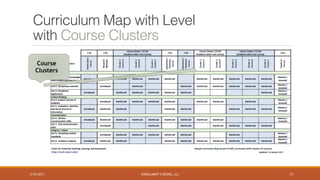
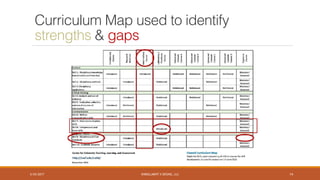
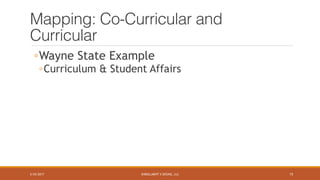


This document discusses curriculum mapping, which involves clarifying and assessing the relationships between curricular and co-curricular activities, courses, and programs. It provides an overview of curriculum mapping, including its benefits and key aspects. The presentation covers the mapping process, analyzing maps, and includes examples of course-level and program-level maps. It emphasizes that mapping can align instruction with learning outcomes, reveal gaps, and improve program coherence.