Download to read offline

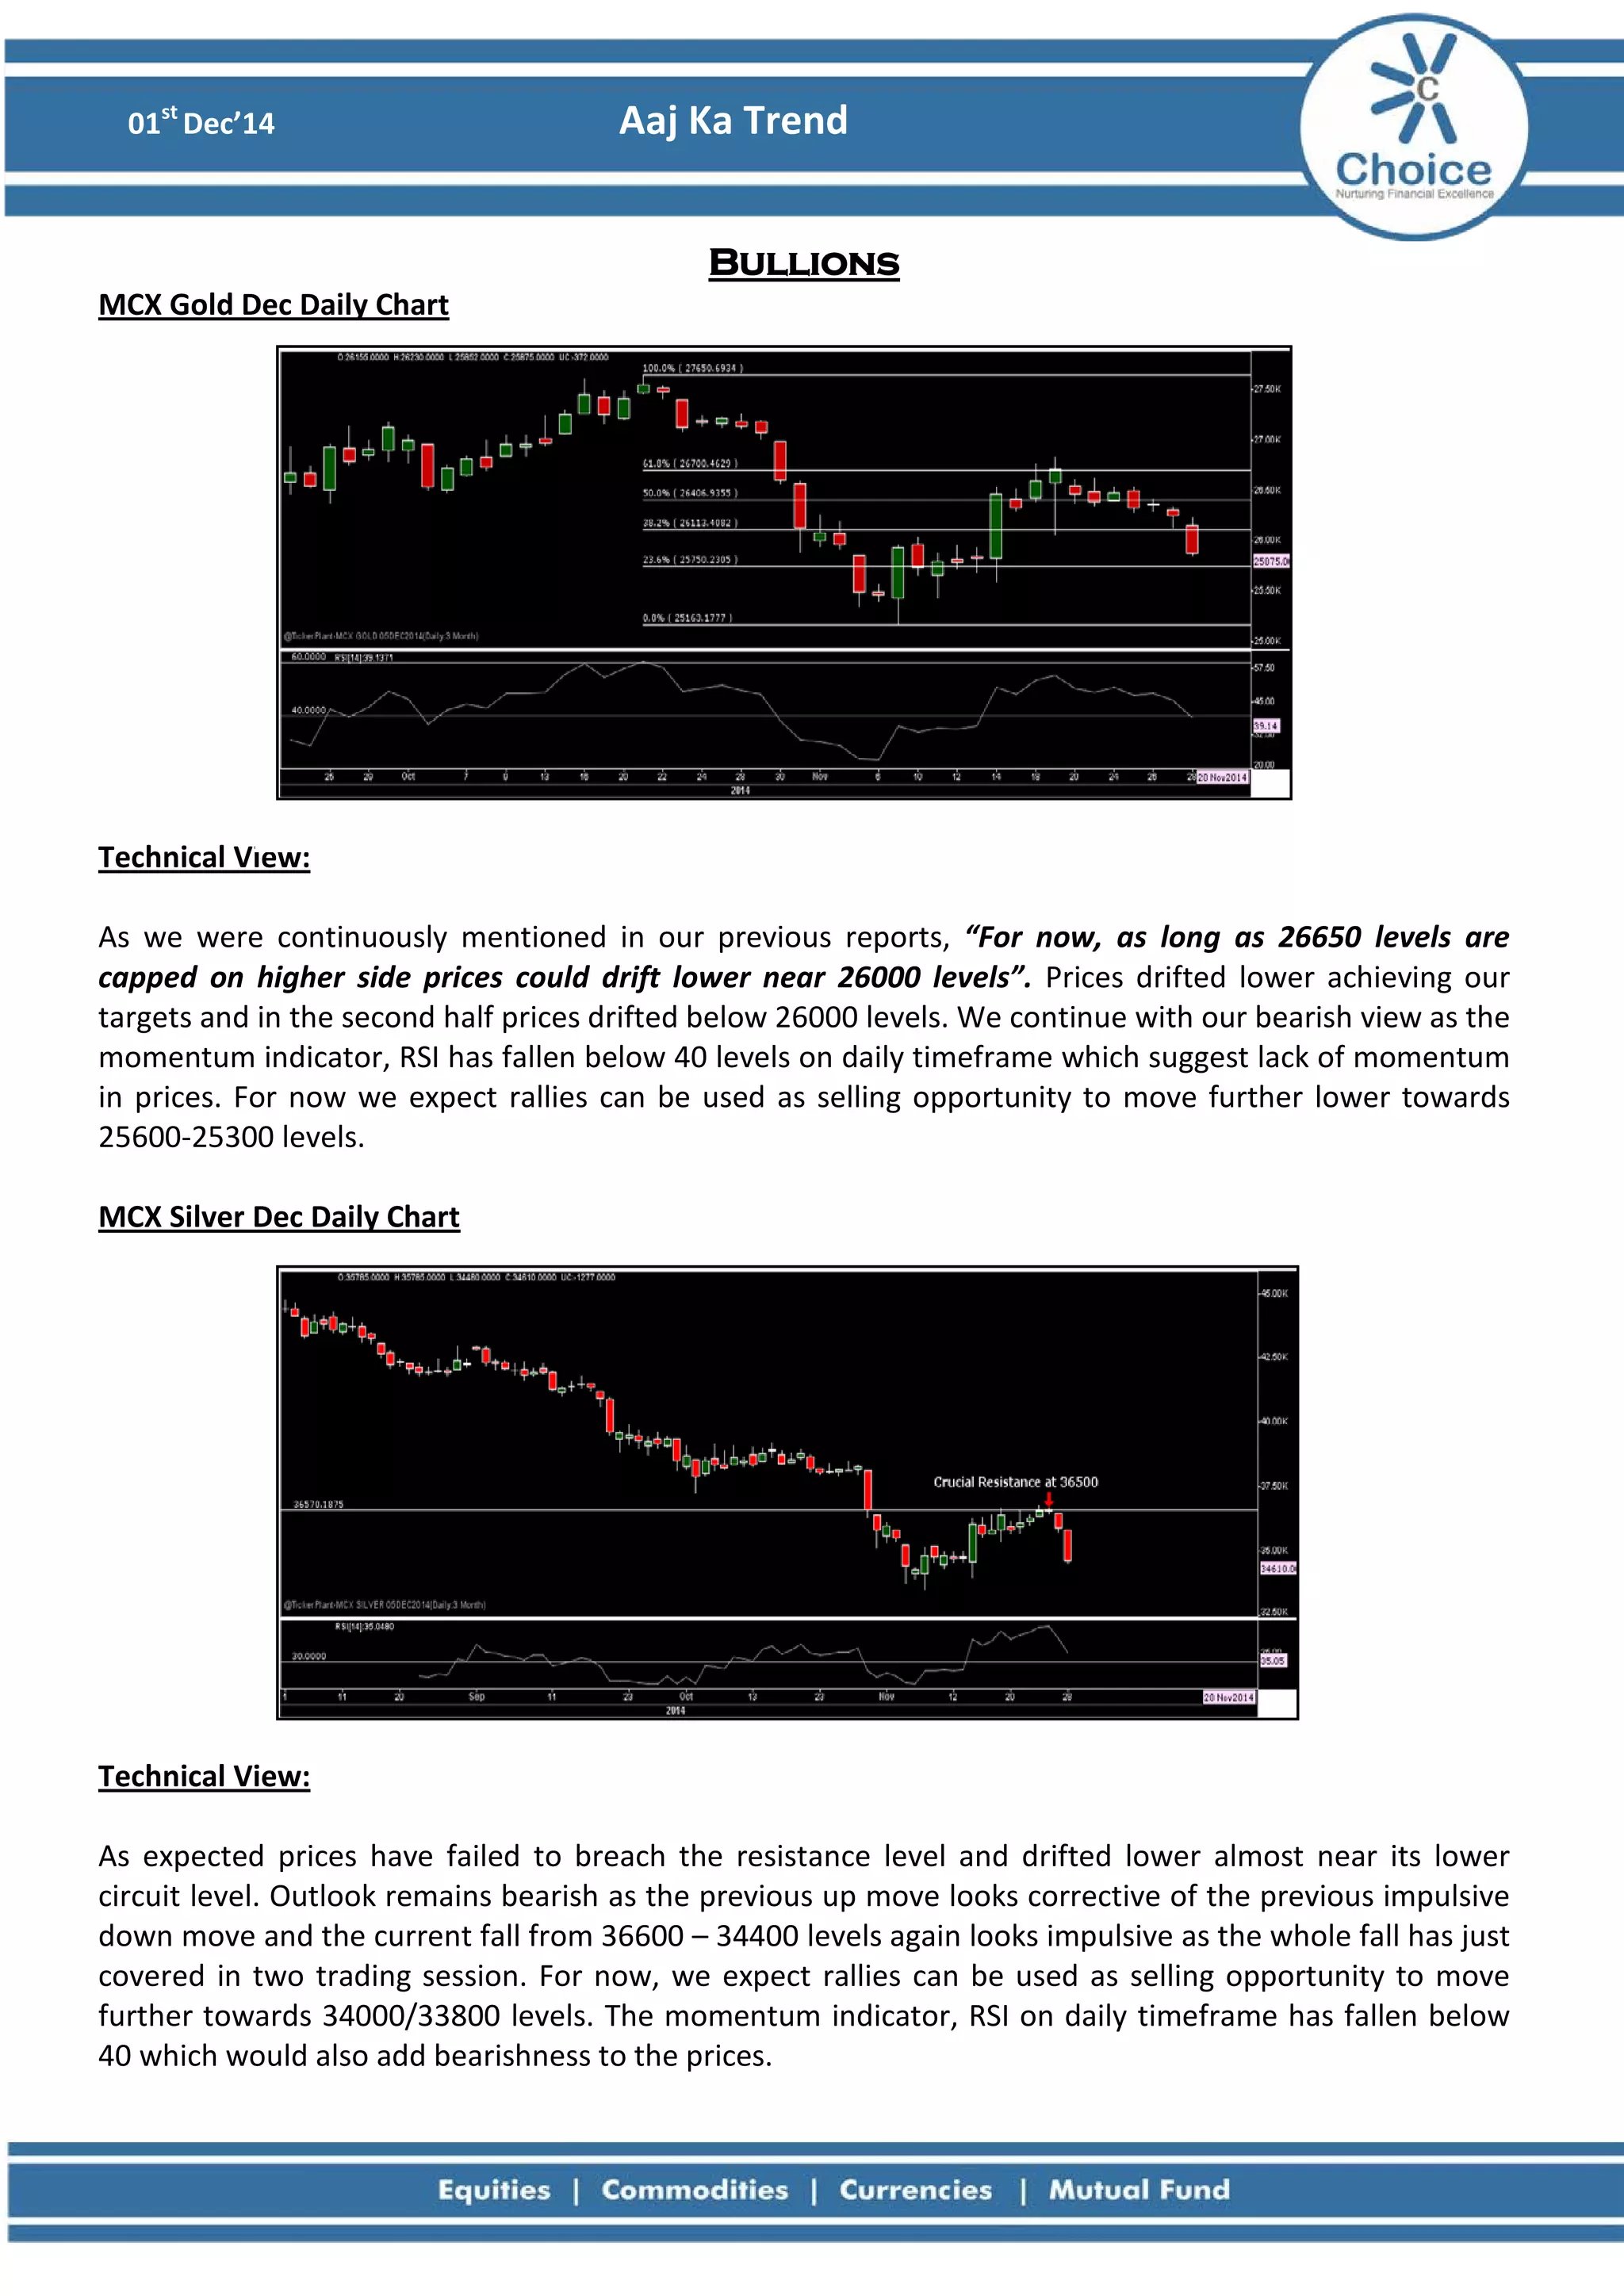
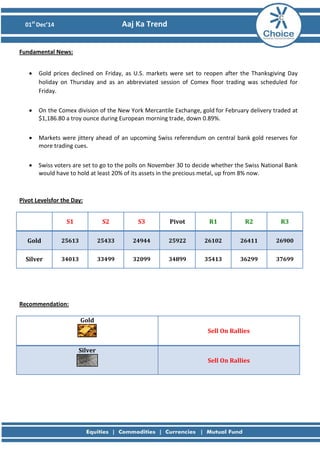
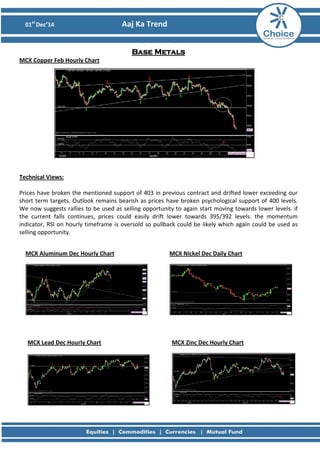
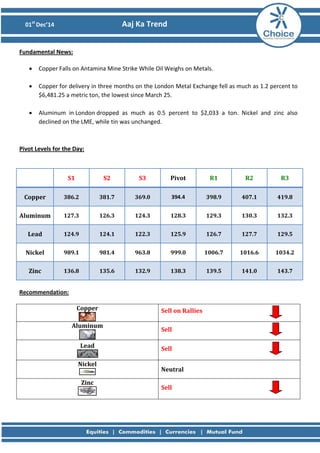
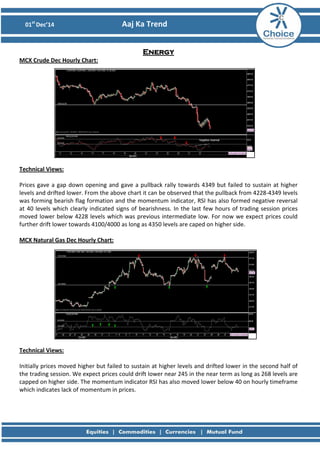
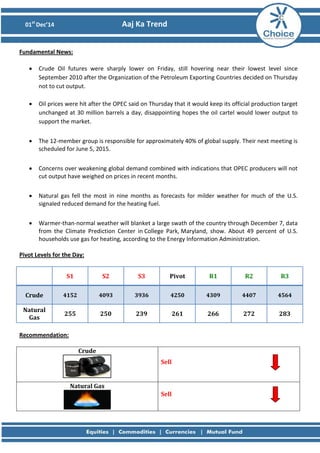

The document provides a daily technical analysis of trends in bullions, base metals and energy commodities trading on the MCX exchange in India on 1st December 2014. It notes bearish trends across gold, silver, copper, crude oil and natural gas based on price breaks and momentum indicator levels. Selling opportunities are recommended on rallies for most commodities. Fundamental factors like an OPEC decision not to cut oil output and forecasts of mild weather weighing on natural gas prices are also discussed.


