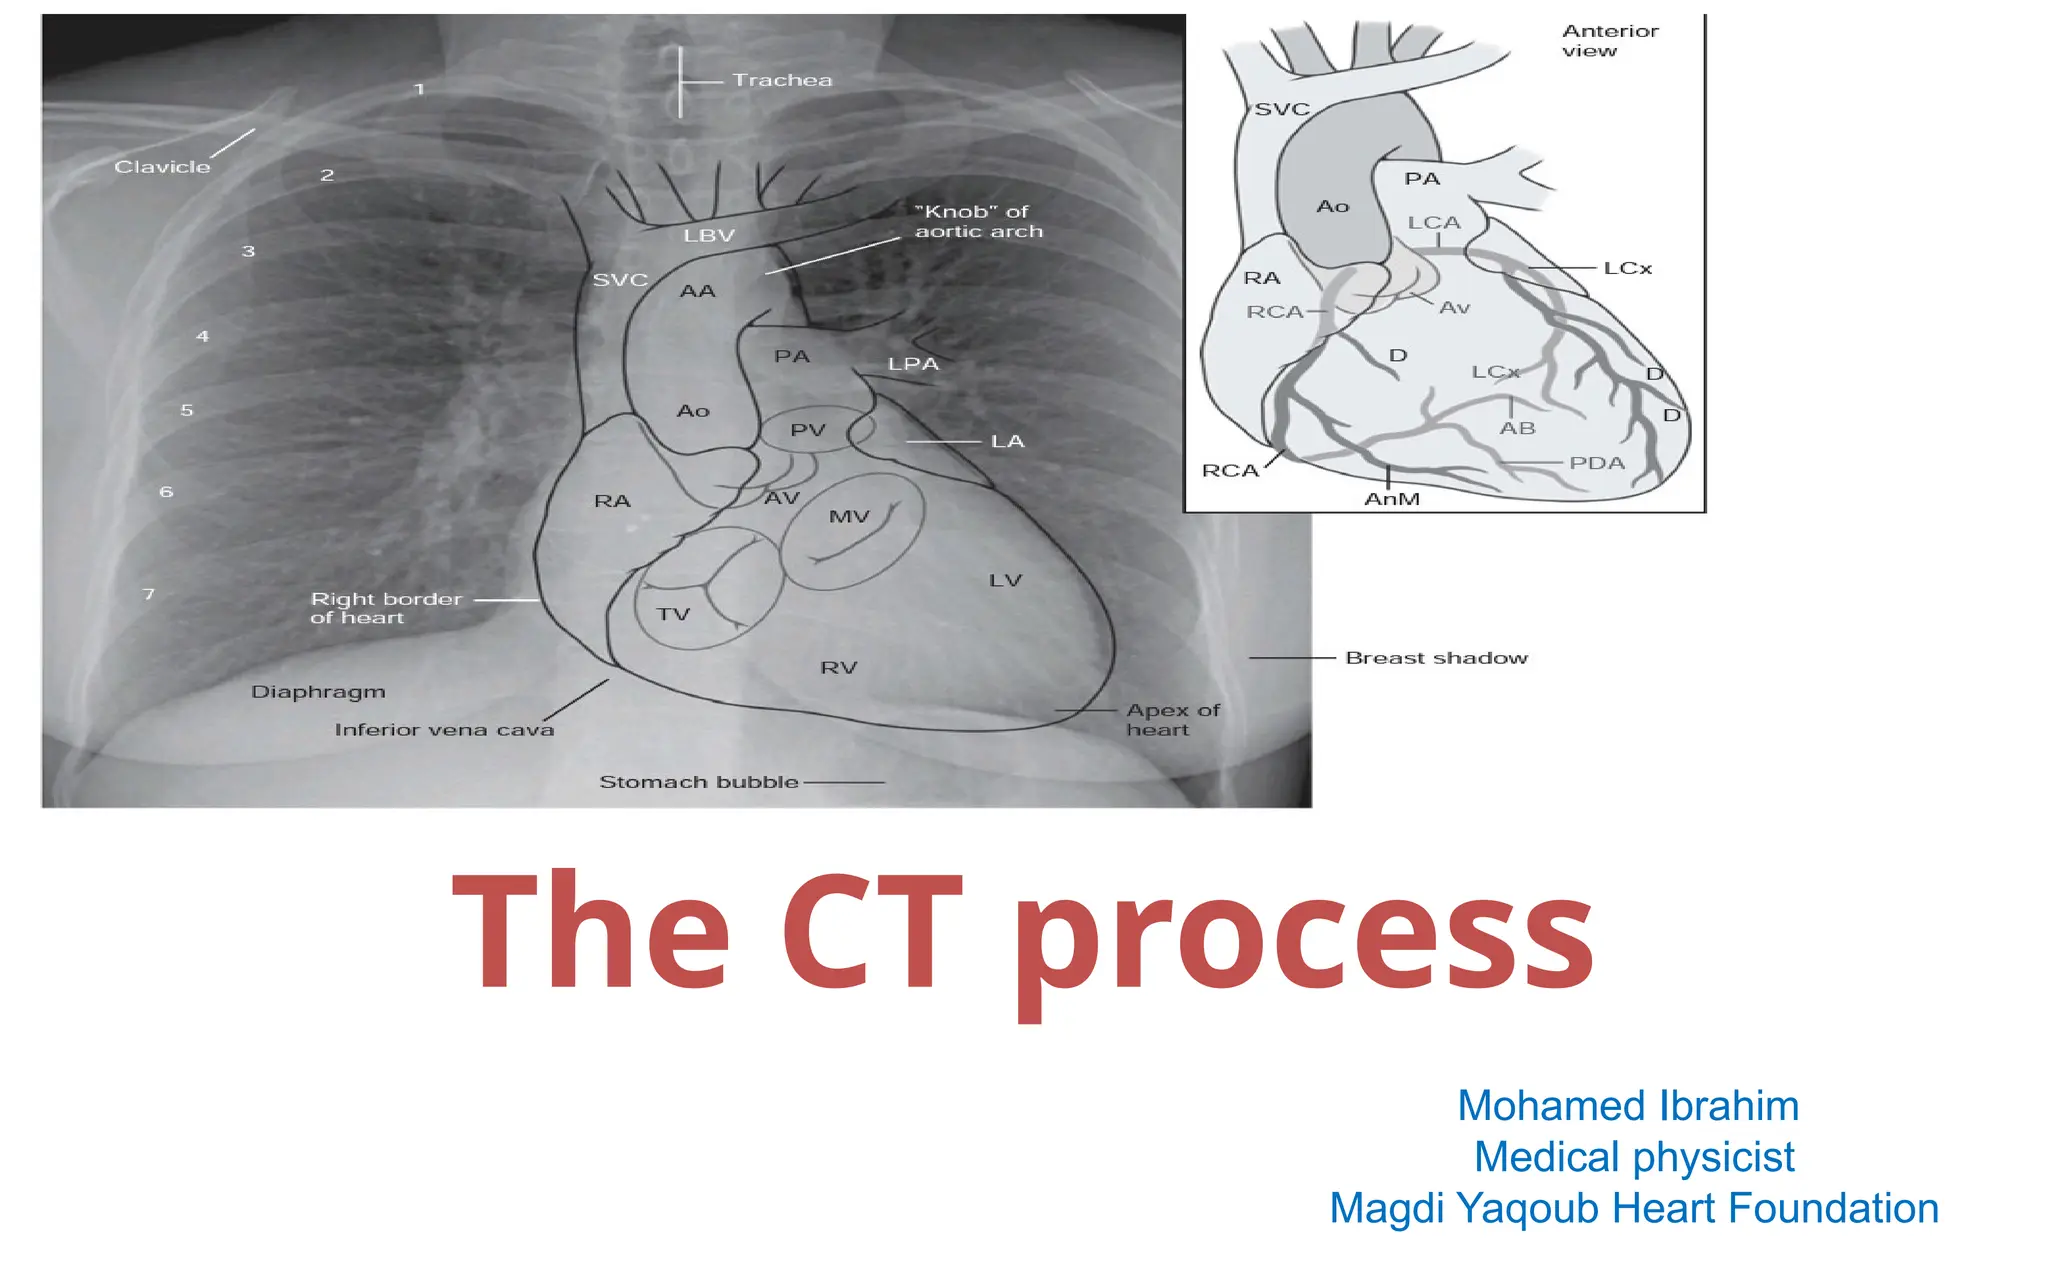
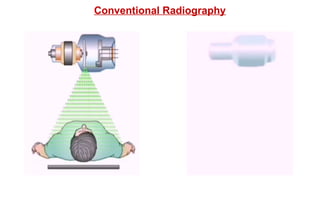
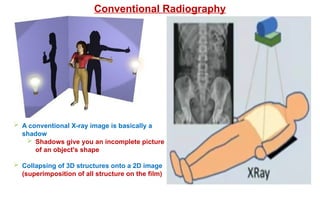
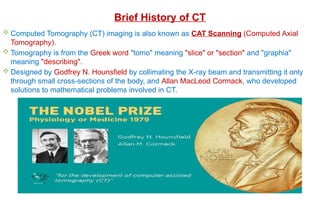
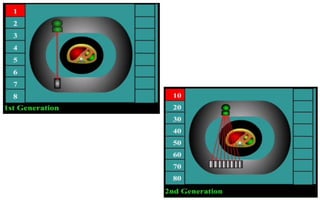
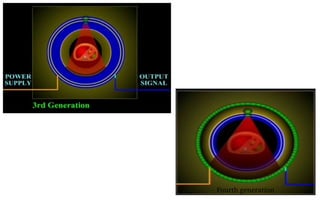
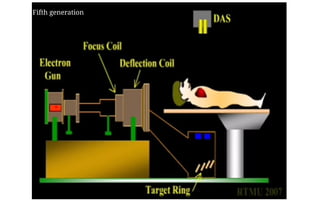
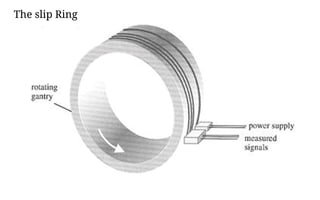
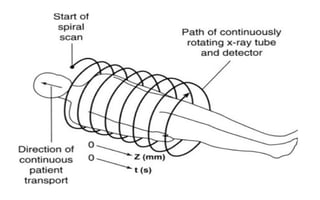
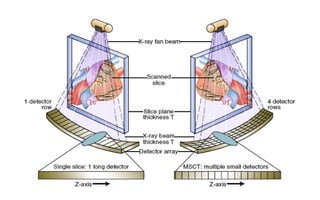
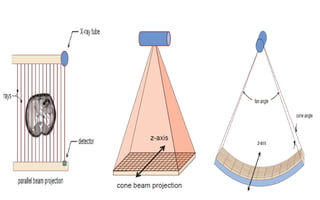
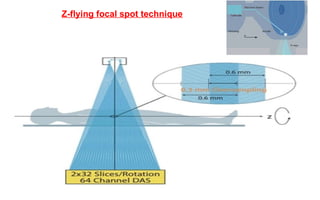
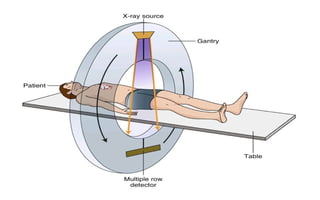
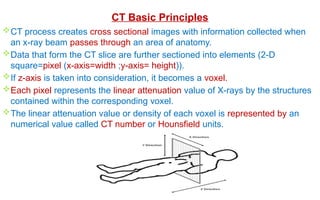
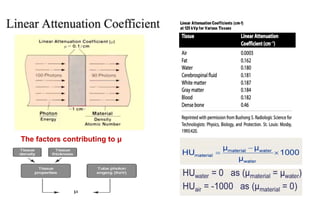
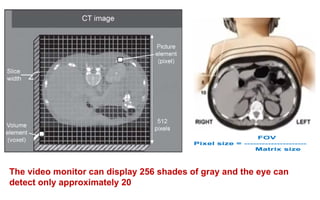
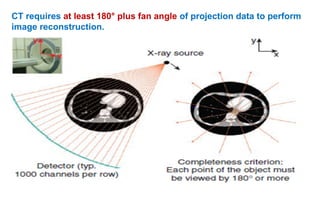
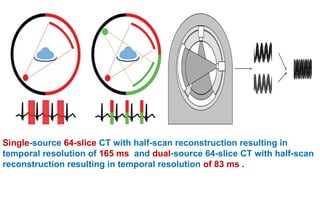
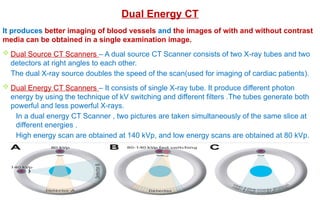
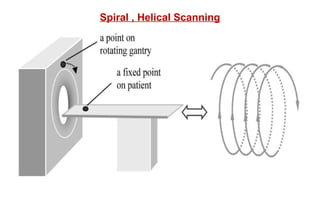
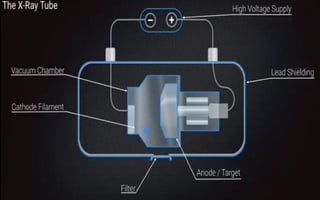
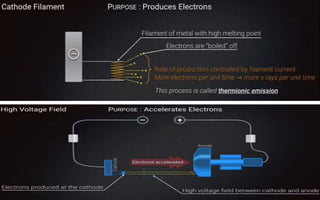
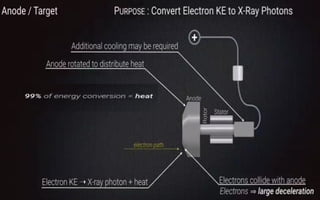
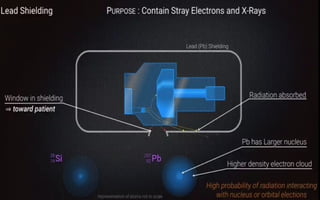
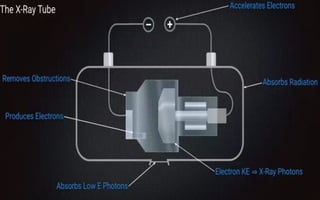
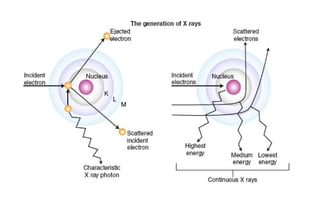
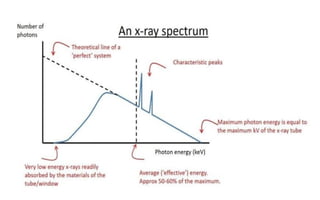
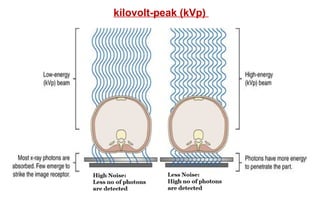
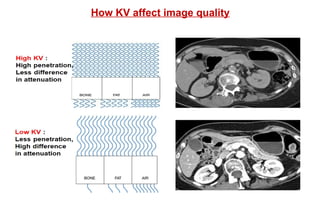
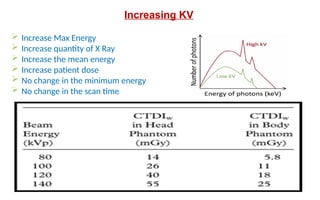
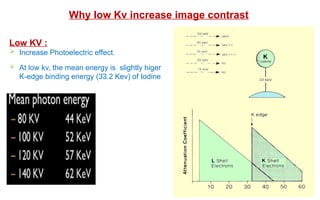
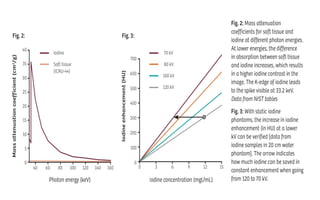
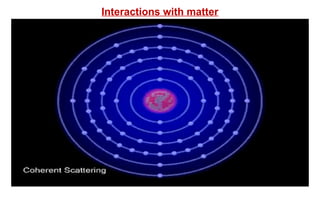
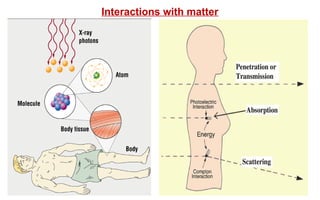
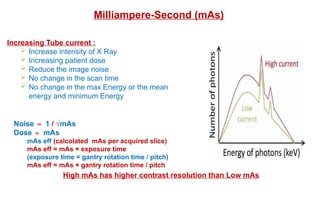
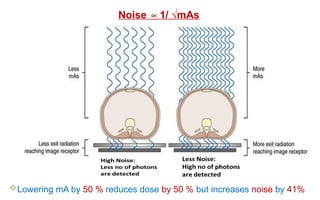
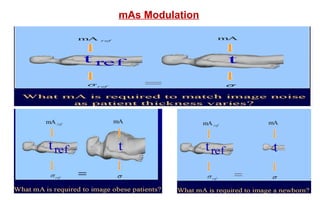
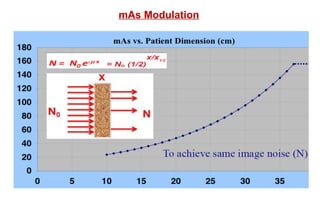
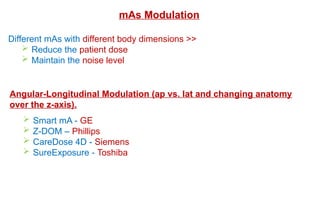
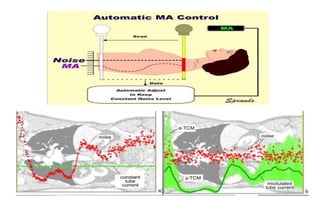
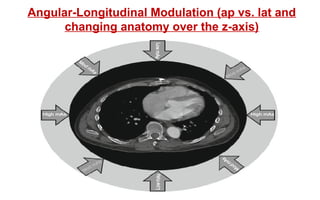
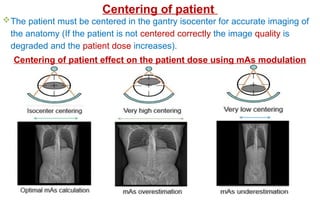
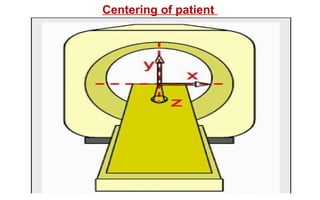
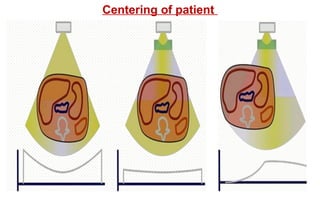
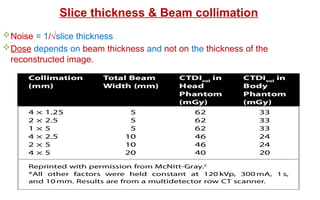
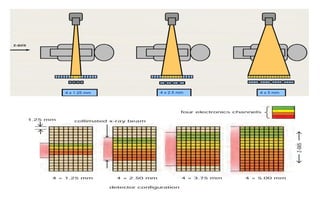
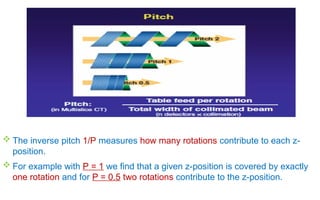
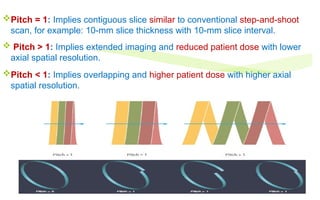
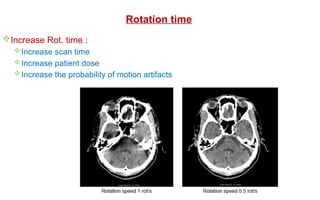
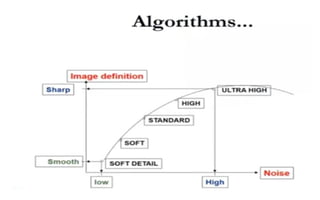
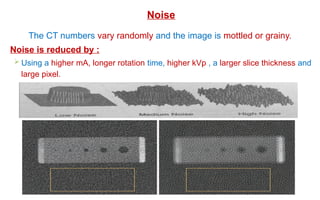
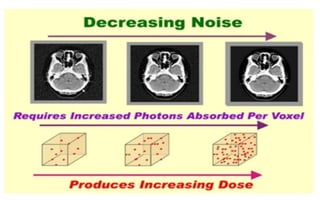
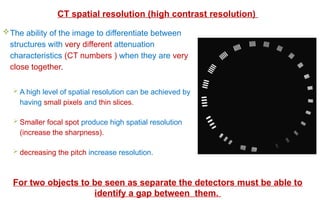
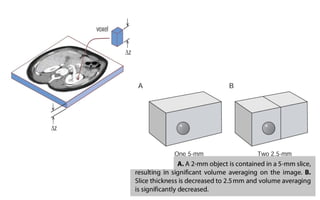
The CT process
Mohamed Ibrahim
Medical physicist
Magdi Yaqoub Heart Foundation
Content
Brief History of CT
Principles of The CT process
Dual Energy CT
Modes of Acquisitions
CT Image Quality (Factors & Indices).
1895: Roentgen discovers x-ray.
1963: Cormack formulates x-ray absorption in tissues.
1972: Hounsfield demonstrates CT.
1979: Hounsfield and Cormack received Nobel Prize.
1983: EBCT demonstrated.
1989: Spiral CT demonstrated.
1991: MSCT introduced
Important events
Conventional Radiography
 A conventional X-ray image is basically a
shadow
 Shadows give you an incomplete picture
of an object's shape
 Collapsing of 3D structures onto a 2D image
(superimposition of all structure on the film)
Brief History of CT
 Computed Tomography (CT) imaging is also known as CAT Scanning (Computed Axial
Tomography).
 Tomography is from the Greek word "tomo" meaning "slice" or "section" and "graphia"
meaning "describing".
 Designed by Godfrey N. Hounsfield by collimating the X-ray beam and transmitting it only
through small cross-sections of the body, and Allan MacLeod Cormack, who developed
solutions to mathematical problems involved in CT.
Fourth generation
Fifth generation
The slip Ring
Z-flying focal spot technique
CT Basic Principles
CT process creates cross sectional images with information collected when
an x-ray beam passes through an area of anatomy.
Data that form the CT slice are further sectioned into elements (2-D
square=pixel (x-axis=width ;y-axis= height)).
If z-axis is taken into consideration, it becomes a voxel.
Each pixel represents the linear attenuation value of X-rays by the structures
contained within the corresponding voxel.
The linear attenuation value or density of each voxel is represented by an
numerical value called CT number or Hounsfield units.
X-ray photons pass through/ absorbed/ scattered by structures in varying
amounts, depending on the average photon energy of the x-ray beam and
the characteristics of the structure in its path.
Beam Attenuation
The factors contributing to μ
The video monitor can display 256 shades of gray and the eye can
detect only approximately 20
Relationship between window level and width
 Window level
 Defined as the central value of the window
used for the display of the reconstructed CT
image.
 selected according to the attenuation
characteristics of the structure under
examination.
 Window Width
 The range of CT numbers converted into grey
levels and displayed on the image monitor.
 Selected by the operator according to the
clinical requirements.
CT requires at least 180° plus fan angle of projection data to perform
image reconstruction.
Single-source 64-slice CT with half-scan reconstruction resulting in
temporal resolution of 165 ms and dual-source 64-slice CT with half-scan
reconstruction resulting in temporal resolution of 83 ms .
Dual Energy CT
It produces better imaging of blood vessels and the images of with and without contrast
media can be obtained in a single examination image.
 Dual Source CT Scanners – A dual source CT Scanner consists of two X-ray tubes and two
detectors at right angles to each other.
The dual X-ray source doubles the speed of the scan(used for imaging of cardiac patients).
 Dual Energy CT Scanners – It consists of single X-ray tube. It produce different photon
energy by using the technique of kV switching and different filters .The tubes generate both
powerful and less powerful X-rays.
In a dual energy CT Scanner , two pictures are taken simultaneously of the same slice at
different energies .
High energy scan are obtained at 140 kVp, and low energy scans are obtained at 80 kVp.
Modes of Acquisitions
Scout ,Surview , Topogram, Scanogram
Axial , Sequential Scanning
Spiral , Helical Scanning
Factors affecting image quality
X-ray production
kilovolt-peak (kVp)
How KV affect image quality
 Increase Max Energy
 Increase quantity of X Ray
 Increase the mean energy
 Increase patient dose
 No change in the minimum energy
 No change in the scan time
Increasing KV
Why low Kv increase image contrast
Low KV :
 Increase Photoelectric effect.
 At low kv, the mean energy is slightly higer
K-edge binding energy (33.2 Kev) of Iodine
Interactions with matter
Milliampere-Second (mAs)
Increasing Tube current :
 Increase intensity of X Ray
 Increasing patient dose
 Reduce the image noise
 No change in the scan time
 No change in the max Energy or the mean
energy and minimum Energy
Noise ∝ 1 / √mAs
Dose ∝ mAs
mAs eff (calcolated mAs per acquired slice)
mAs eff = mAs × exposure time
(exposure time = gantry rotation time / pitch)
mAs eff = mAs × gantry rotation time / pitch
High mAs has higher contrast resolution than Low mAs
Noise 1/ √mAs
∝
Lowering mA by 50 % reduces dose by 50 % but increases noise by 41%
mAs Modulation
mAs Modulation
mAs Modulation
Different mAs with different body dimensions >>
 Reduce the patient dose
 Maintain the noise level
Angular-Longitudinal Modulation (ap vs. lat and changing anatomy
over the z-axis).
 Smart mA - GE
 Z-DOM – Phillips
 CareDose 4D - Siemens
 SureExposure - Toshiba
Angular-Longitudinal Modulation (ap vs. lat and
changing anatomy over the z-axis)
The patient must be centered in the gantry isocenter for accurate imaging of
the anatomy (If the patient is not centered correctly the image quality is
degraded and the patient dose increases).
Centering of patient effect on the patient dose using mAs modulation
Centering of patient
Noise = 1/√slice thickness
Dose depends on beam thickness and not on the thickness of the
reconstructed image.
Slice thickness & Beam collimation
 The inverse pitch 1/P measures how many rotations contribute to each z-
position.
 For example with P = 1 we find that a given z-position is covered by exactly
one rotation and for P = 0.5 two rotations contribute to the z-position.
Pitch = 1: Implies contiguous slice similar to conventional step-and-shoot
scan, for example: 10-mm slice thickness with 10-mm slice interval.
 Pitch > 1: Implies extended imaging and reduced patient dose with lower
axial spatial resolution.
Pitch < 1: Implies overlapping and higher patient dose with higher axial
spatial resolution.
Increase Rot. time :
Increase scan time
Increase patient dose
Increase the probability of motion artifacts
Rotation time
Image Quality indices
The CT numbers vary randomly and the image is mottled or grainy.
Noise is reduced by :
 Using a higher mA, longer rotation time, higher kVp , a larger slice thickness and
large pixel.
Noise
The ability of the image to differentiate between
structures with very different attenuation
characteristics (CT numbers ) when they are very
close together.
 A high level of spatial resolution can be achieved by
having small pixels and thin slices.
 Smaller focal spot produce high spatial resolution
(increase the sharpness).
 decreasing the pitch increase resolution.
CT spatial resolution (high contrast resolution)
For two objects to be seen as separate the detectors must be able to
identify a gap between them.
10-mm 1.5-mm
A standard kernel A bone kernel
Utilizing a bone, sharp, high frequency or high pass algorithm during reconstruction
can improve the spatial resolution.
Field of view & The spatial resolution
Field of view
Images reconstructed with different FOVs.
A, Reconstructed with 50-cm FOV.
B, Reconstructed with 50-cm FOV and interpolated to 10-cm FOV.
C, Targeted reconstruction to 10-cm FOV.
Field of view & The spatial resolution
The ability to discriminate between structures
with very similar attenuation characteristics (CT
numbers).
The ability to differentiate a structure that varies
only slightly in density from its surrounding.
The limiting factor for contrast resolution is noise.
 Any factor that reduces the amount or visibility of noise
improves contrast resolution, choice of mA, kVp , slice
thickness, matrix size, FOV, and reconstruction filter
affects contrast resolution.
CT contrast resolution (low contrast resolution)
Temporal Resolution
 Temporal resolution is still the major limitation of coronary CT and the main
cause of non diagnostic images, and therefore all possible measures must be
taken to improve this parameter.
 CT requires at least 180° plus fan angle of projection data to perform image
reconstruction.
 This implies that the intrinsic temporal resolution of a standard CT scan is in
the order of gantry rotation time /2.
 The temporal resolution is most dependent on the speed of the gantry
rotation.
To be continued,,,,,
Cardiac CT Imaging

Brief discussion about The CT scan process

  • 1.
    The CT process MohamedIbrahim Medical physicist Magdi Yaqoub Heart Foundation
  • 2.
    Content Brief History ofCT Principles of The CT process Dual Energy CT Modes of Acquisitions CT Image Quality (Factors & Indices).
  • 3.
    1895: Roentgen discoversx-ray. 1963: Cormack formulates x-ray absorption in tissues. 1972: Hounsfield demonstrates CT. 1979: Hounsfield and Cormack received Nobel Prize. 1983: EBCT demonstrated. 1989: Spiral CT demonstrated. 1991: MSCT introduced Important events
  • 6.
  • 7.
    Conventional Radiography  Aconventional X-ray image is basically a shadow  Shadows give you an incomplete picture of an object's shape  Collapsing of 3D structures onto a 2D image (superimposition of all structure on the film)
  • 8.
    Brief History ofCT  Computed Tomography (CT) imaging is also known as CAT Scanning (Computed Axial Tomography).  Tomography is from the Greek word "tomo" meaning "slice" or "section" and "graphia" meaning "describing".  Designed by Godfrey N. Hounsfield by collimating the X-ray beam and transmitting it only through small cross-sections of the body, and Allan MacLeod Cormack, who developed solutions to mathematical problems involved in CT.
  • 10.
  • 11.
  • 12.
  • 16.
  • 20.
    CT Basic Principles CTprocess creates cross sectional images with information collected when an x-ray beam passes through an area of anatomy. Data that form the CT slice are further sectioned into elements (2-D square=pixel (x-axis=width ;y-axis= height)). If z-axis is taken into consideration, it becomes a voxel. Each pixel represents the linear attenuation value of X-rays by the structures contained within the corresponding voxel. The linear attenuation value or density of each voxel is represented by an numerical value called CT number or Hounsfield units.
  • 21.
    X-ray photons passthrough/ absorbed/ scattered by structures in varying amounts, depending on the average photon energy of the x-ray beam and the characteristics of the structure in its path. Beam Attenuation
  • 22.
  • 23.
    The video monitorcan display 256 shades of gray and the eye can detect only approximately 20
  • 24.
    Relationship between windowlevel and width  Window level  Defined as the central value of the window used for the display of the reconstructed CT image.  selected according to the attenuation characteristics of the structure under examination.  Window Width  The range of CT numbers converted into grey levels and displayed on the image monitor.  Selected by the operator according to the clinical requirements.
  • 32.
    CT requires atleast 180° plus fan angle of projection data to perform image reconstruction.
  • 34.
    Single-source 64-slice CTwith half-scan reconstruction resulting in temporal resolution of 165 ms and dual-source 64-slice CT with half-scan reconstruction resulting in temporal resolution of 83 ms .
  • 35.
    Dual Energy CT Itproduces better imaging of blood vessels and the images of with and without contrast media can be obtained in a single examination image.  Dual Source CT Scanners – A dual source CT Scanner consists of two X-ray tubes and two detectors at right angles to each other. The dual X-ray source doubles the speed of the scan(used for imaging of cardiac patients).  Dual Energy CT Scanners – It consists of single X-ray tube. It produce different photon energy by using the technique of kV switching and different filters .The tubes generate both powerful and less powerful X-rays. In a dual energy CT Scanner , two pictures are taken simultaneously of the same slice at different energies . High energy scan are obtained at 140 kVp, and low energy scans are obtained at 80 kVp.
  • 37.
  • 38.
    Scout ,Surview ,Topogram, Scanogram
  • 39.
  • 40.
  • 41.
  • 42.
  • 51.
  • 52.
    How KV affectimage quality
  • 53.
     Increase MaxEnergy  Increase quantity of X Ray  Increase the mean energy  Increase patient dose  No change in the minimum energy  No change in the scan time Increasing KV
  • 54.
    Why low Kvincrease image contrast Low KV :  Increase Photoelectric effect.  At low kv, the mean energy is slightly higer K-edge binding energy (33.2 Kev) of Iodine
  • 56.
  • 57.
  • 58.
    Milliampere-Second (mAs) Increasing Tubecurrent :  Increase intensity of X Ray  Increasing patient dose  Reduce the image noise  No change in the scan time  No change in the max Energy or the mean energy and minimum Energy Noise ∝ 1 / √mAs Dose ∝ mAs mAs eff (calcolated mAs per acquired slice) mAs eff = mAs × exposure time (exposure time = gantry rotation time / pitch) mAs eff = mAs × gantry rotation time / pitch High mAs has higher contrast resolution than Low mAs
  • 59.
    Noise 1/ √mAs ∝ LoweringmA by 50 % reduces dose by 50 % but increases noise by 41%
  • 60.
  • 61.
  • 62.
    mAs Modulation Different mAswith different body dimensions >>  Reduce the patient dose  Maintain the noise level Angular-Longitudinal Modulation (ap vs. lat and changing anatomy over the z-axis).  Smart mA - GE  Z-DOM – Phillips  CareDose 4D - Siemens  SureExposure - Toshiba
  • 64.
    Angular-Longitudinal Modulation (apvs. lat and changing anatomy over the z-axis)
  • 65.
    The patient mustbe centered in the gantry isocenter for accurate imaging of the anatomy (If the patient is not centered correctly the image quality is degraded and the patient dose increases). Centering of patient effect on the patient dose using mAs modulation Centering of patient
  • 66.
  • 67.
  • 68.
    Noise = 1/√slicethickness Dose depends on beam thickness and not on the thickness of the reconstructed image. Slice thickness & Beam collimation
  • 75.
     The inversepitch 1/P measures how many rotations contribute to each z- position.  For example with P = 1 we find that a given z-position is covered by exactly one rotation and for P = 0.5 two rotations contribute to the z-position.
  • 76.
    Pitch = 1:Implies contiguous slice similar to conventional step-and-shoot scan, for example: 10-mm slice thickness with 10-mm slice interval.  Pitch > 1: Implies extended imaging and reduced patient dose with lower axial spatial resolution. Pitch < 1: Implies overlapping and higher patient dose with higher axial spatial resolution.
  • 77.
    Increase Rot. time: Increase scan time Increase patient dose Increase the probability of motion artifacts Rotation time
  • 79.
  • 80.
    The CT numbersvary randomly and the image is mottled or grainy. Noise is reduced by :  Using a higher mA, longer rotation time, higher kVp , a larger slice thickness and large pixel. Noise
  • 82.
    The ability ofthe image to differentiate between structures with very different attenuation characteristics (CT numbers ) when they are very close together.  A high level of spatial resolution can be achieved by having small pixels and thin slices.  Smaller focal spot produce high spatial resolution (increase the sharpness).  decreasing the pitch increase resolution. CT spatial resolution (high contrast resolution) For two objects to be seen as separate the detectors must be able to identify a gap between them.
  • 85.
  • 86.
    A standard kernelA bone kernel
  • 87.
    Utilizing a bone,sharp, high frequency or high pass algorithm during reconstruction can improve the spatial resolution.
  • 88.
    Field of view& The spatial resolution Field of view
  • 89.
    Images reconstructed withdifferent FOVs. A, Reconstructed with 50-cm FOV. B, Reconstructed with 50-cm FOV and interpolated to 10-cm FOV. C, Targeted reconstruction to 10-cm FOV. Field of view & The spatial resolution
  • 90.
    The ability todiscriminate between structures with very similar attenuation characteristics (CT numbers). The ability to differentiate a structure that varies only slightly in density from its surrounding. The limiting factor for contrast resolution is noise.  Any factor that reduces the amount or visibility of noise improves contrast resolution, choice of mA, kVp , slice thickness, matrix size, FOV, and reconstruction filter affects contrast resolution. CT contrast resolution (low contrast resolution)
  • 92.
    Temporal Resolution  Temporalresolution is still the major limitation of coronary CT and the main cause of non diagnostic images, and therefore all possible measures must be taken to improve this parameter.  CT requires at least 180° plus fan angle of projection data to perform image reconstruction.  This implies that the intrinsic temporal resolution of a standard CT scan is in the order of gantry rotation time /2.  The temporal resolution is most dependent on the speed of the gantry rotation.
  • 94.