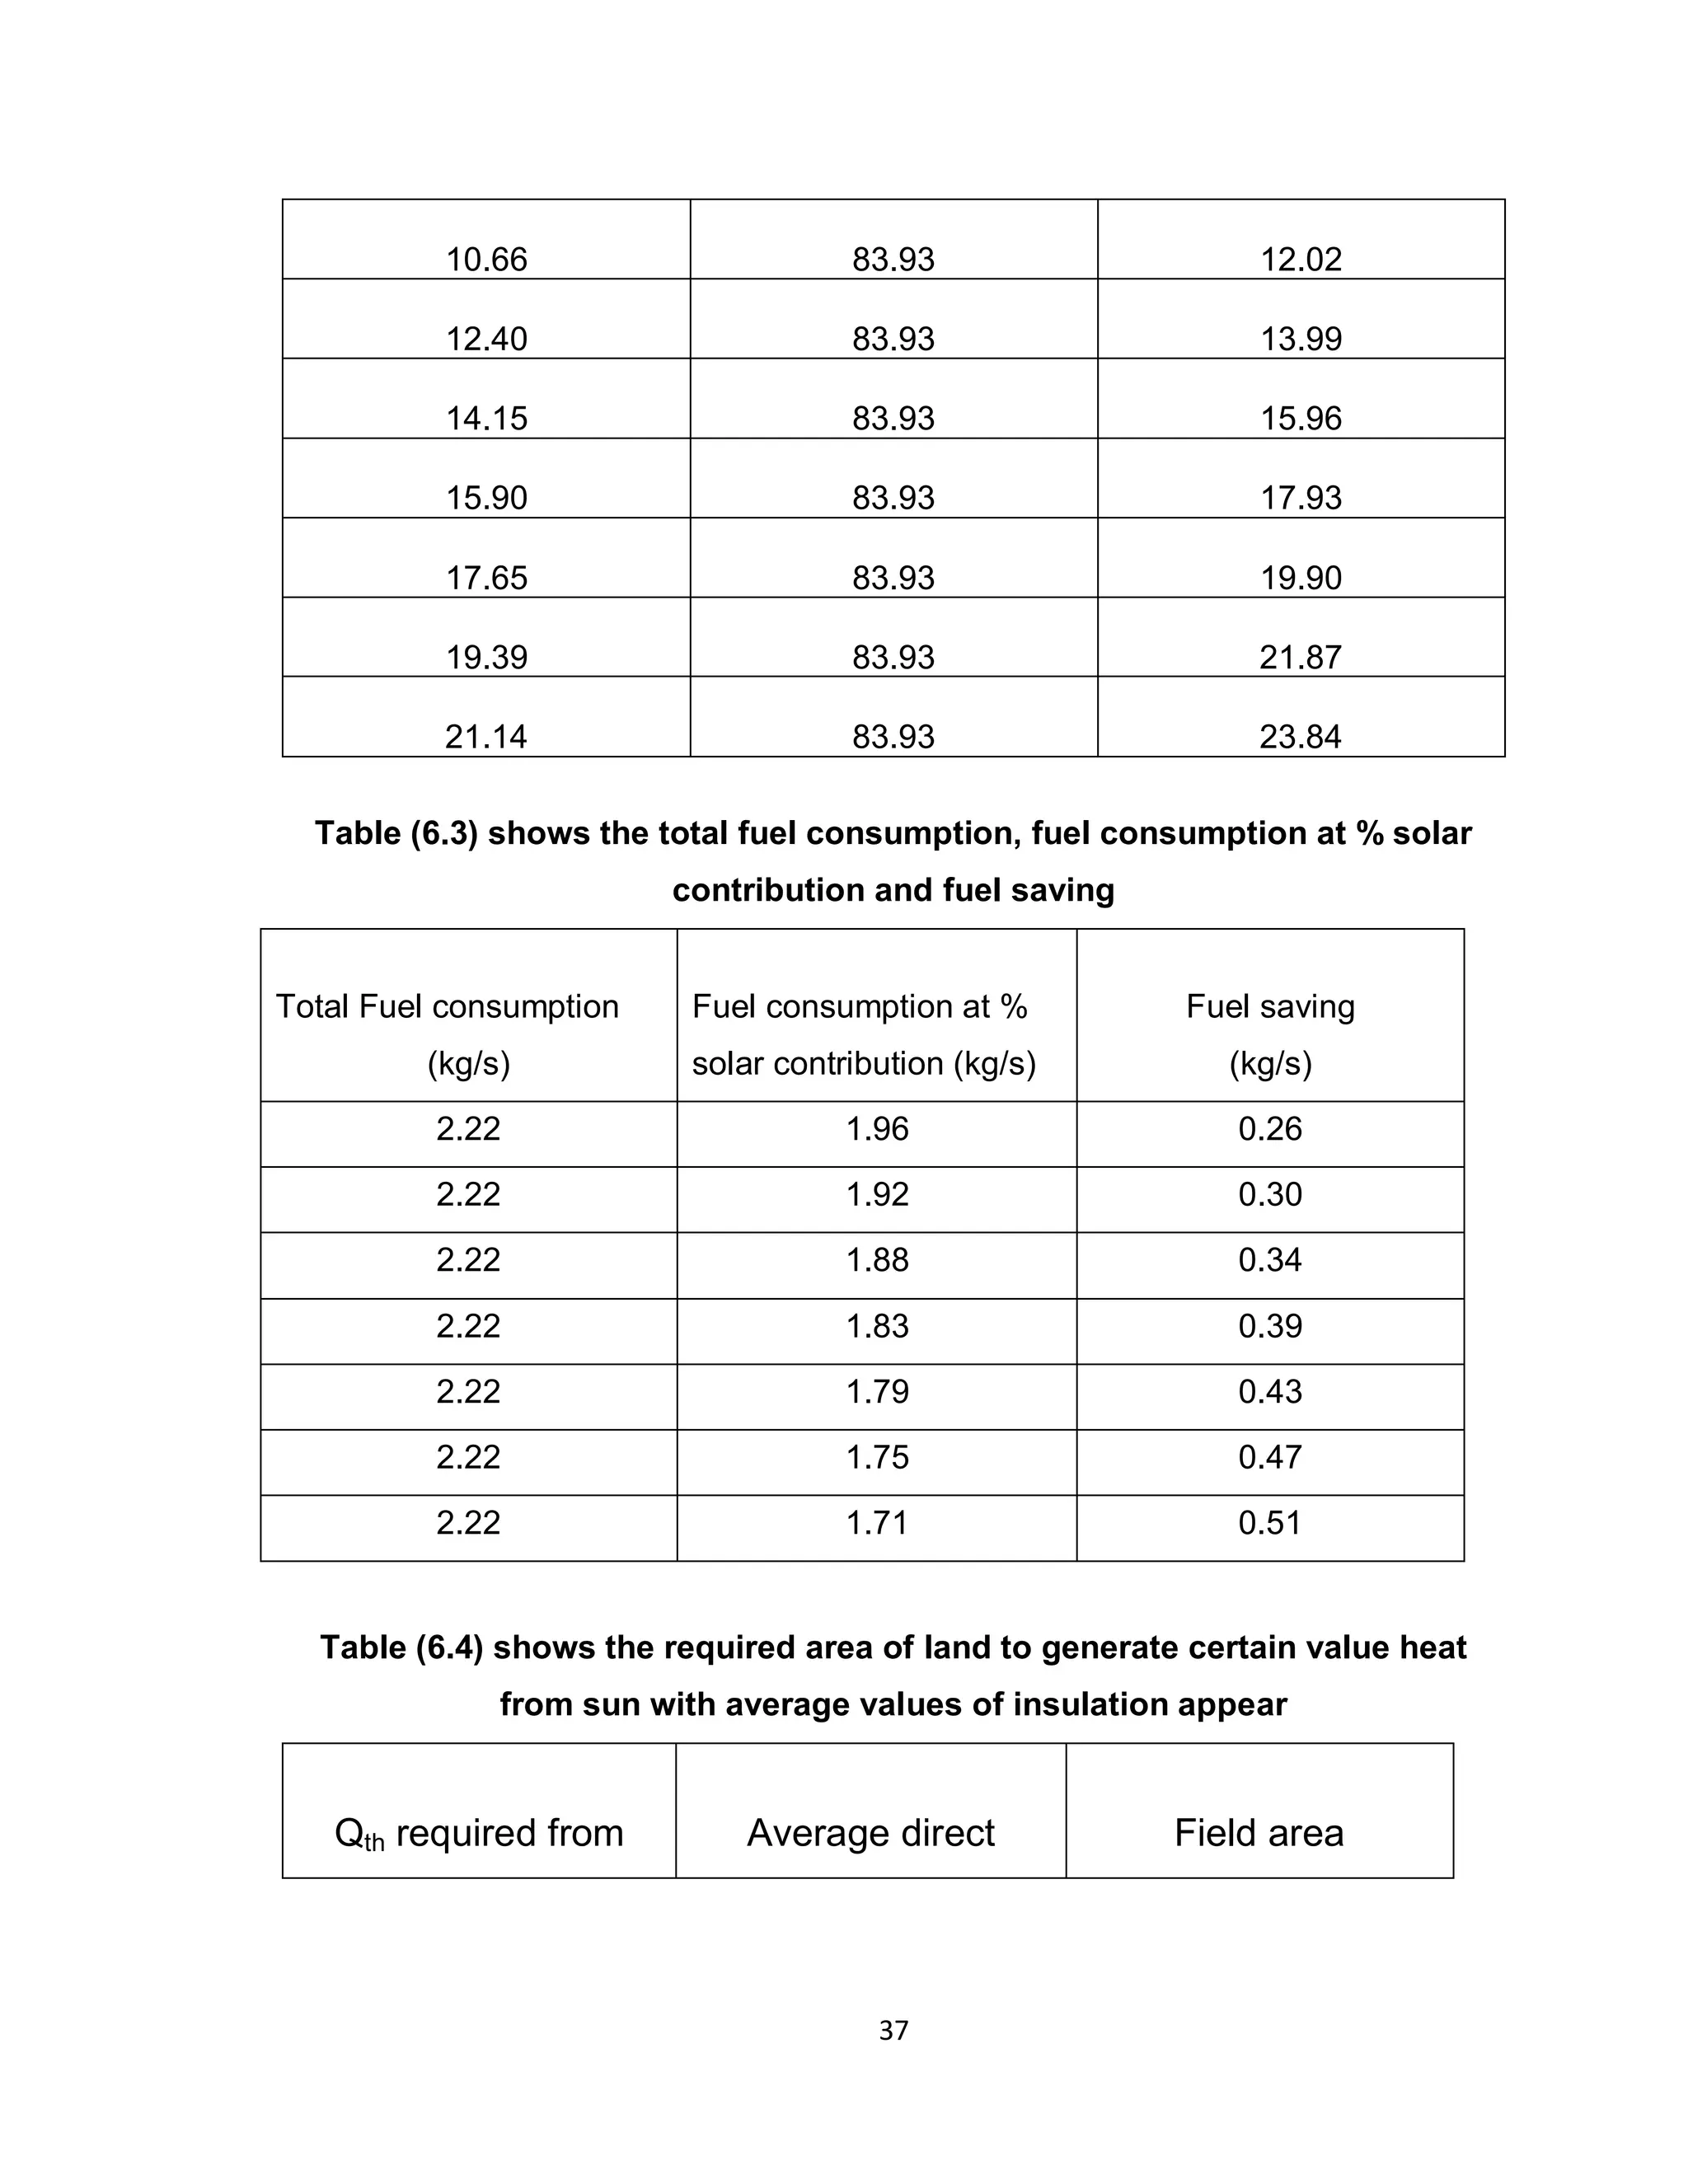
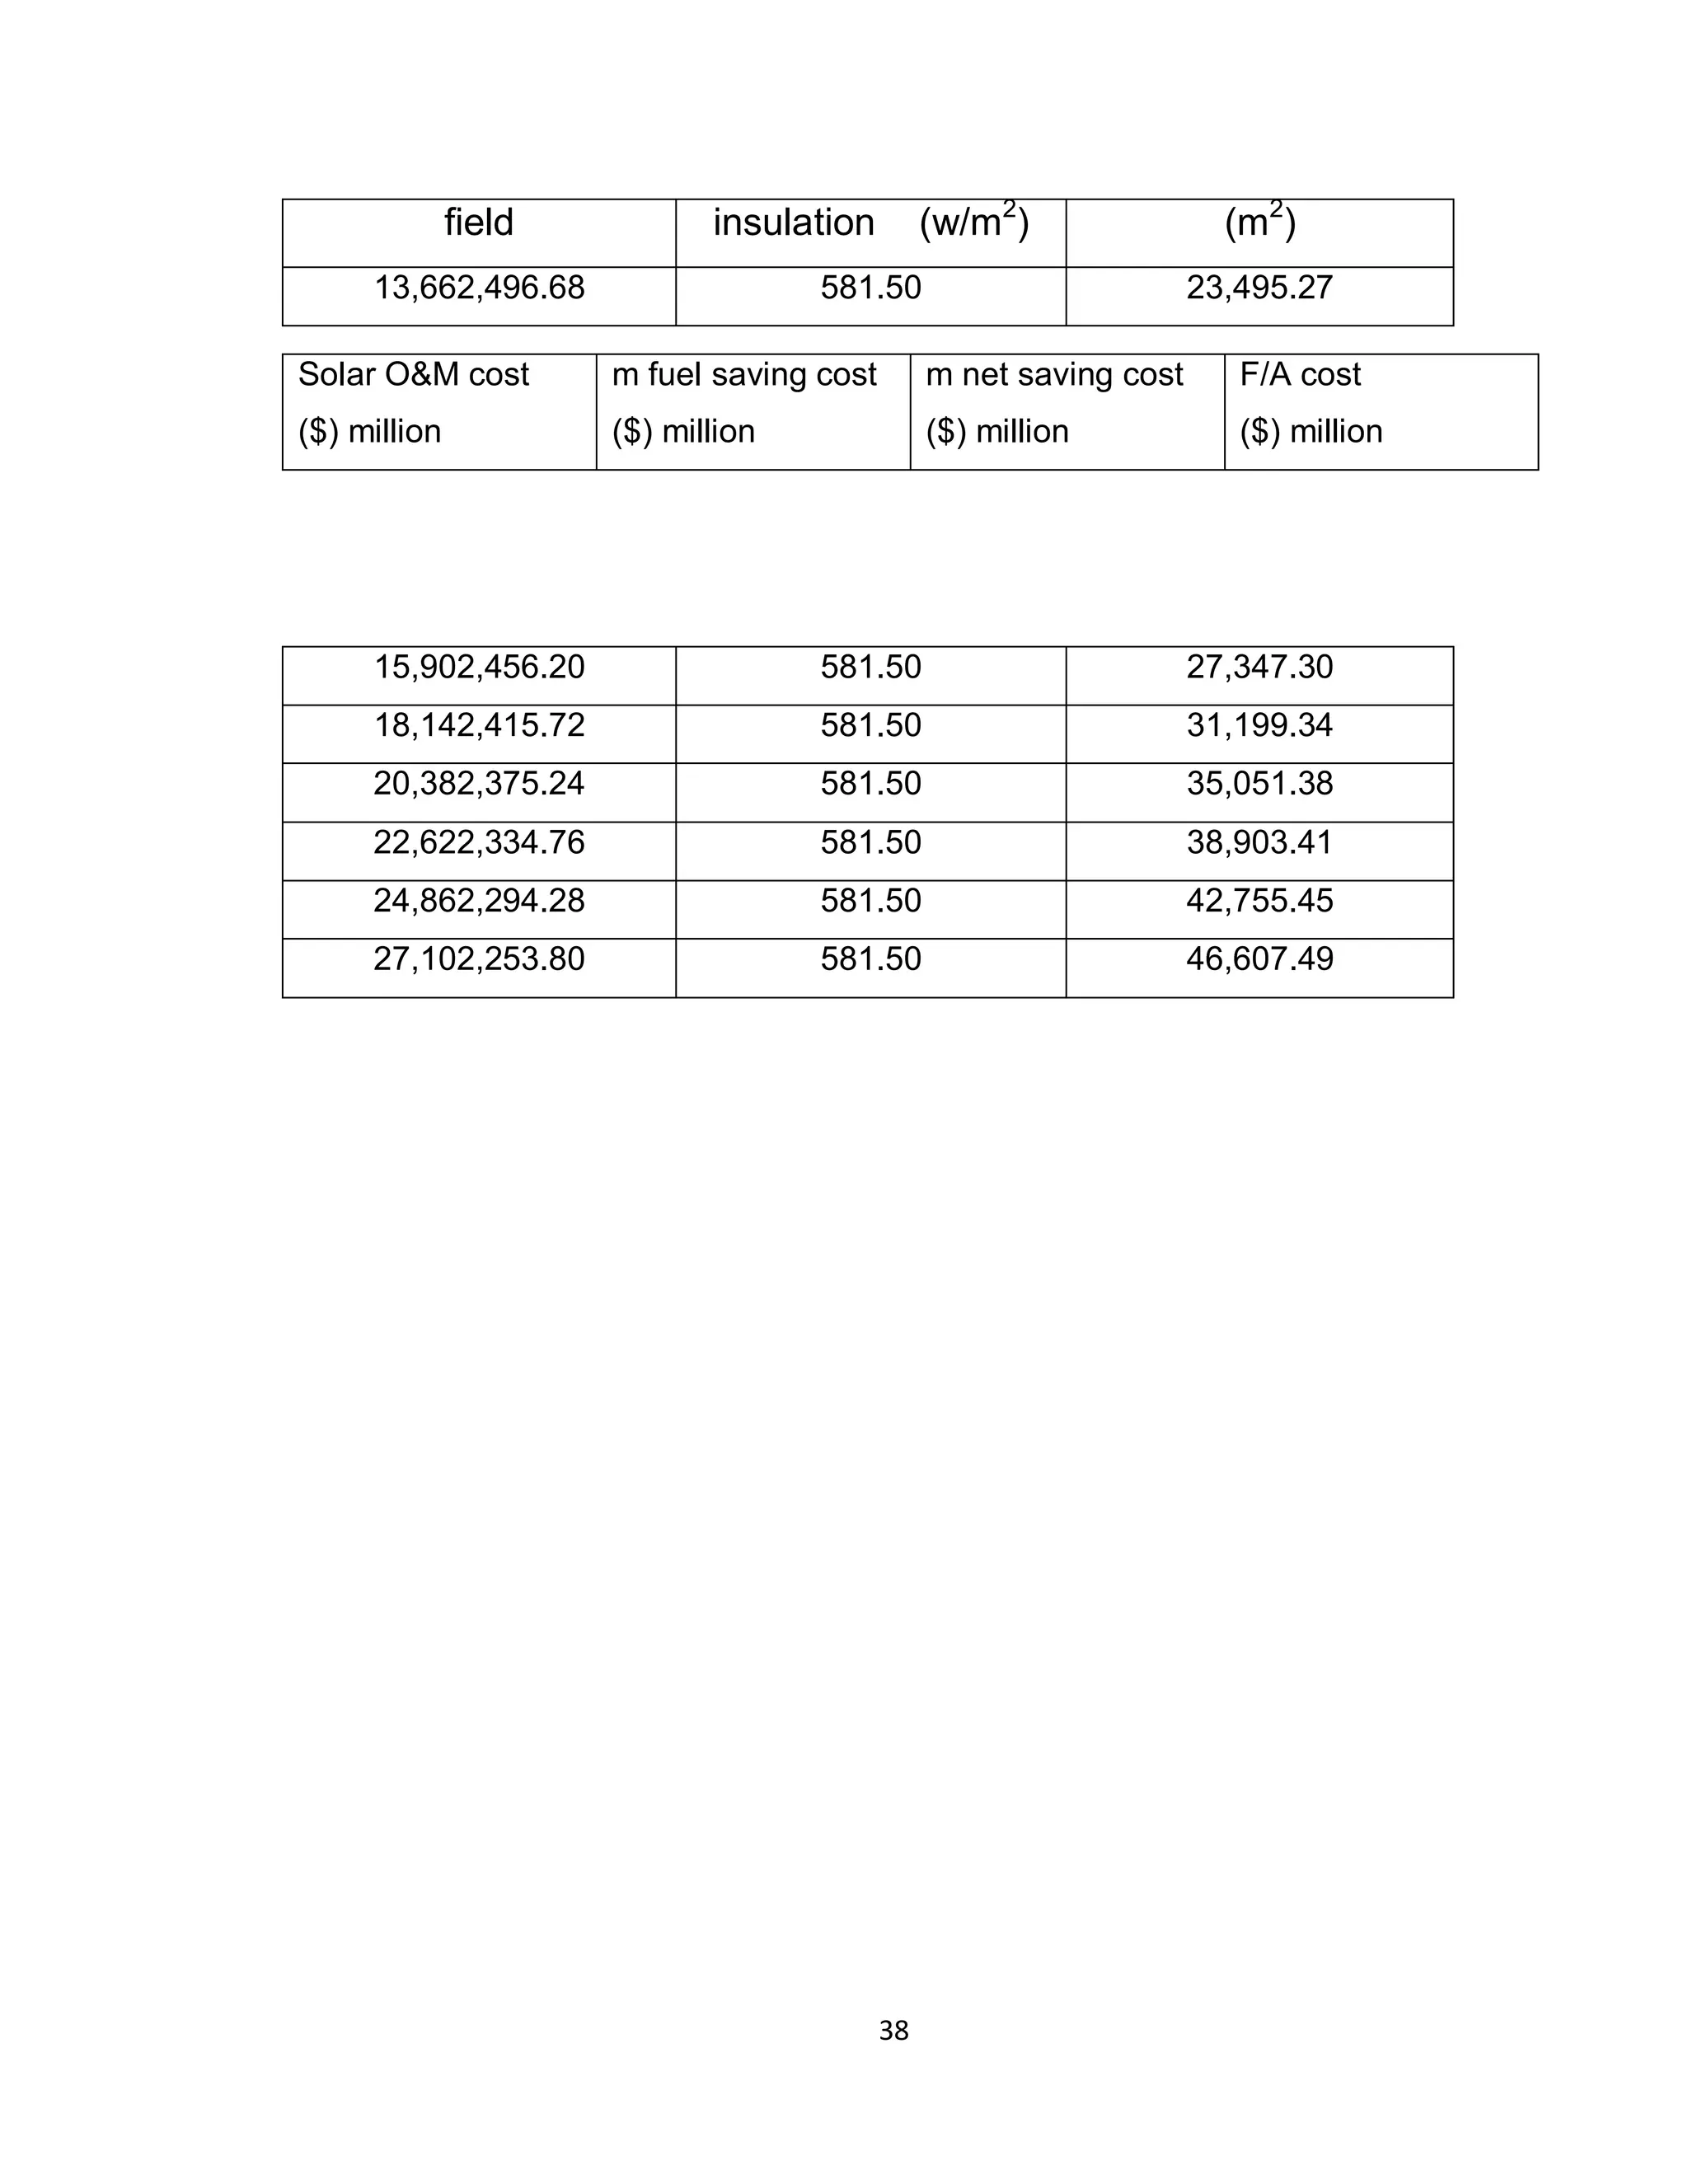
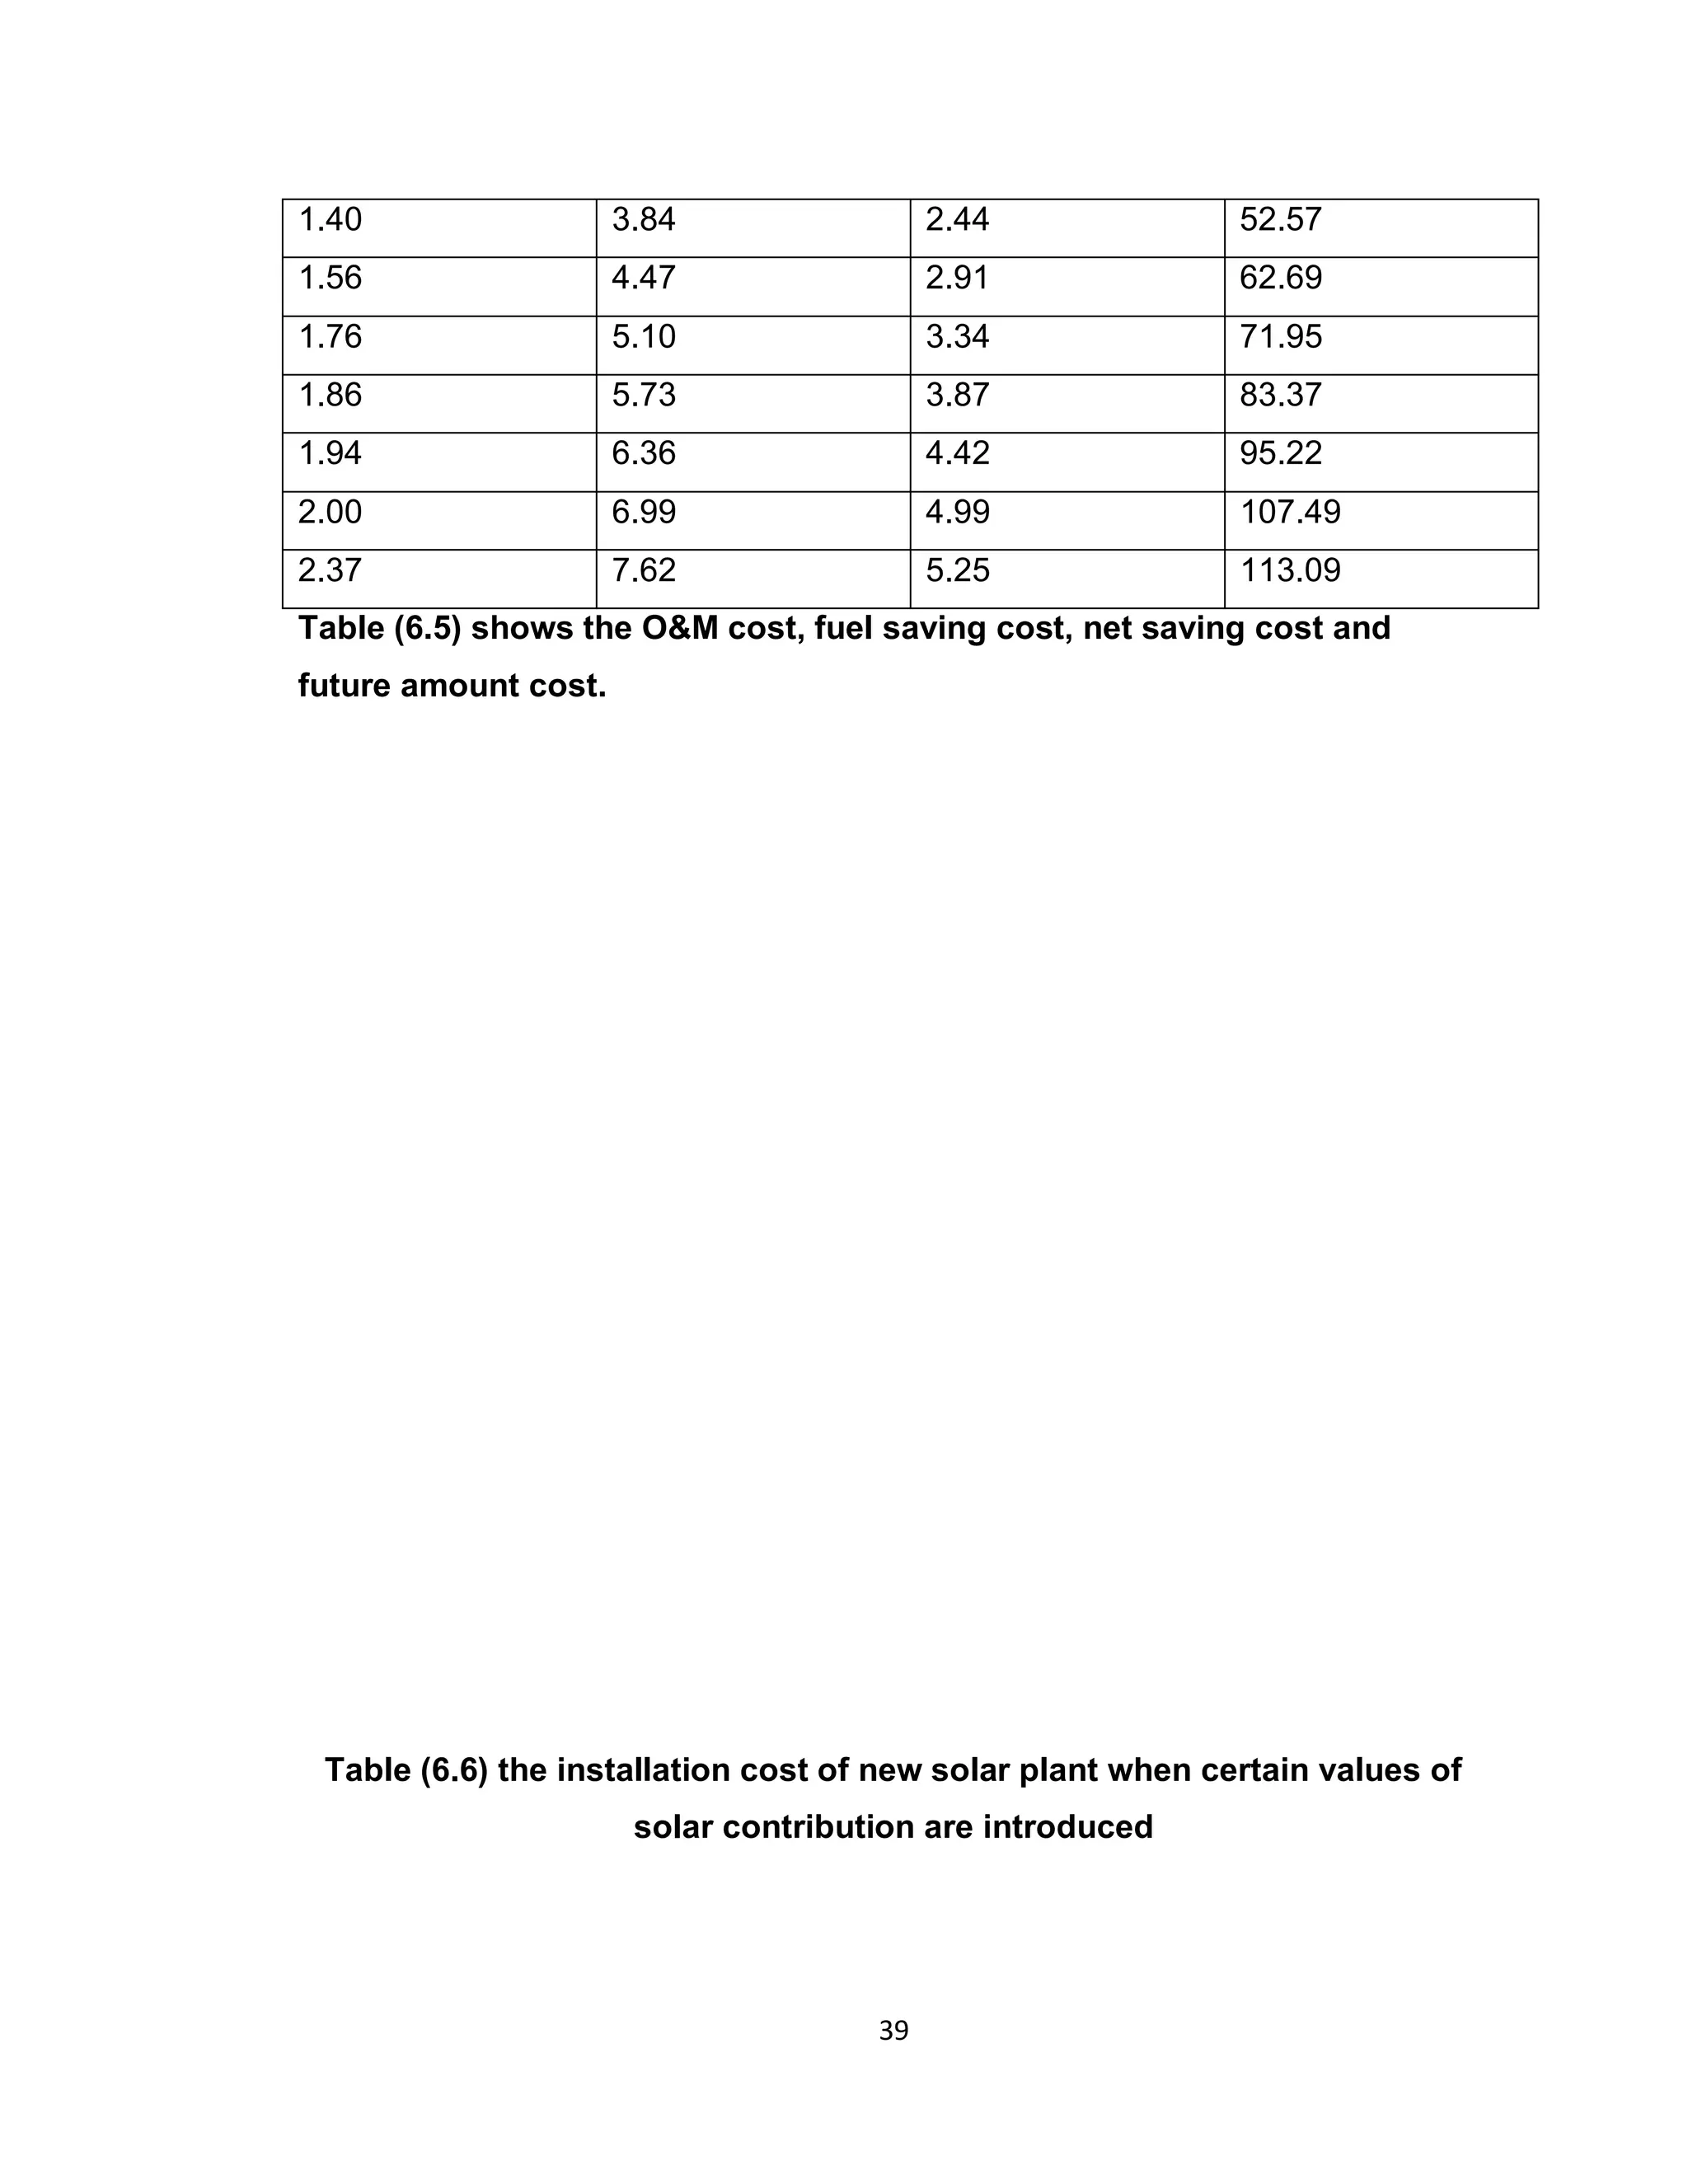
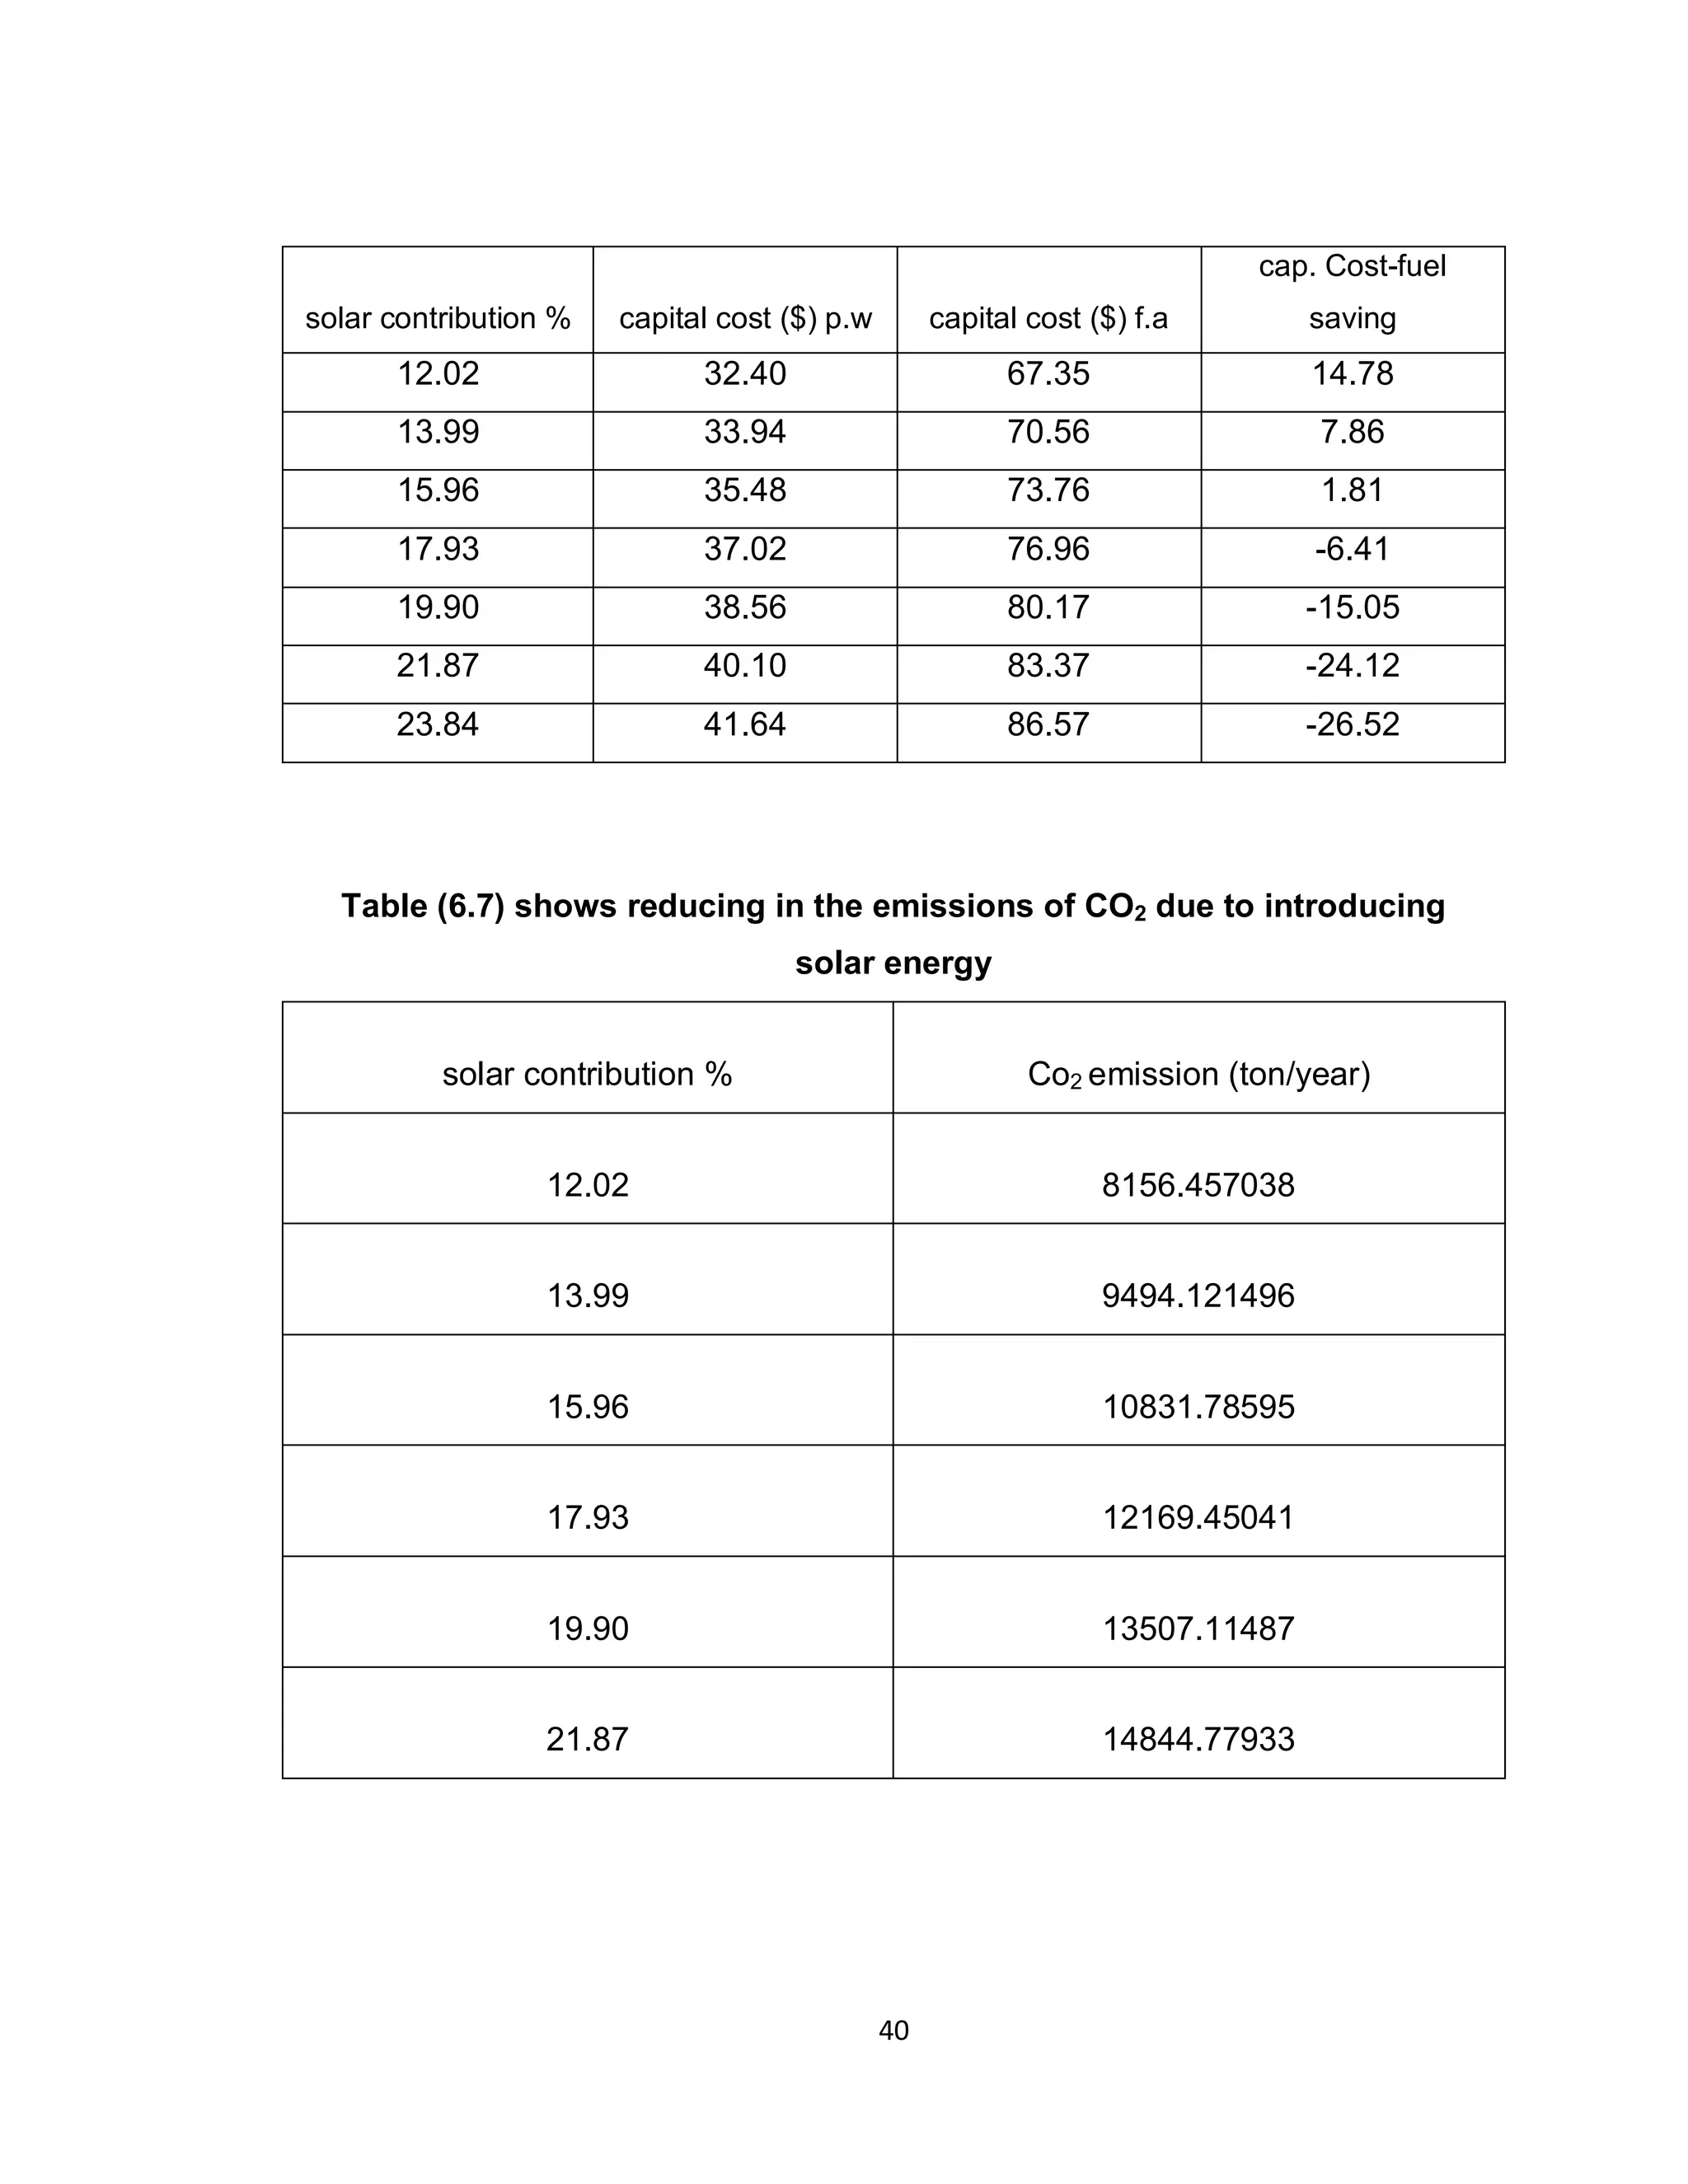
Downloaded 17 times

![6
them to absorb photons of light and release electrons. When these electrons are
captured, electric current generated can be used as electricity [1].
Although Photovoltaic technology is widely used but it is operation capacity is
between hundred to 1 thousand kilowatts, that’s mean it is not applicable to
produce electricity at a large- scale.
1.2 Concentrating solar power systems (CSP)
Concentrating solar power systems provide an environmentally source of energy,
produce virtually no emissions, and consume no fuel other than sunlight.
CSP is defined as a Concentrating Solar Power System that generates electricity
with solar heat. Concentrating solar collectors use mirrors and lenses to
concentrate and focus sunlight onto a thermal receiver, similar to a boiler tube.
The receiver absorbs and converts sunlight into heat. The heat is then
transported to engine where it is converted into electricity. Unlike Photovoltaic
technology CSP technology can be used to drive conventional power plant and
this is proven by the largest CSP plants which designed as parabolic-trough
between 1985 and 1991, in total 354 MW of CSP troughs were built in the US.
There are different types of CSP technology, these are:
1- Central receiver power tower
2- Parabolic trough power system.
3- - Dish Sterling engine
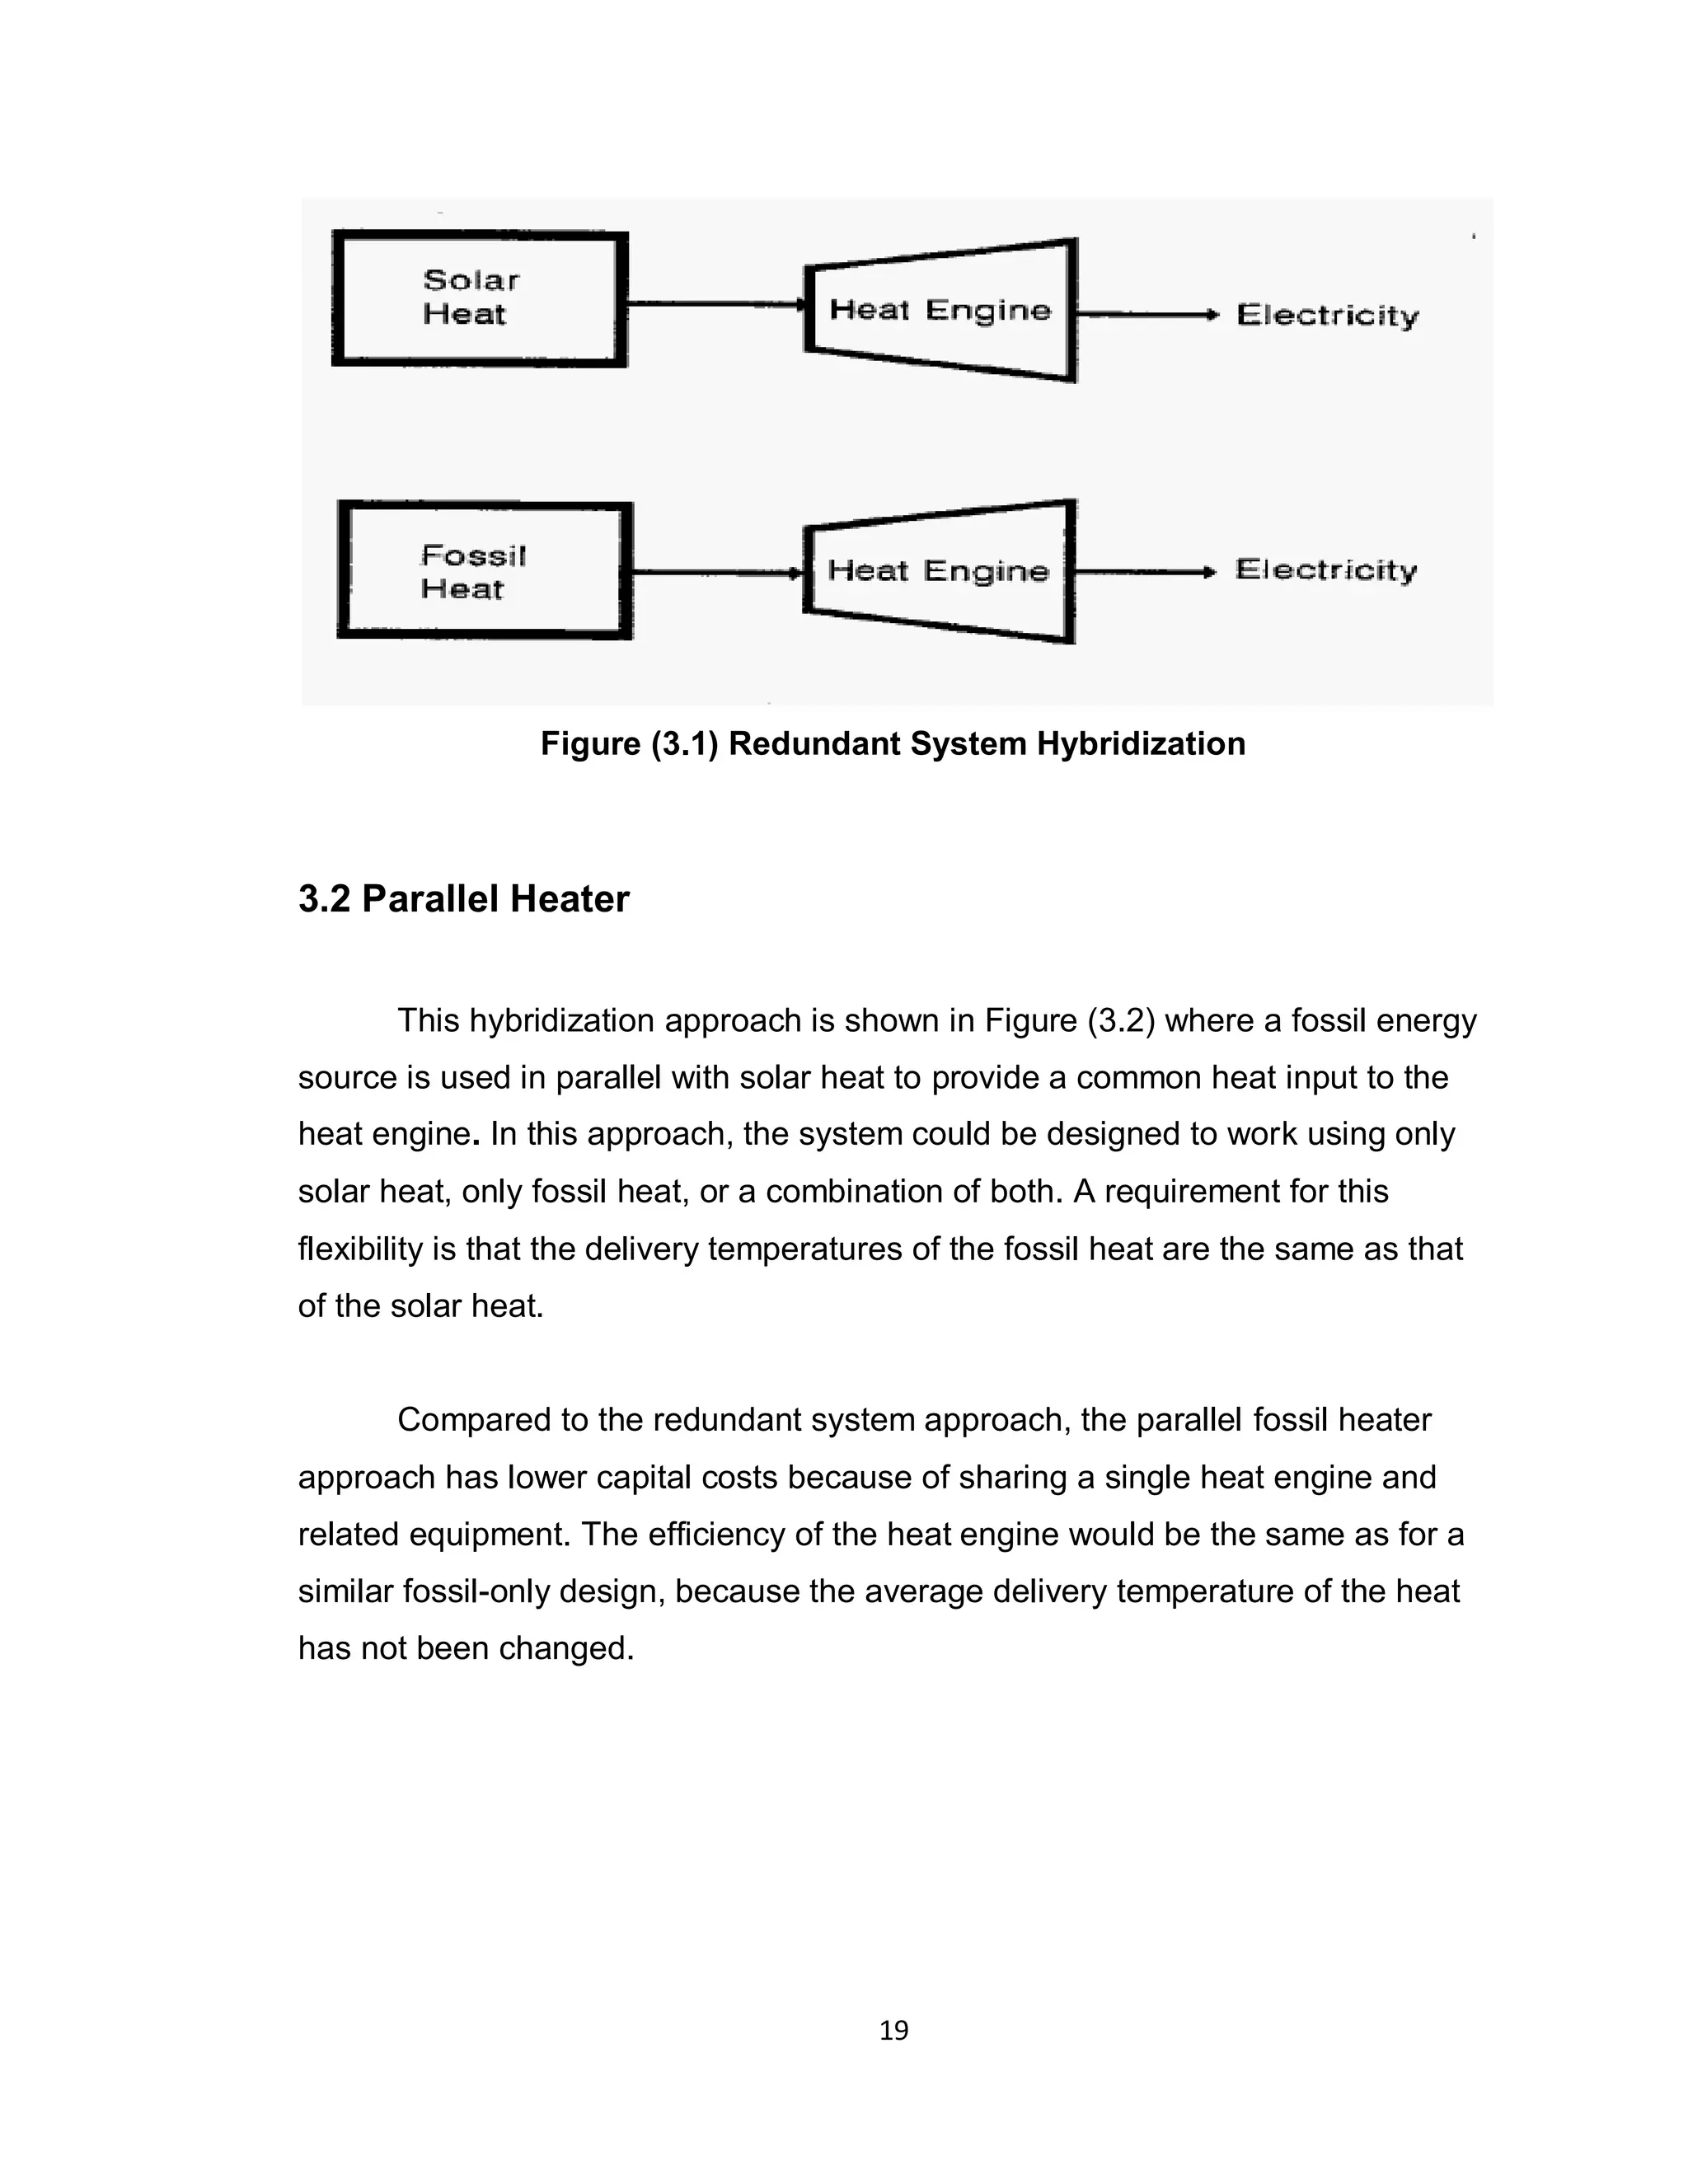
CSP systems consist of three major parts: collector (reflector), receiver and heat
transfer fluid.](https://image.slidesharecdn.com/9c3e6cc7-a938-4c33-8ada-7c9ef73985ee-150322161150-conversion-gate01/75/CSP-Project-6-2048.jpg)

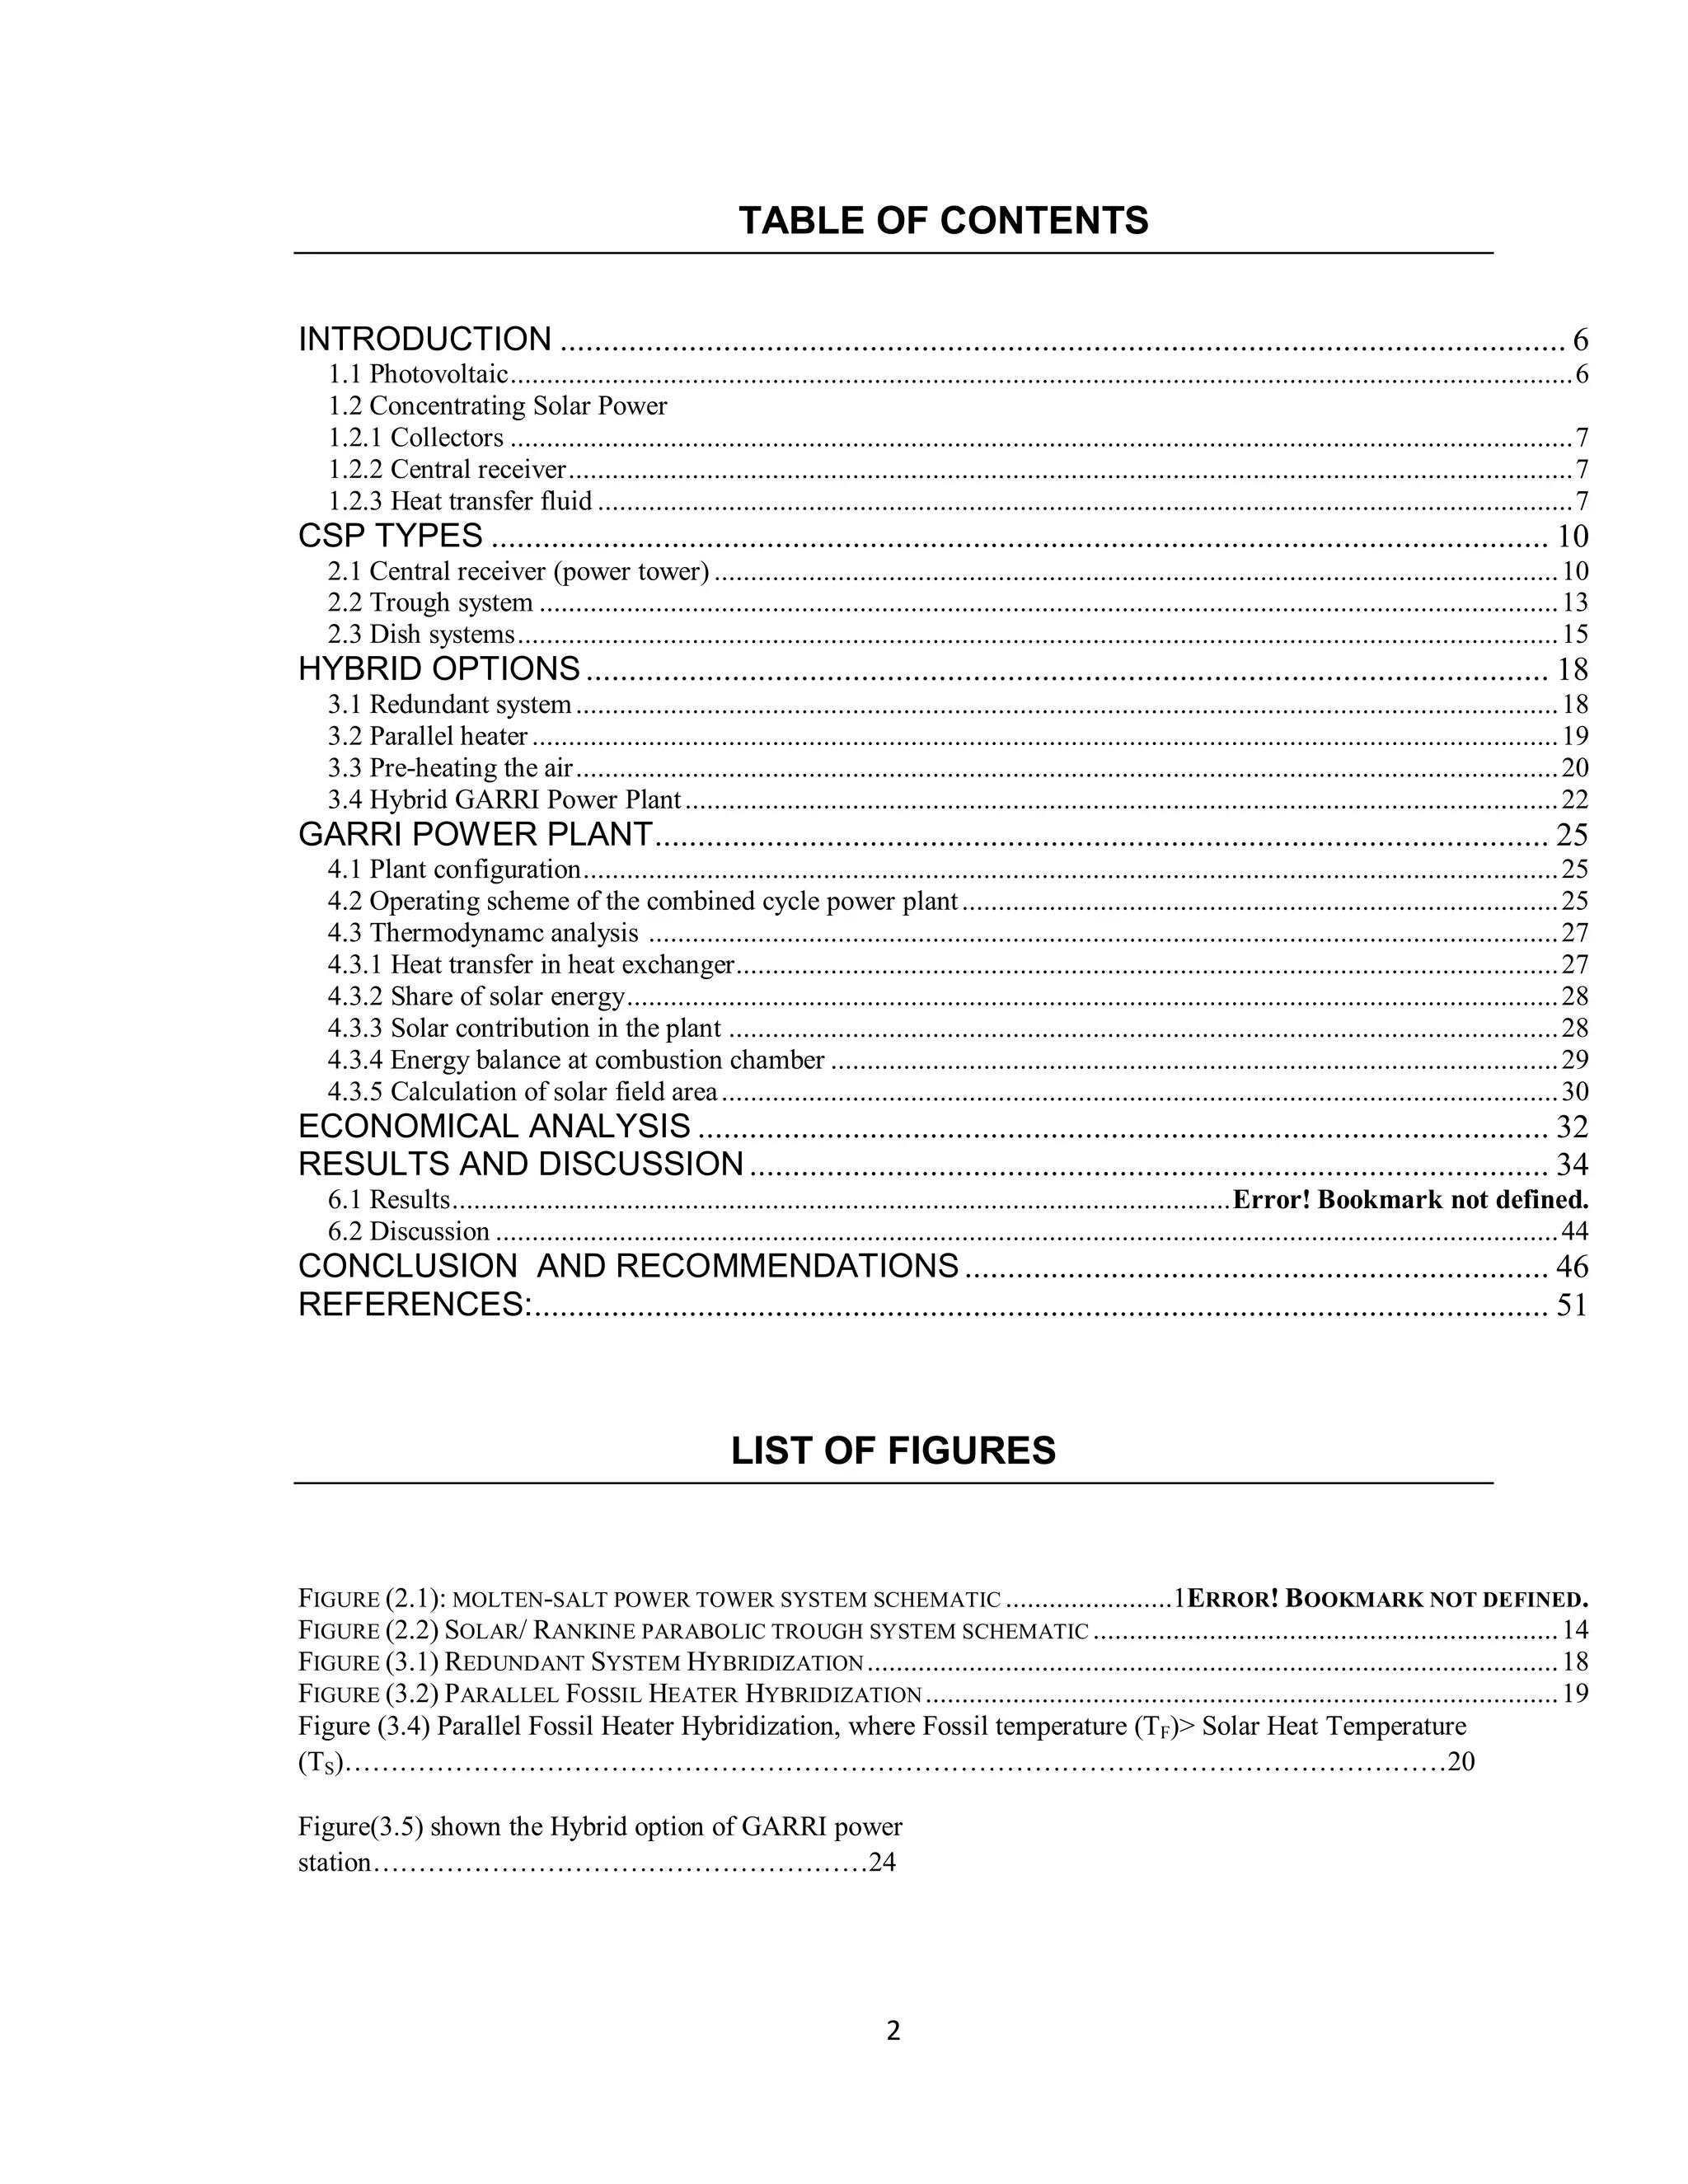
![15
Figure(2.2) shows a process flow diagram that is representative of the
majority of parabolic trough solar power plants in operation today. The collector
field consists of a large field of single-axis tracking parabolic trough solar
collectors.
The solar field is modular in nature and is composed of many parallel rows
of solar collectors aligned on a north-south horizontal axis. Each solar collector
has a linear parabolic-shaped reflector that focuses the sun’s direct beam
radiation on a linear receiver located at the focus of the parabola. The
collectors track the sun from east to west during the day to ensure that the sun
is continuously focused on the linear receiver. A heat transfer fluid (HTF) is
heated as it circulates through the receiver and returns to a series of heat
exchangers in the power block where the fluid is used to generate high-
pressure superheated steam. The superheated steam is then fed to a
conventional reheat steam turbine/generator to produce electricity. The spent
steam from the turbine is condensed in a standard condenser and returned to
the heat exchangers via condensate and feed water pumps to be transformed
back into steam. After passing through the HTF side of the solar heat
exchangers, the cooled HTF is re-circulated through the solar field [2].
2.3 Dish System:
Dish systems use dish-shaped parabolic mirrors as reflectors to
concentrate and focus the sun's rays onto a receiver, which is mounted above
the dish at the dish center. A dish/engine system is a standalone unit composed
primarily of a collector, a receiver, and an engine.
It works by collecting and concentrating the sun's energy with a dish-
shaped surface onto a receiver that absorbs the energy and transfers it to the
engine. The engine then converts that energy to heat. The heat is then converted](https://image.slidesharecdn.com/9c3e6cc7-a938-4c33-8ada-7c9ef73985ee-150322161150-conversion-gate01/75/CSP-Project-15-2048.jpg)
![16
to mechanical power, in a manner similar to conventional engines, by
compressing the working fluid when it is cold, heating the compressed working
fluid, and then expanding it through a turbine or with a piston to produce
mechanical power. An electric generator or alternator converts the mechanical
power into electrical power. Dish/engine systems use dual-axis collectors to track
the sun.
. Many options exist for receiver and engine type, including Stirling cycle,
micro turbine, and concentrating photovoltaic modules. Each dish produces 5 to
50 kW of electricity and can be used independently or linked together to increase
generating capacity. A 250-kW plant composed of ten 25-kW dish/engine
systems requires less than an acre of land. Dish/engine systems are not
commercially available yet, although ongoing
Demonstrations indicate good potential. Individual dish/engine systems
currently can generate about 25 kW of electricity. More capacity is possible by
connecting Dishes together. These systems can be combined with natural gas,
and the resulting hybrid provides continuous power generation [3].](https://image.slidesharecdn.com/9c3e6cc7-a938-4c33-8ada-7c9ef73985ee-150322161150-conversion-gate01/75/CSP-Project-16-2048.jpg)

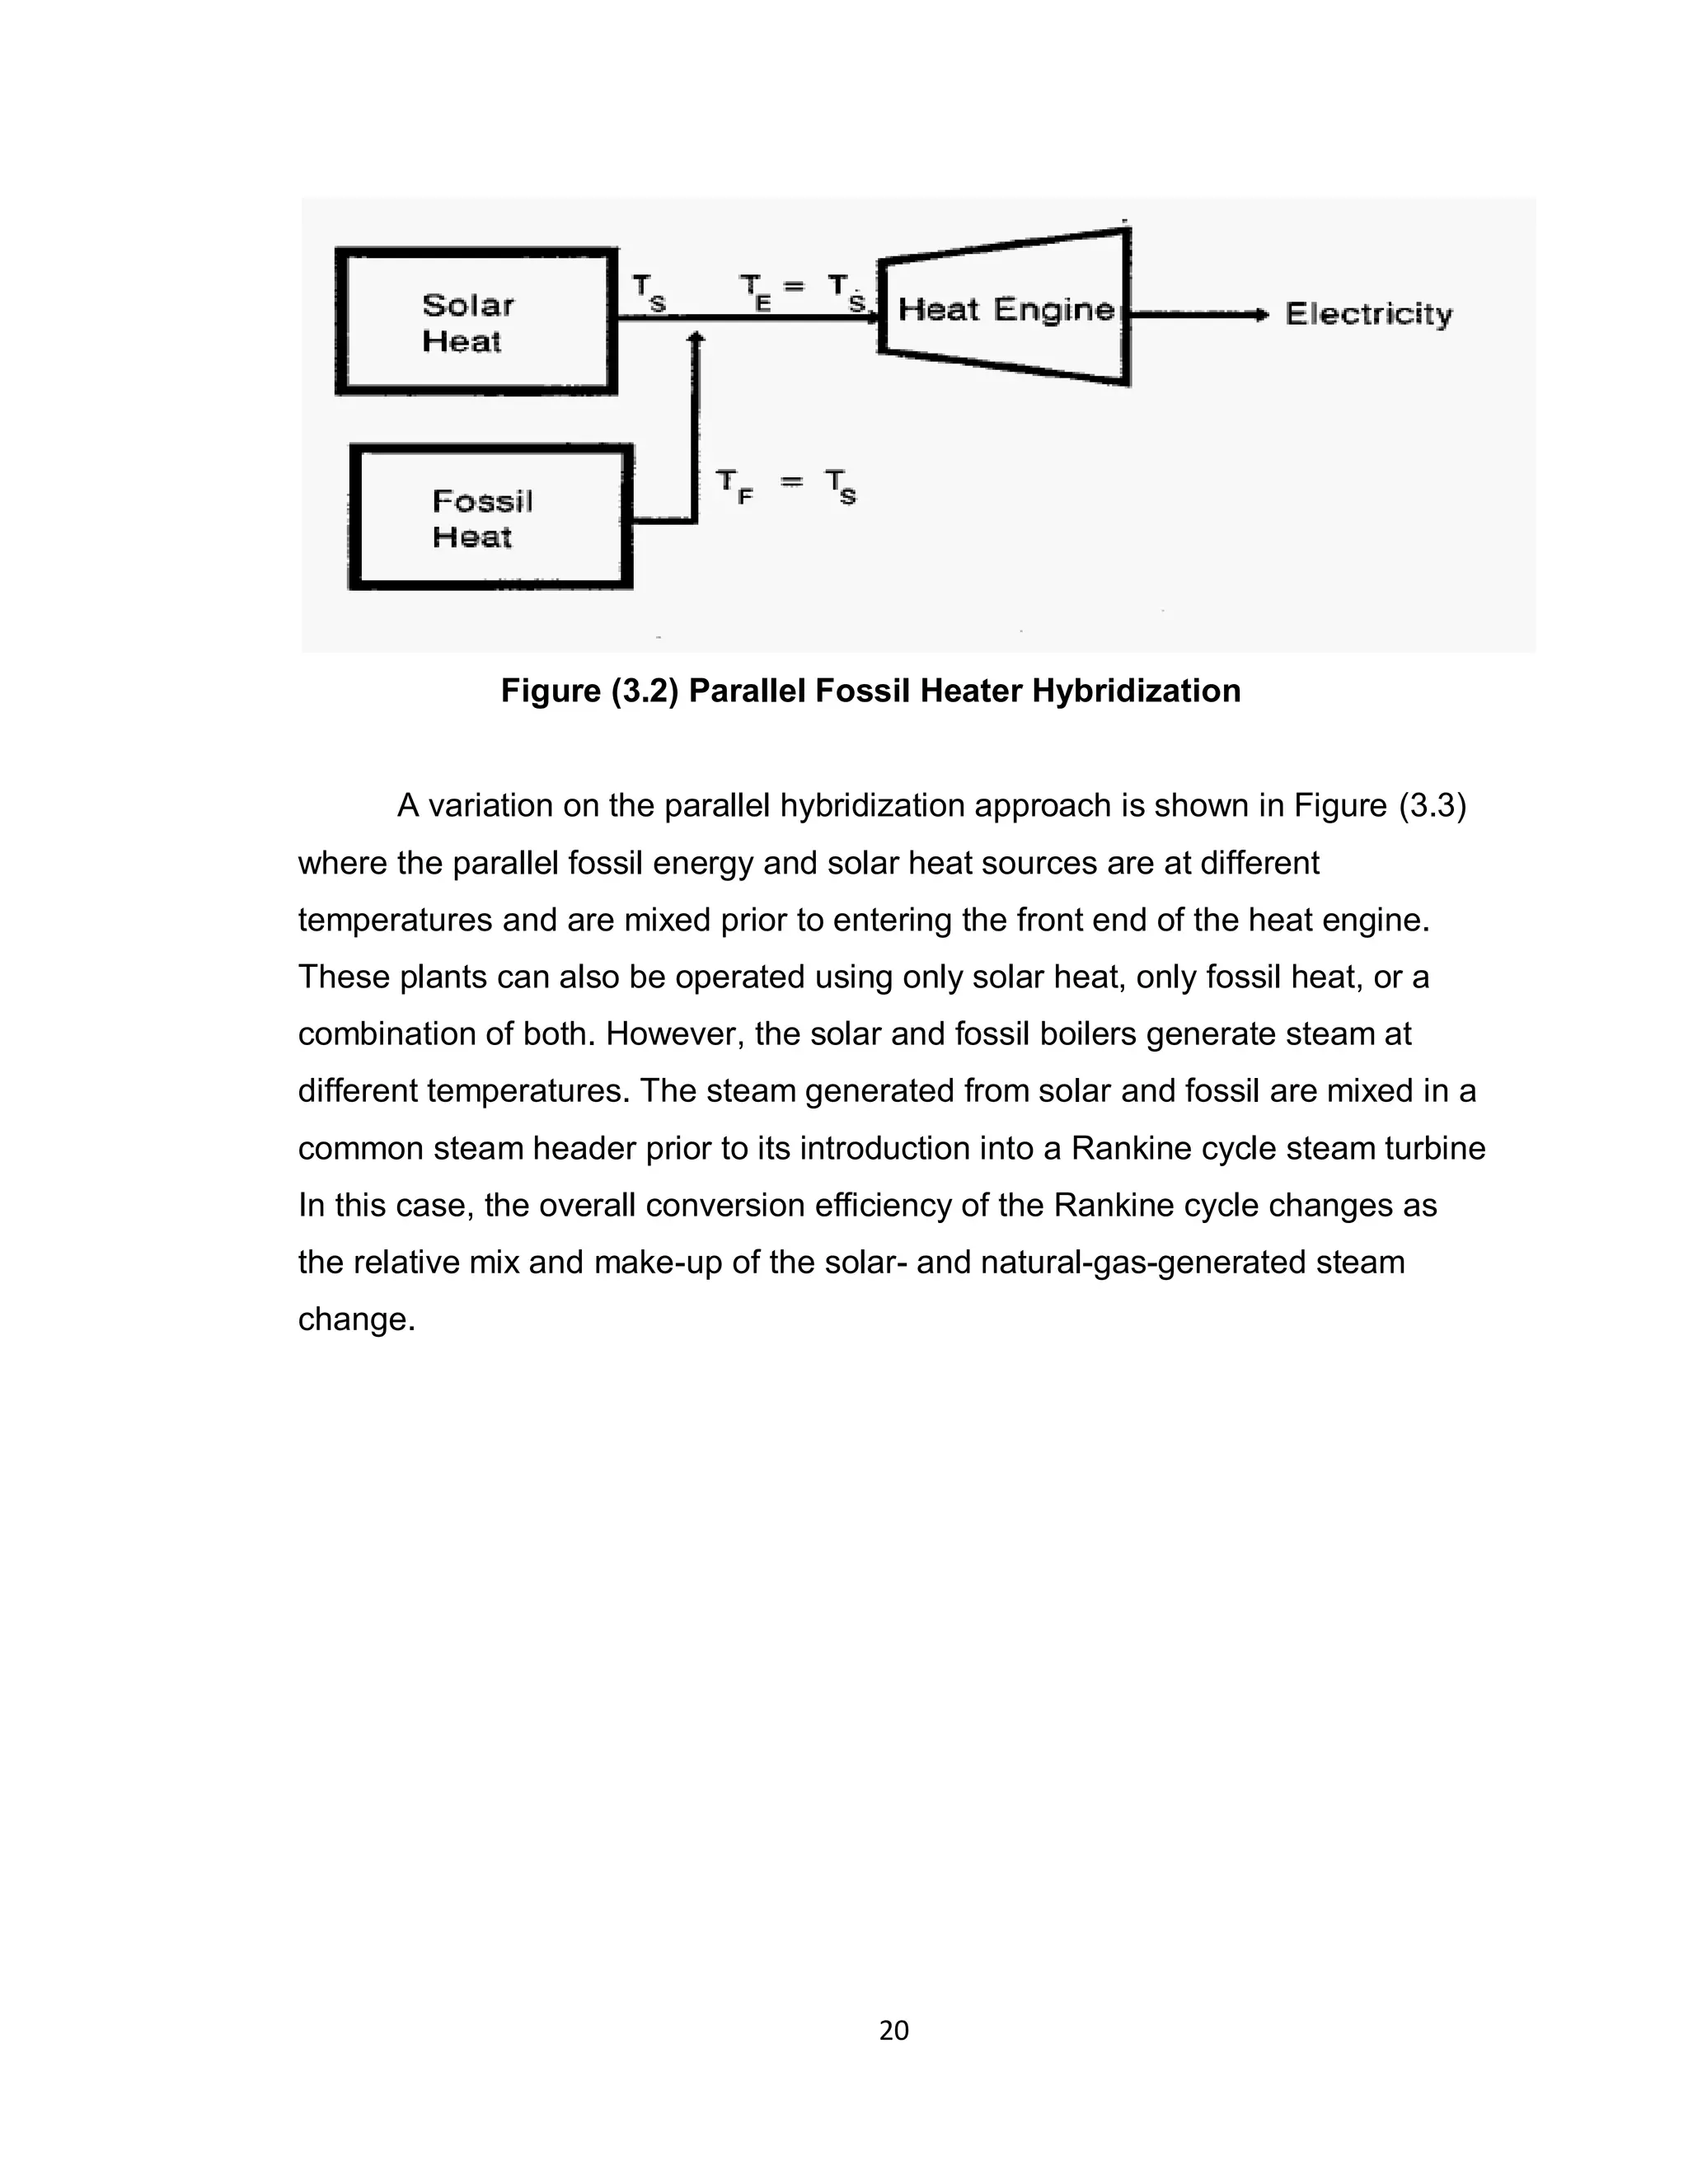
![21
Figure (3.4) Parallel Fossil Heater Hybridization, where Fossil
temperature (TF)> Solar Heat Temperature (TS)
Where Tf , Ts , Te = Fossil, solar and engine temperature respectively
3.3 Pre-heating the air:
The final basic hybridization approach is solar preheat in which fossil heat
provides temperature topping, as shown in Figure (3.4) below. In the temperature
topping approach, energy from fossil fuel combustion is used to raise the
temperature to TE prior to the heat engine.
An advantage of this approach is that the selection of the heat engine can
be made for the most efficient and economic system regardless of the
capabilities of the solar technology. This allows the selection of combined cycle
or aero derivative turbines based on their attractive features, without having to
suffer the research and development issues and efficiency drawbacks of
producing solar heat at a very high temperature. A disadvantage of the approach
is that the system cannot operate without fossil energy [4].](https://image.slidesharecdn.com/9c3e6cc7-a938-4c33-8ada-7c9ef73985ee-150322161150-conversion-gate01/75/CSP-Project-21-2048.jpg)

![27
delivered by one of the two (2) x 100% condensate pumps to the dearator water
tank each condensate pump is provided with separate suction lines from the hot
well ensuring a short and direct connection. One pump is in operation, the
second serves as standby and is switched on automatically in case of failure of
the running pump. The level in the hot well is kept constant by control of the
make-up feed. A condensate minimum flow check valve is provided to ensure
minimum flow through the condensate pumps.
The feed water is fed back to the HRSGs by three (3) x 50% constant speed HP
feed-water pumps and by two (2.)-10.0% constant speed LP feed water pumps.
One pump is at standby and is switched on automatically in case of failure of a
running pump. A feed water pump minimum flow check valve is provided to
ensure minimum flow through the feed water pump.
To increase the operational flexibility during start up, shut down and
abnormal operating conditions separated bypass stations for HP steam source is
provided. The HP bypass stations are designed to accommodate 100% of the
maximum steam production into the condenser. Each bypass station consists of
an isolation valve, a steam pressure reducing valve, a desuperheating station
with the associated measurement, control and protection device. Main
condensate is used for desuperheating the steam down to the saturation point
before entering in the condenser.
The LPG heating steam is from auxiliary boiler when unit start-up and in simple
cycle. In normal operation LPG heating steam is from Steam Turbine extraction.
The extraction pressure and temperature are designed to meet the LPG heating
required. [5]
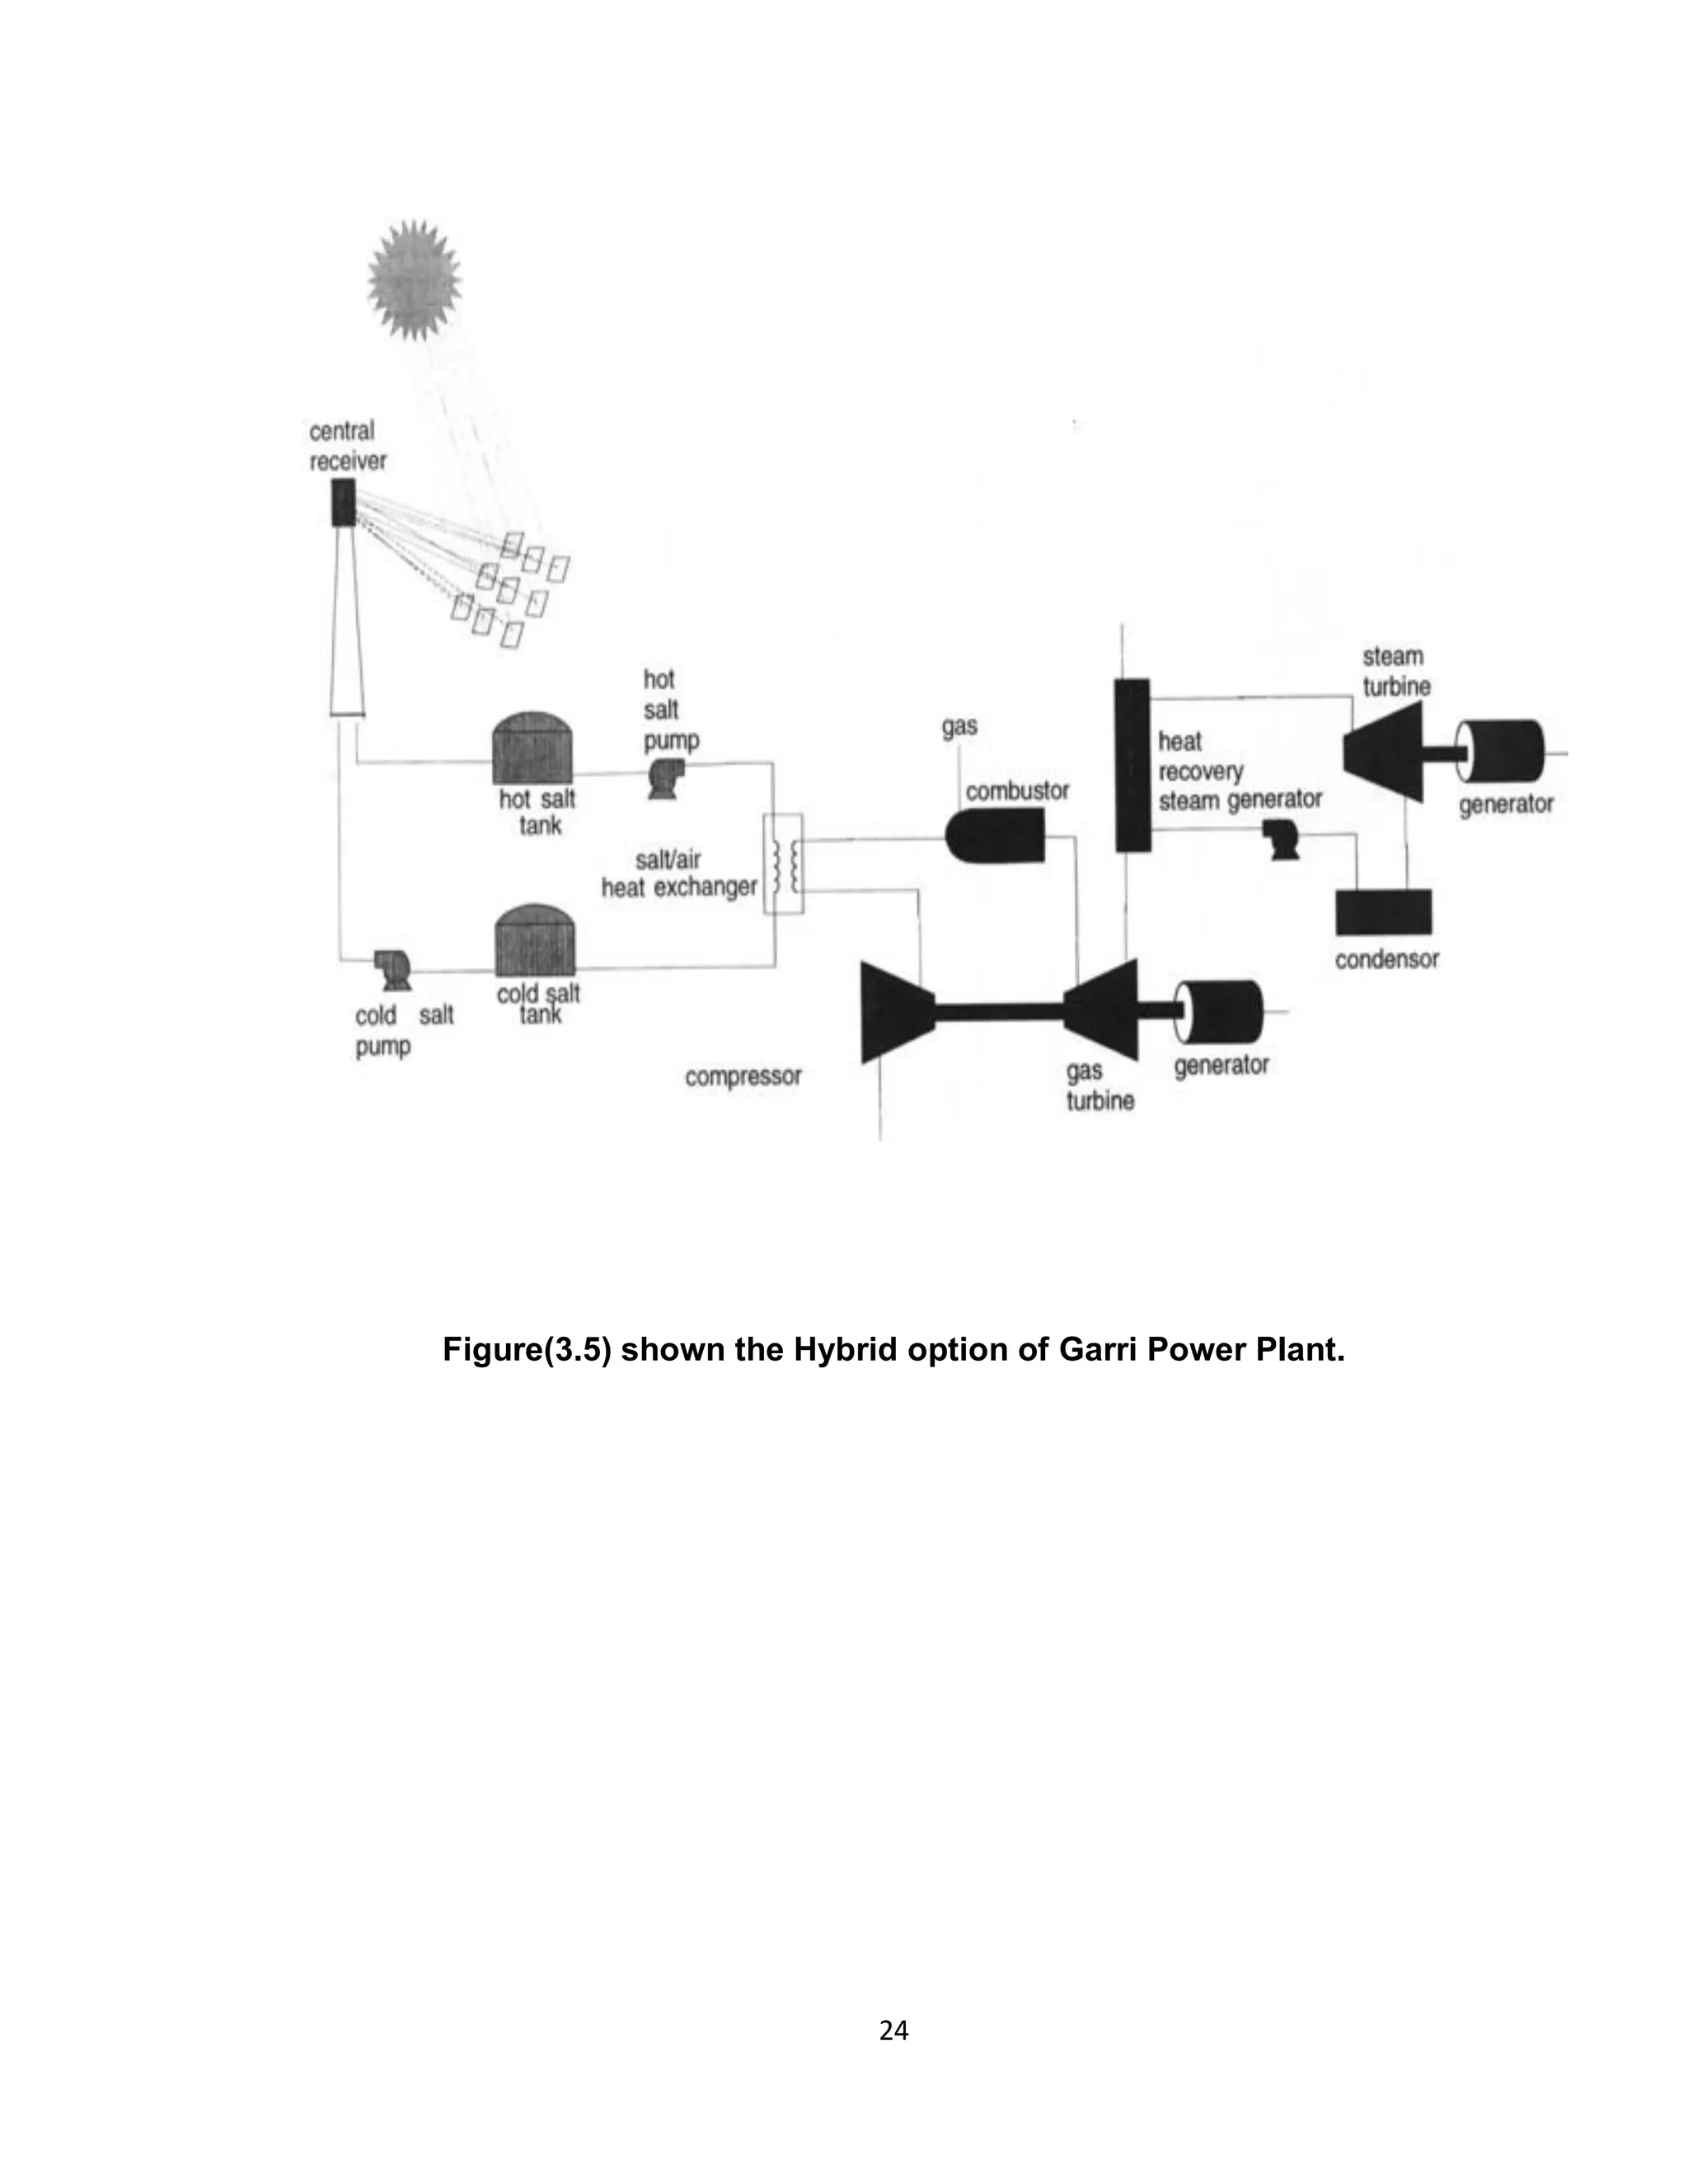
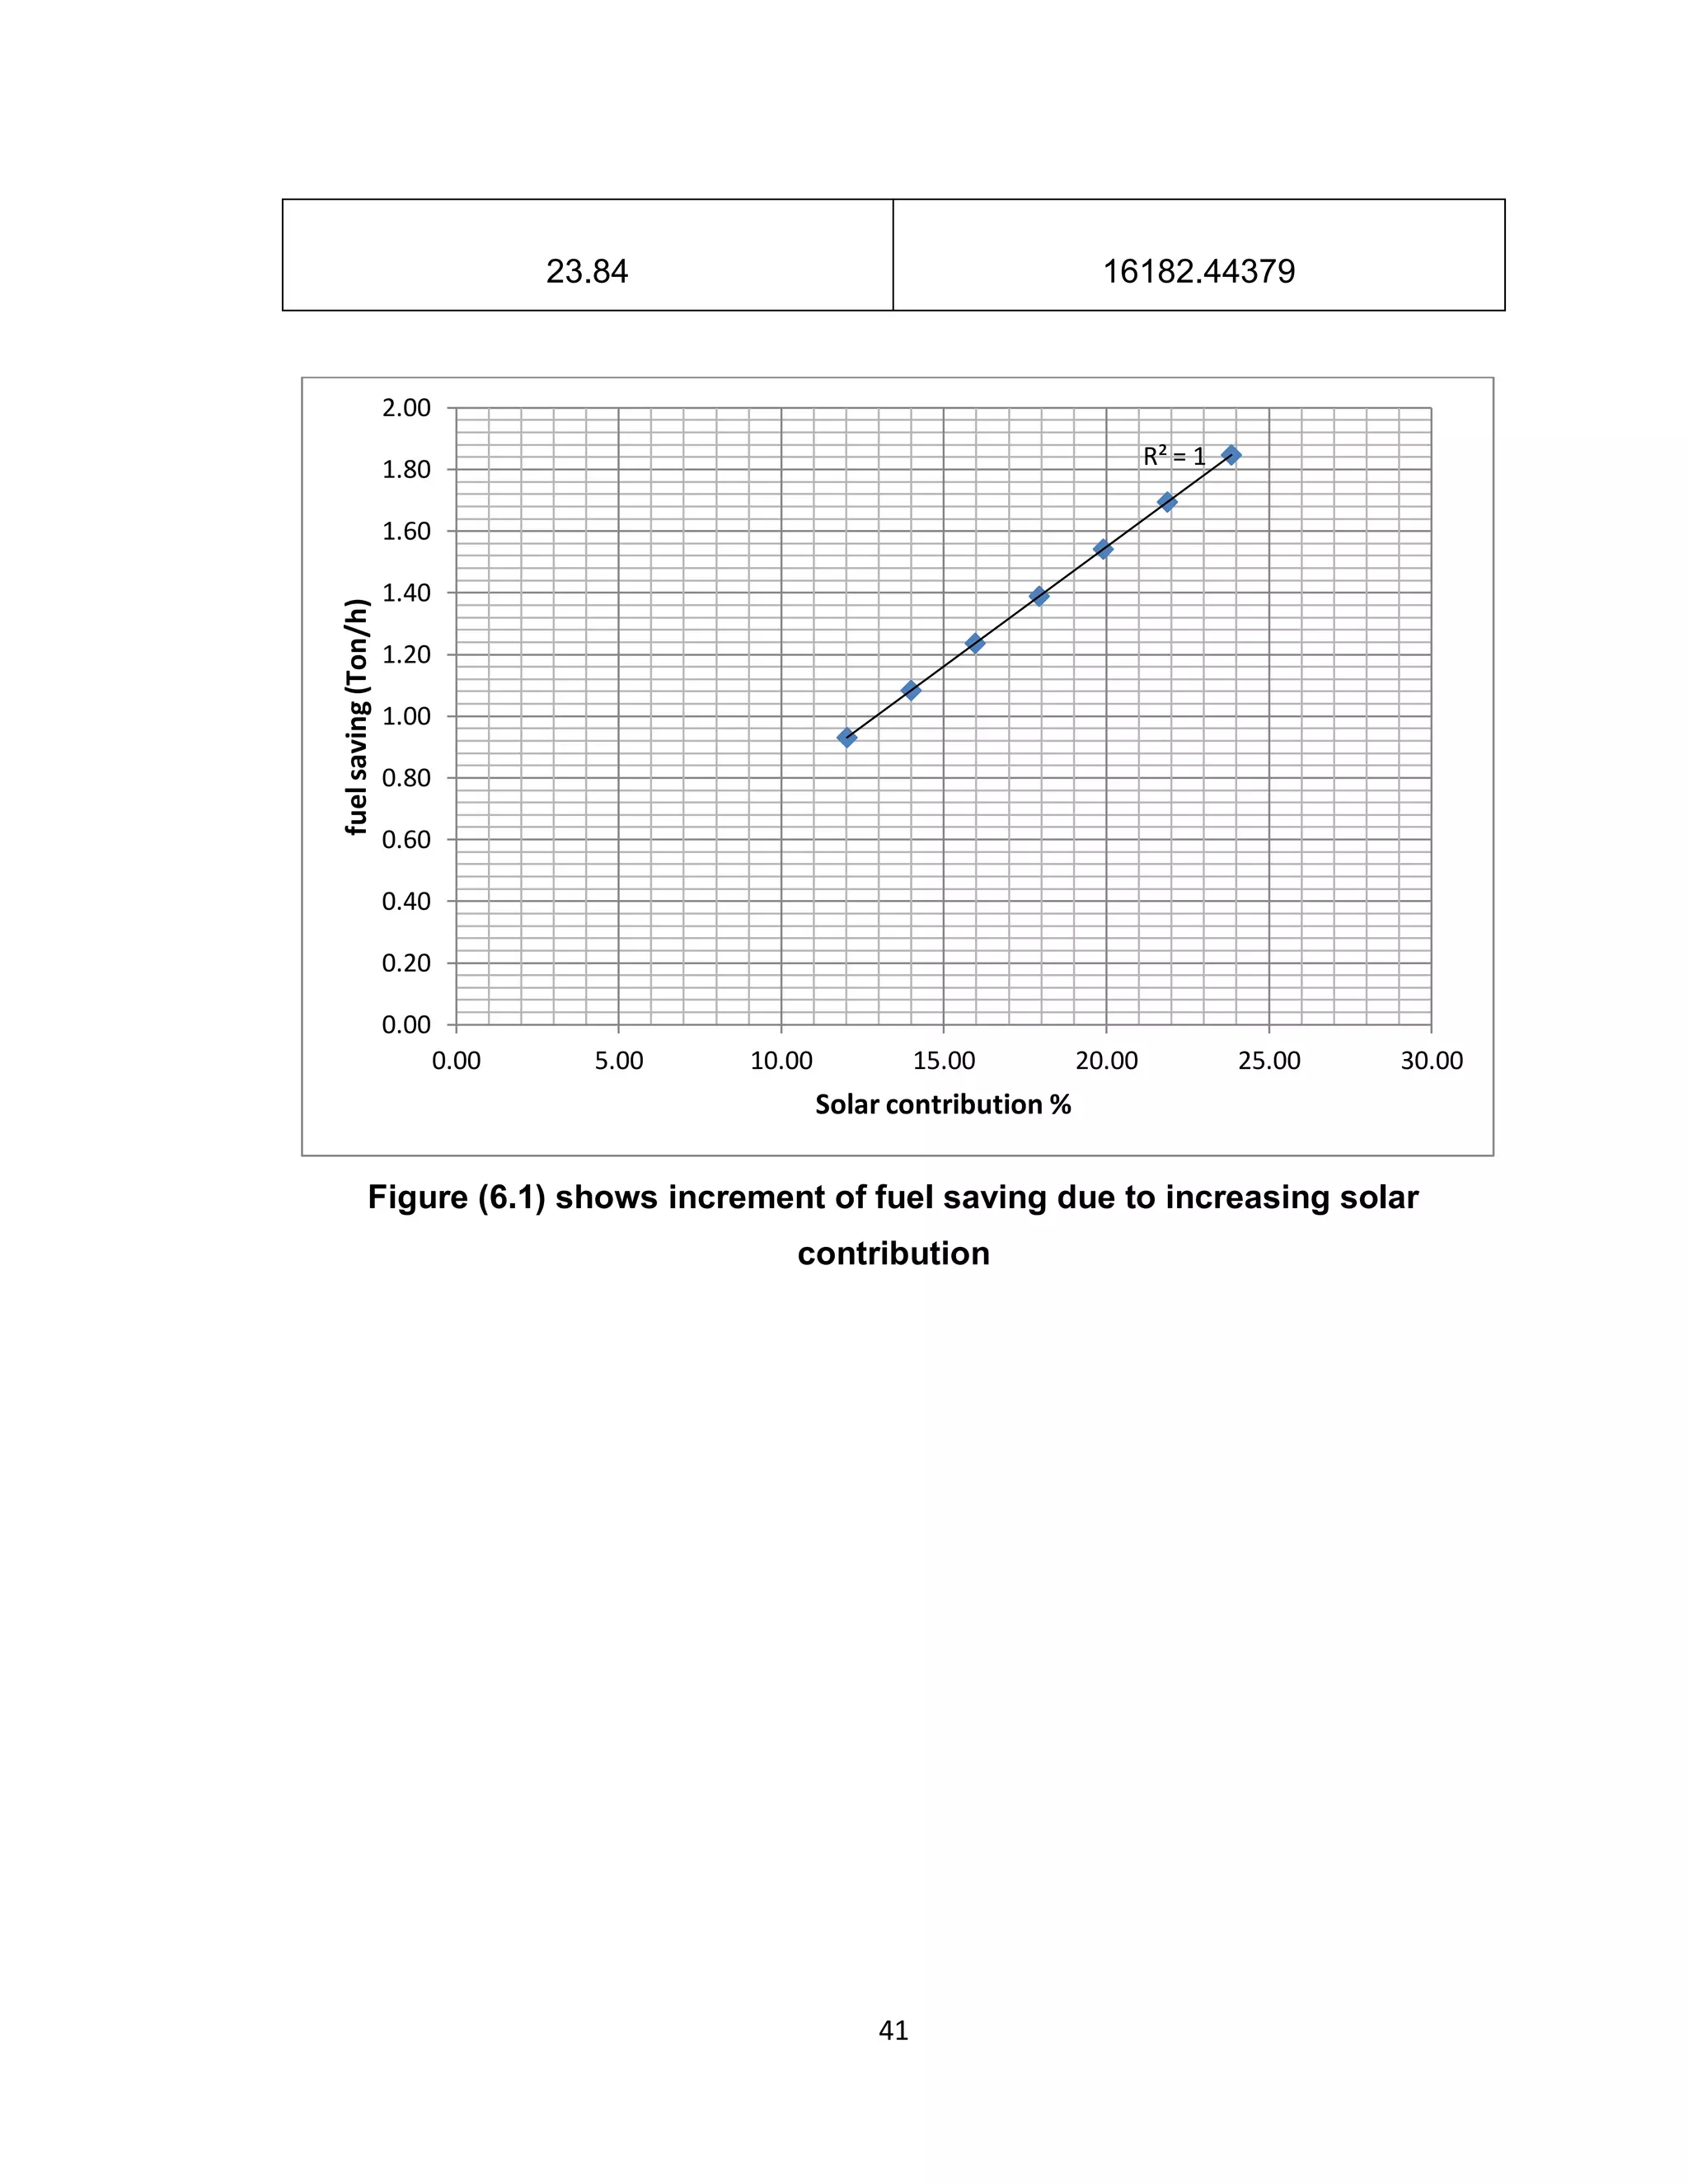
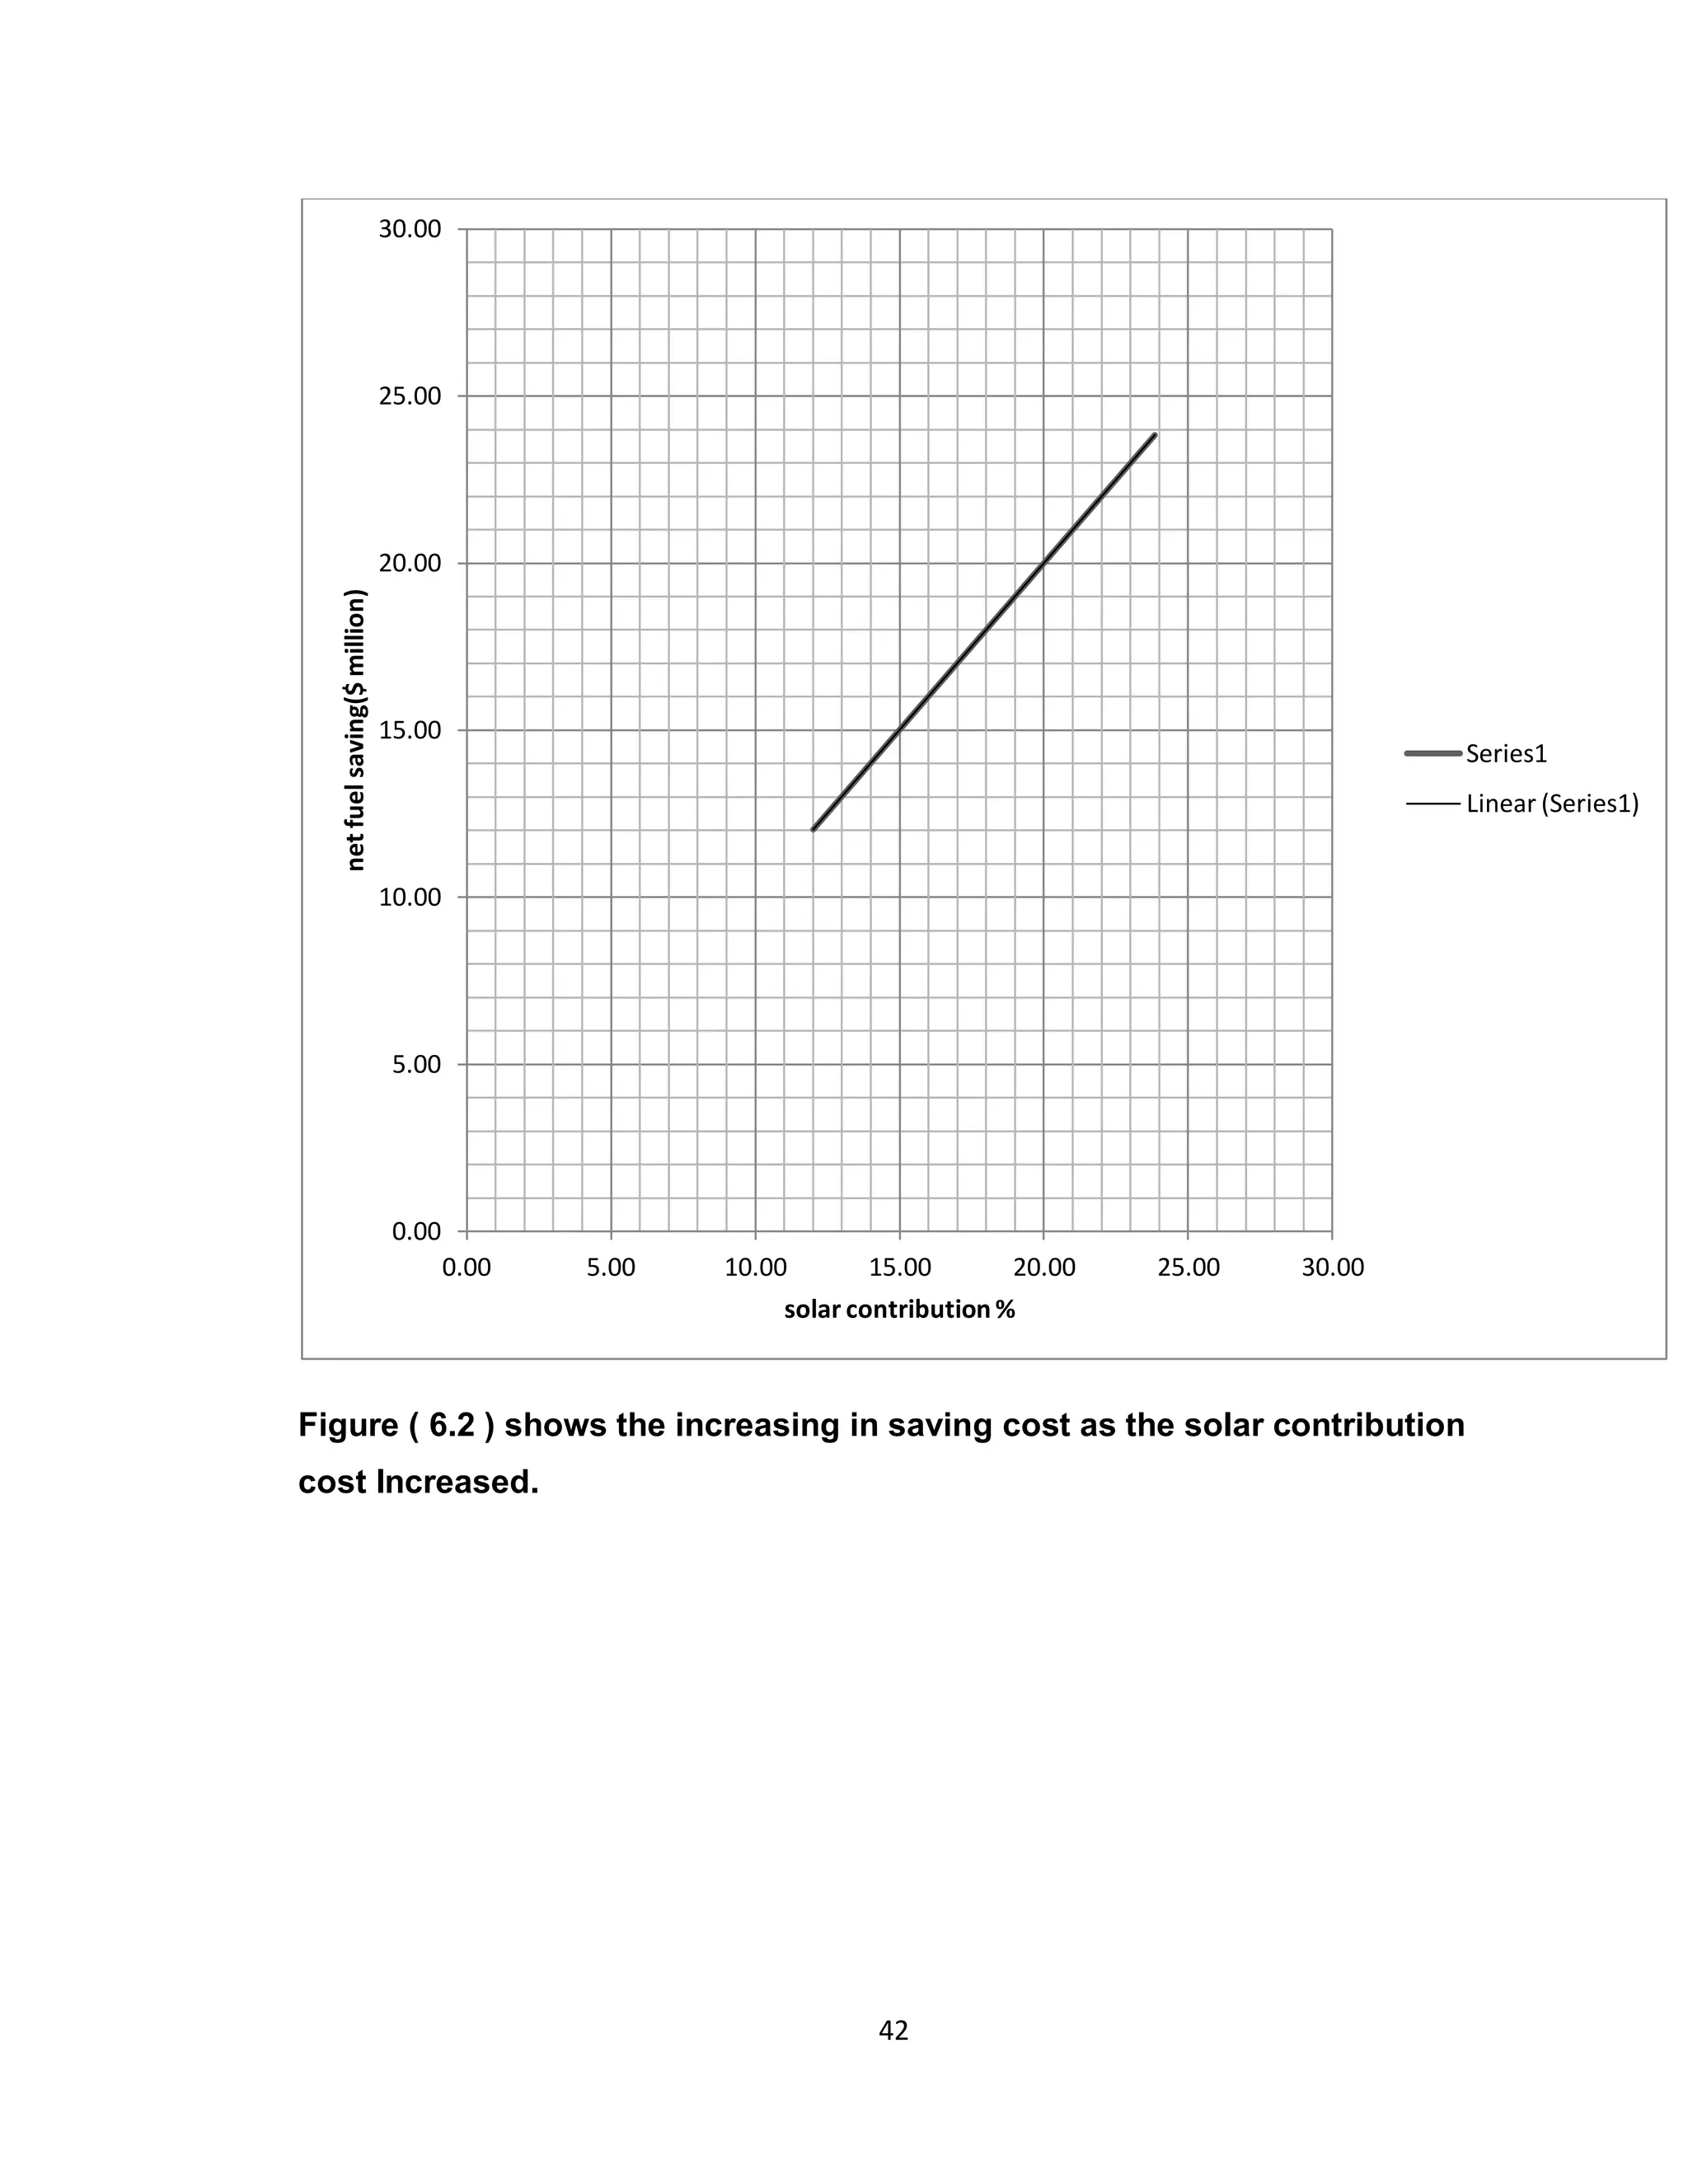
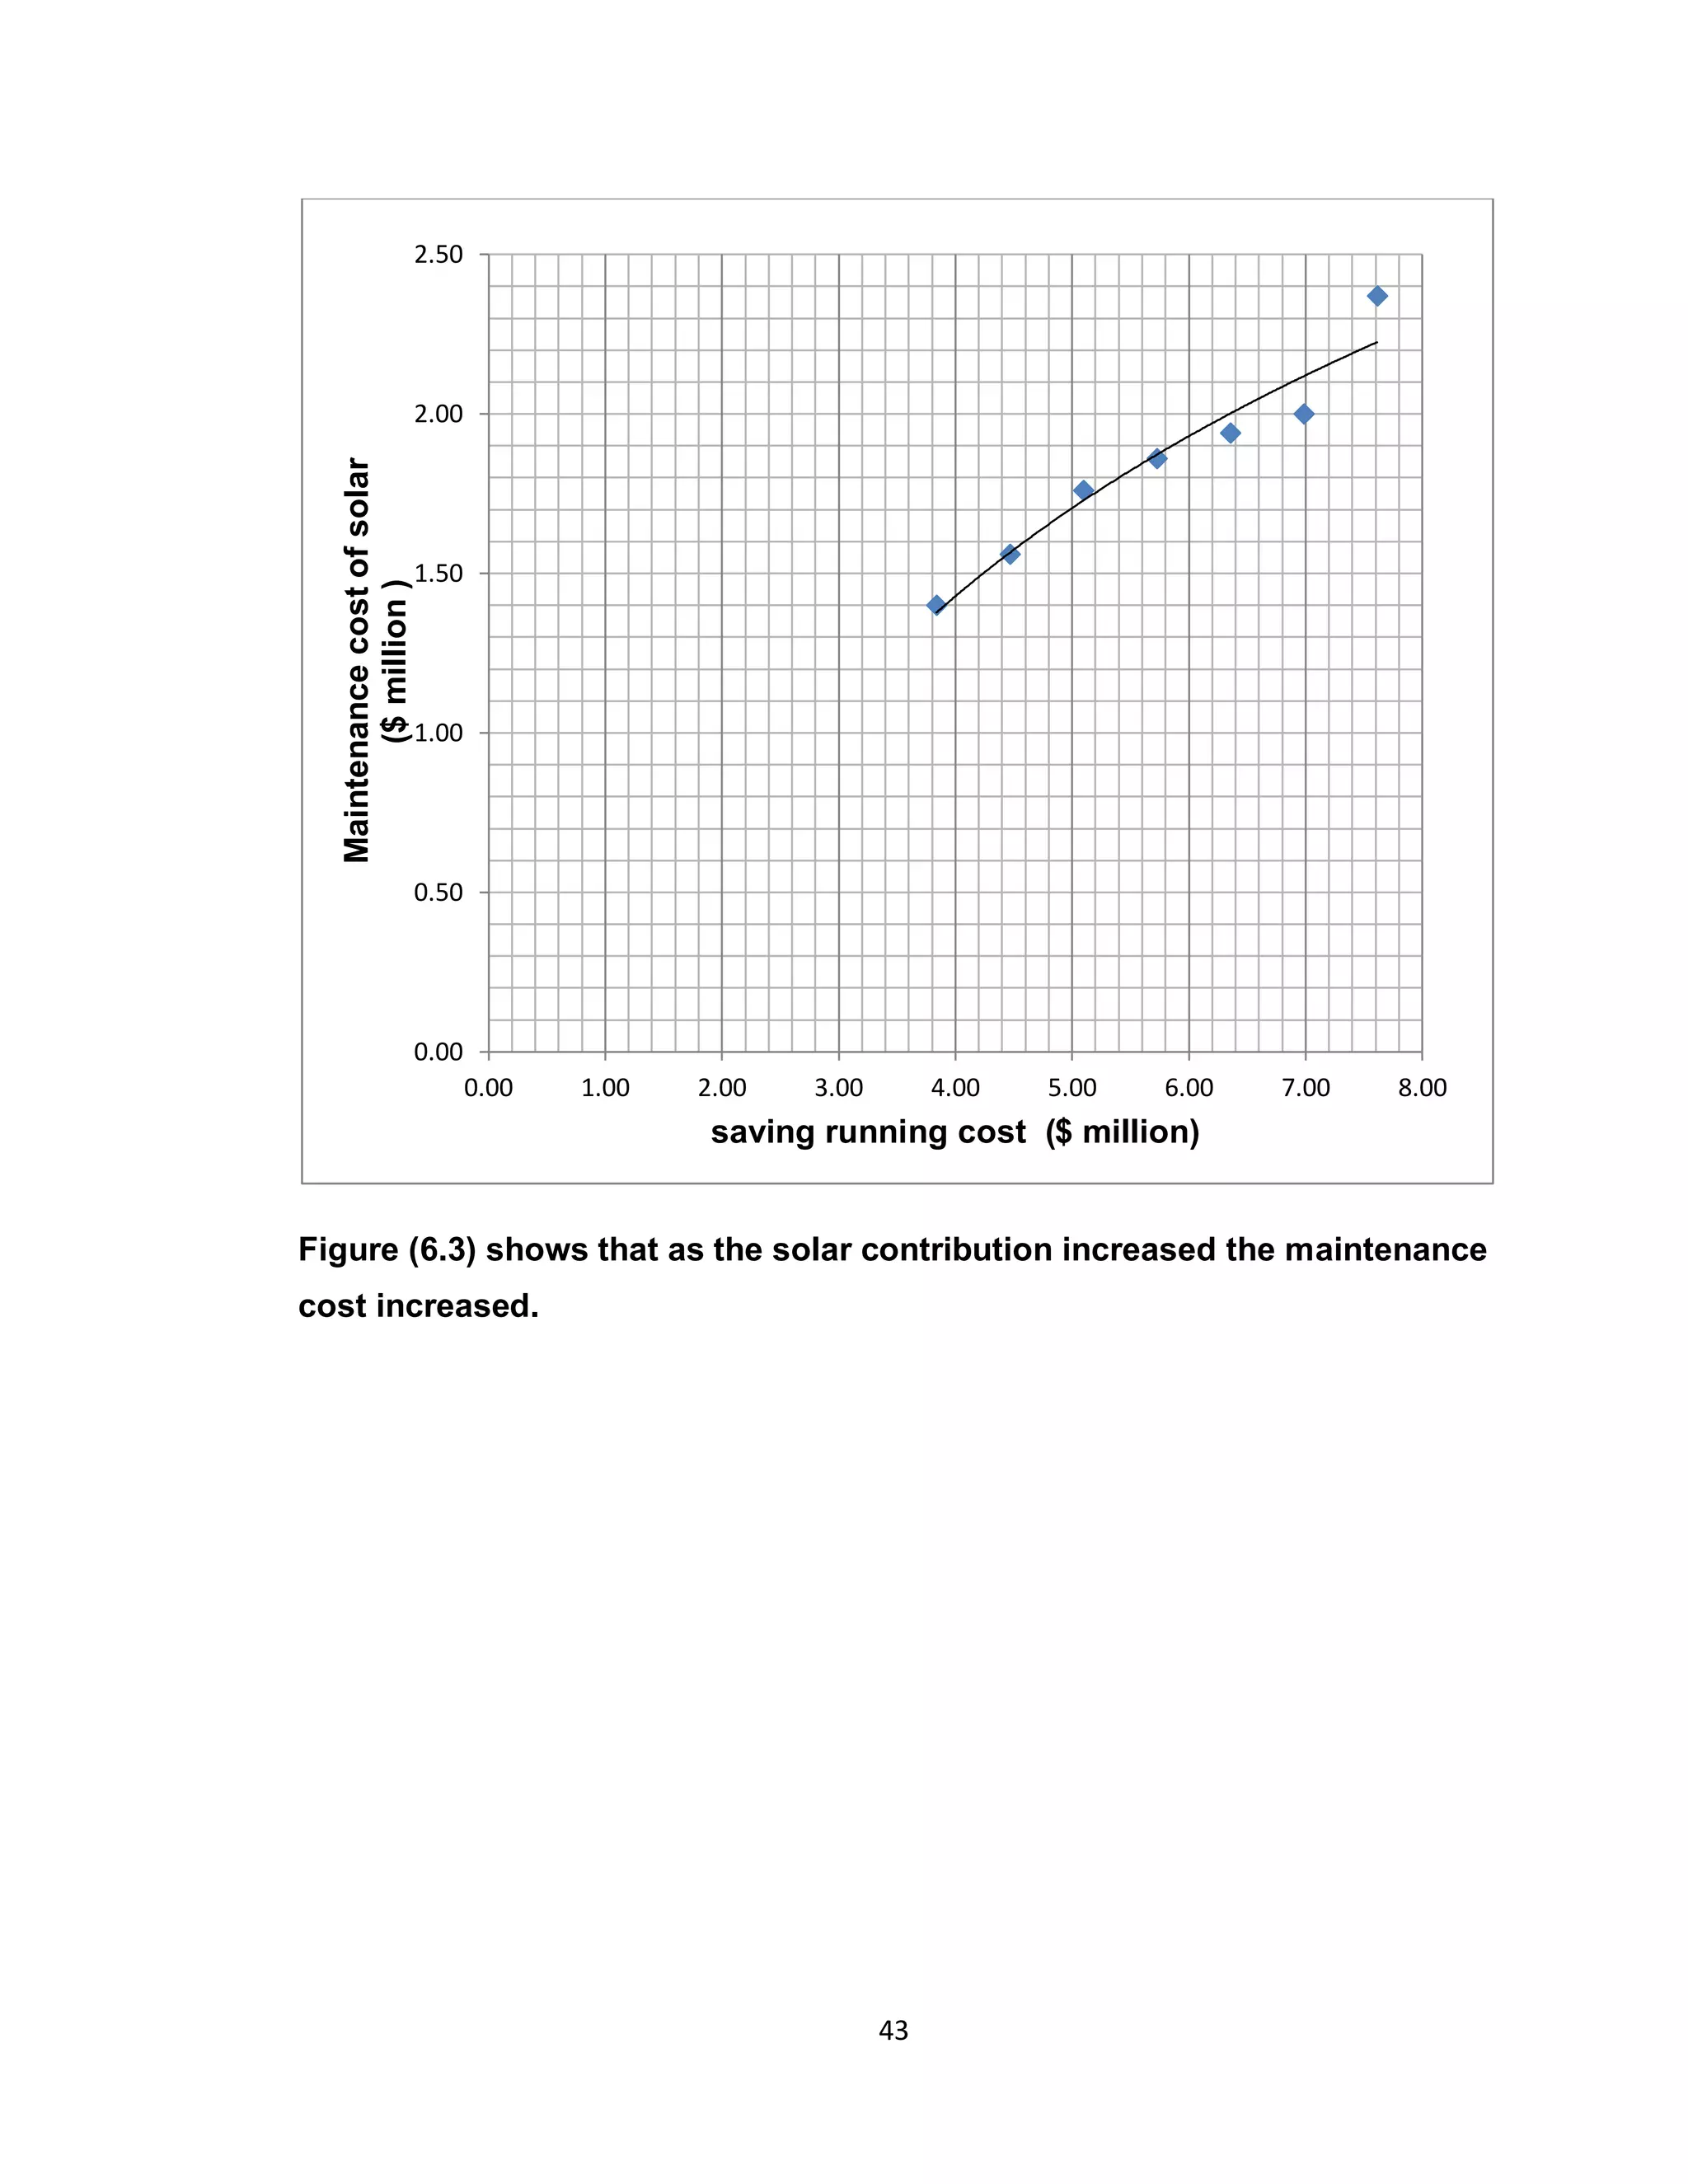
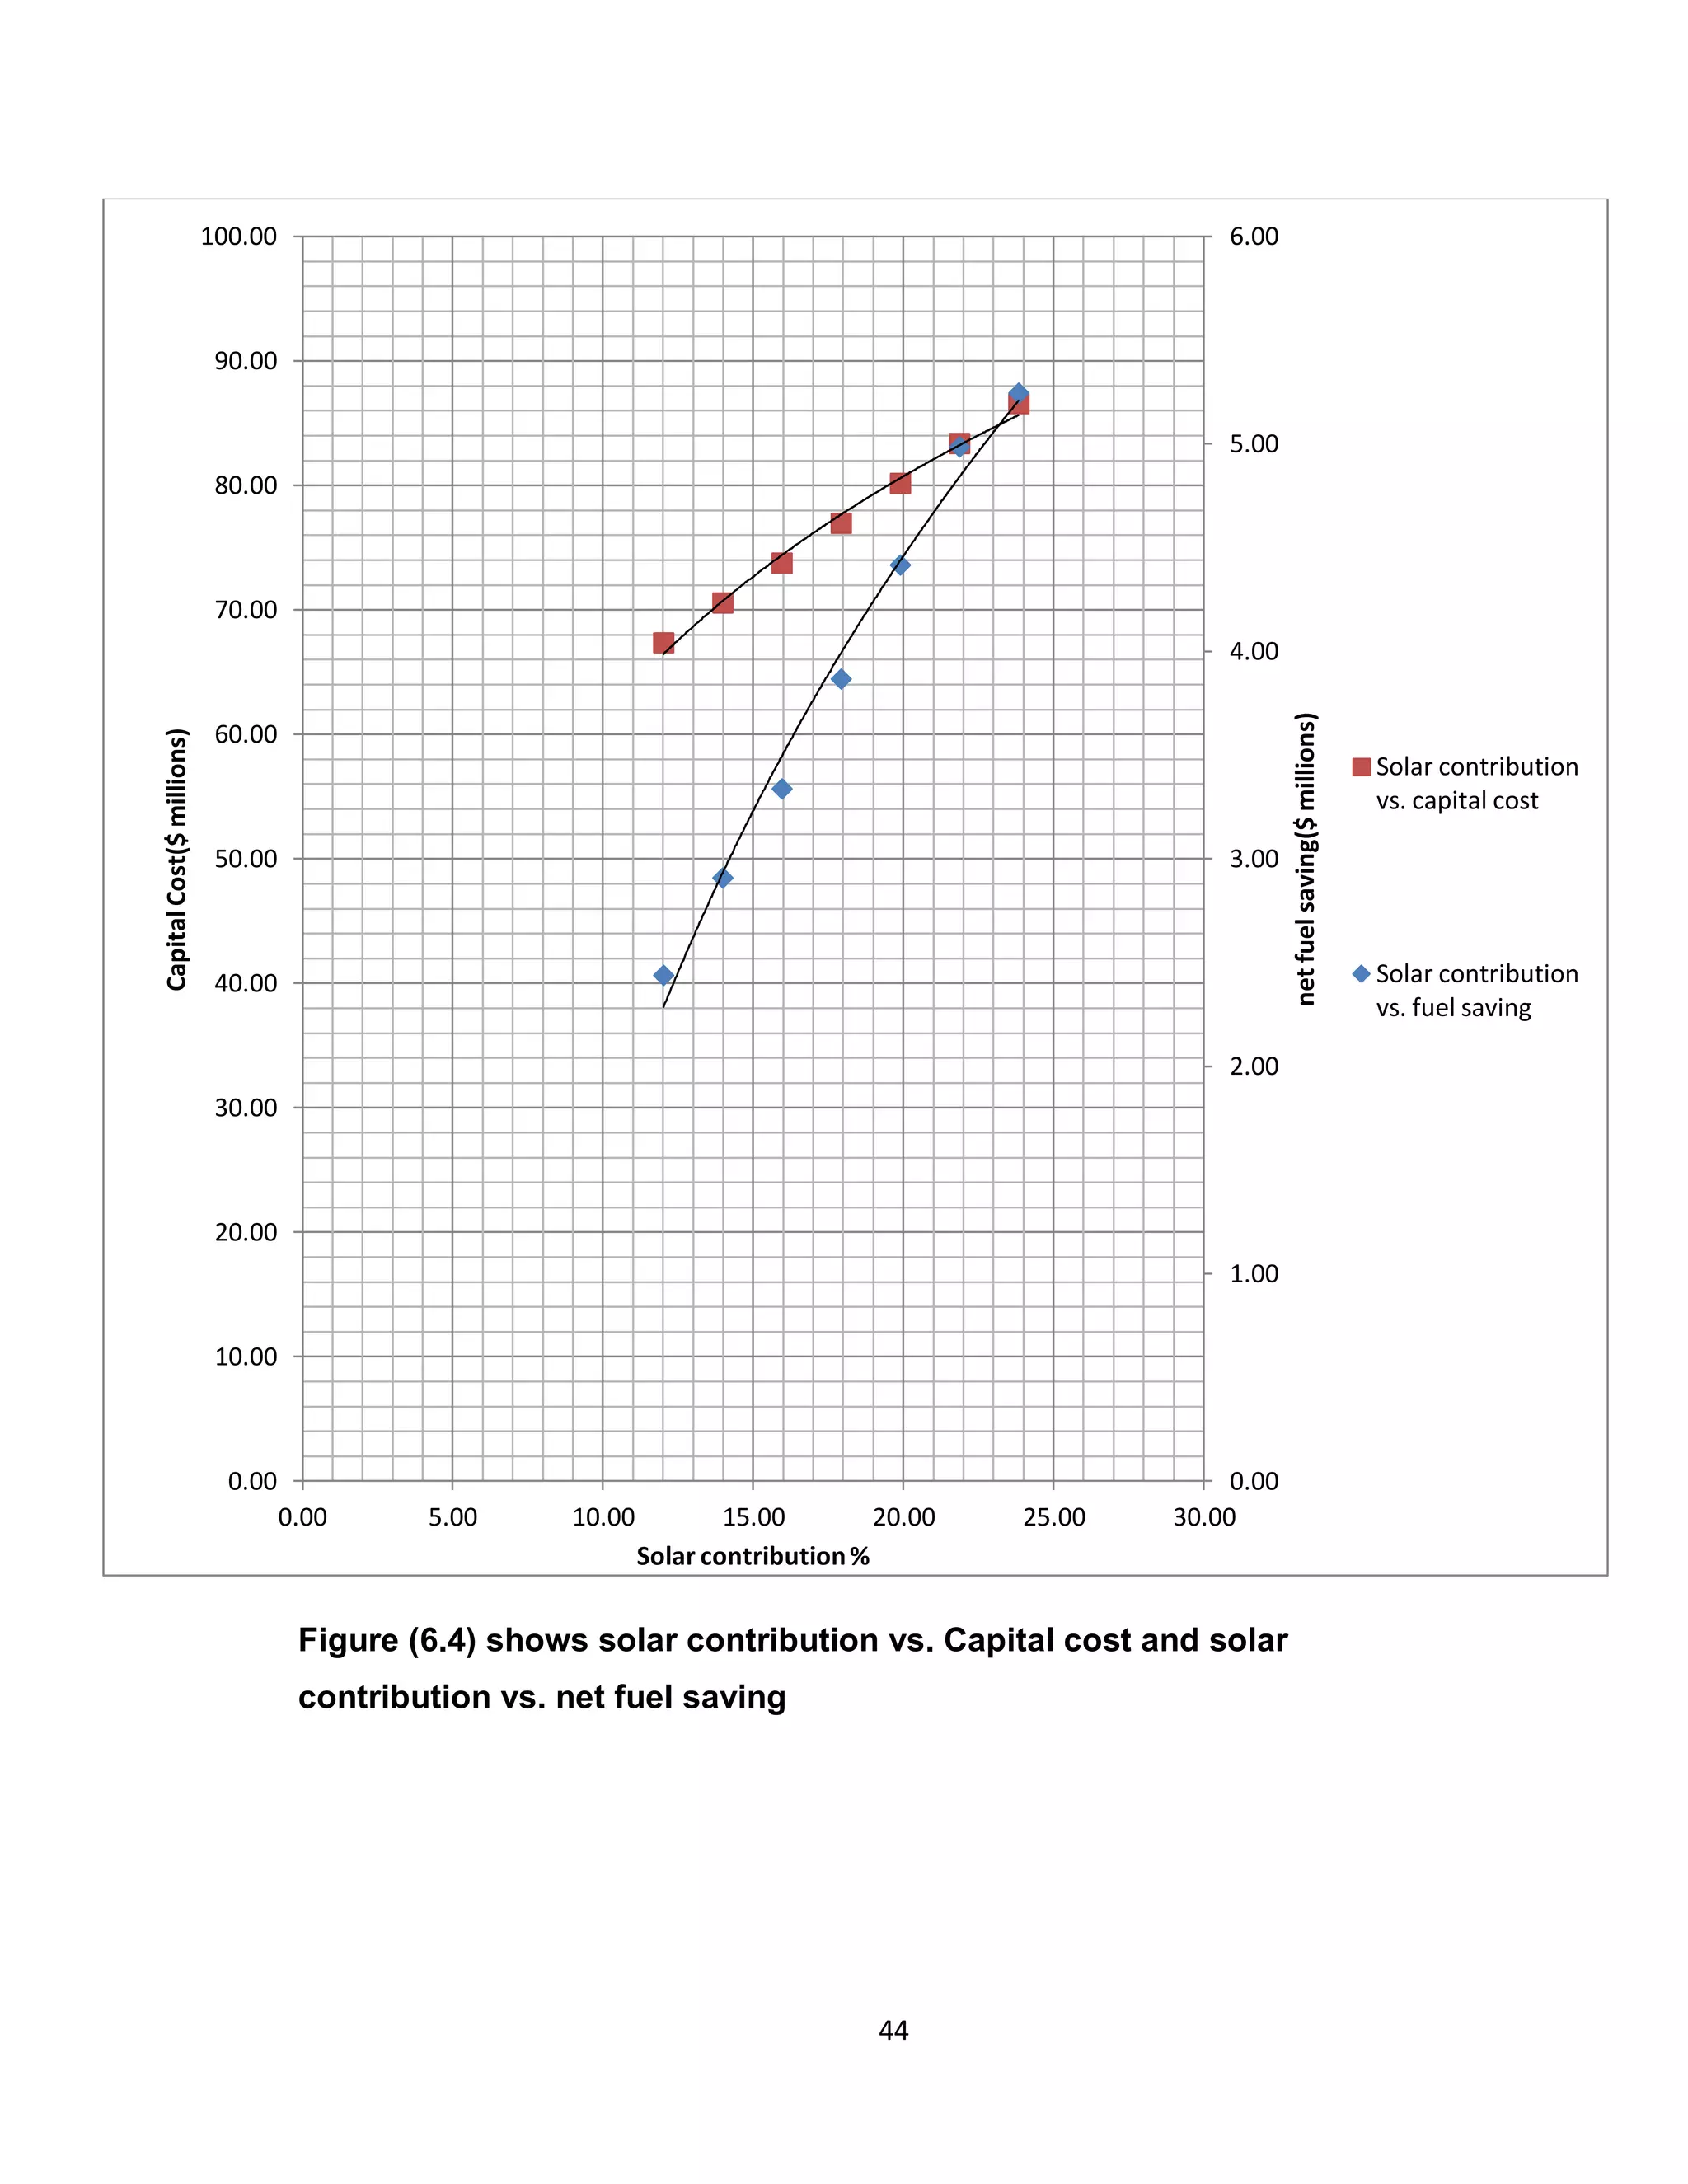
4.3 Thermodynamic analysis of fuel saving option by using solar
energy as a Pre-Heater:](https://image.slidesharecdn.com/9c3e6cc7-a938-4c33-8ada-7c9ef73985ee-150322161150-conversion-gate01/75/CSP-Project-27-2048.jpg)
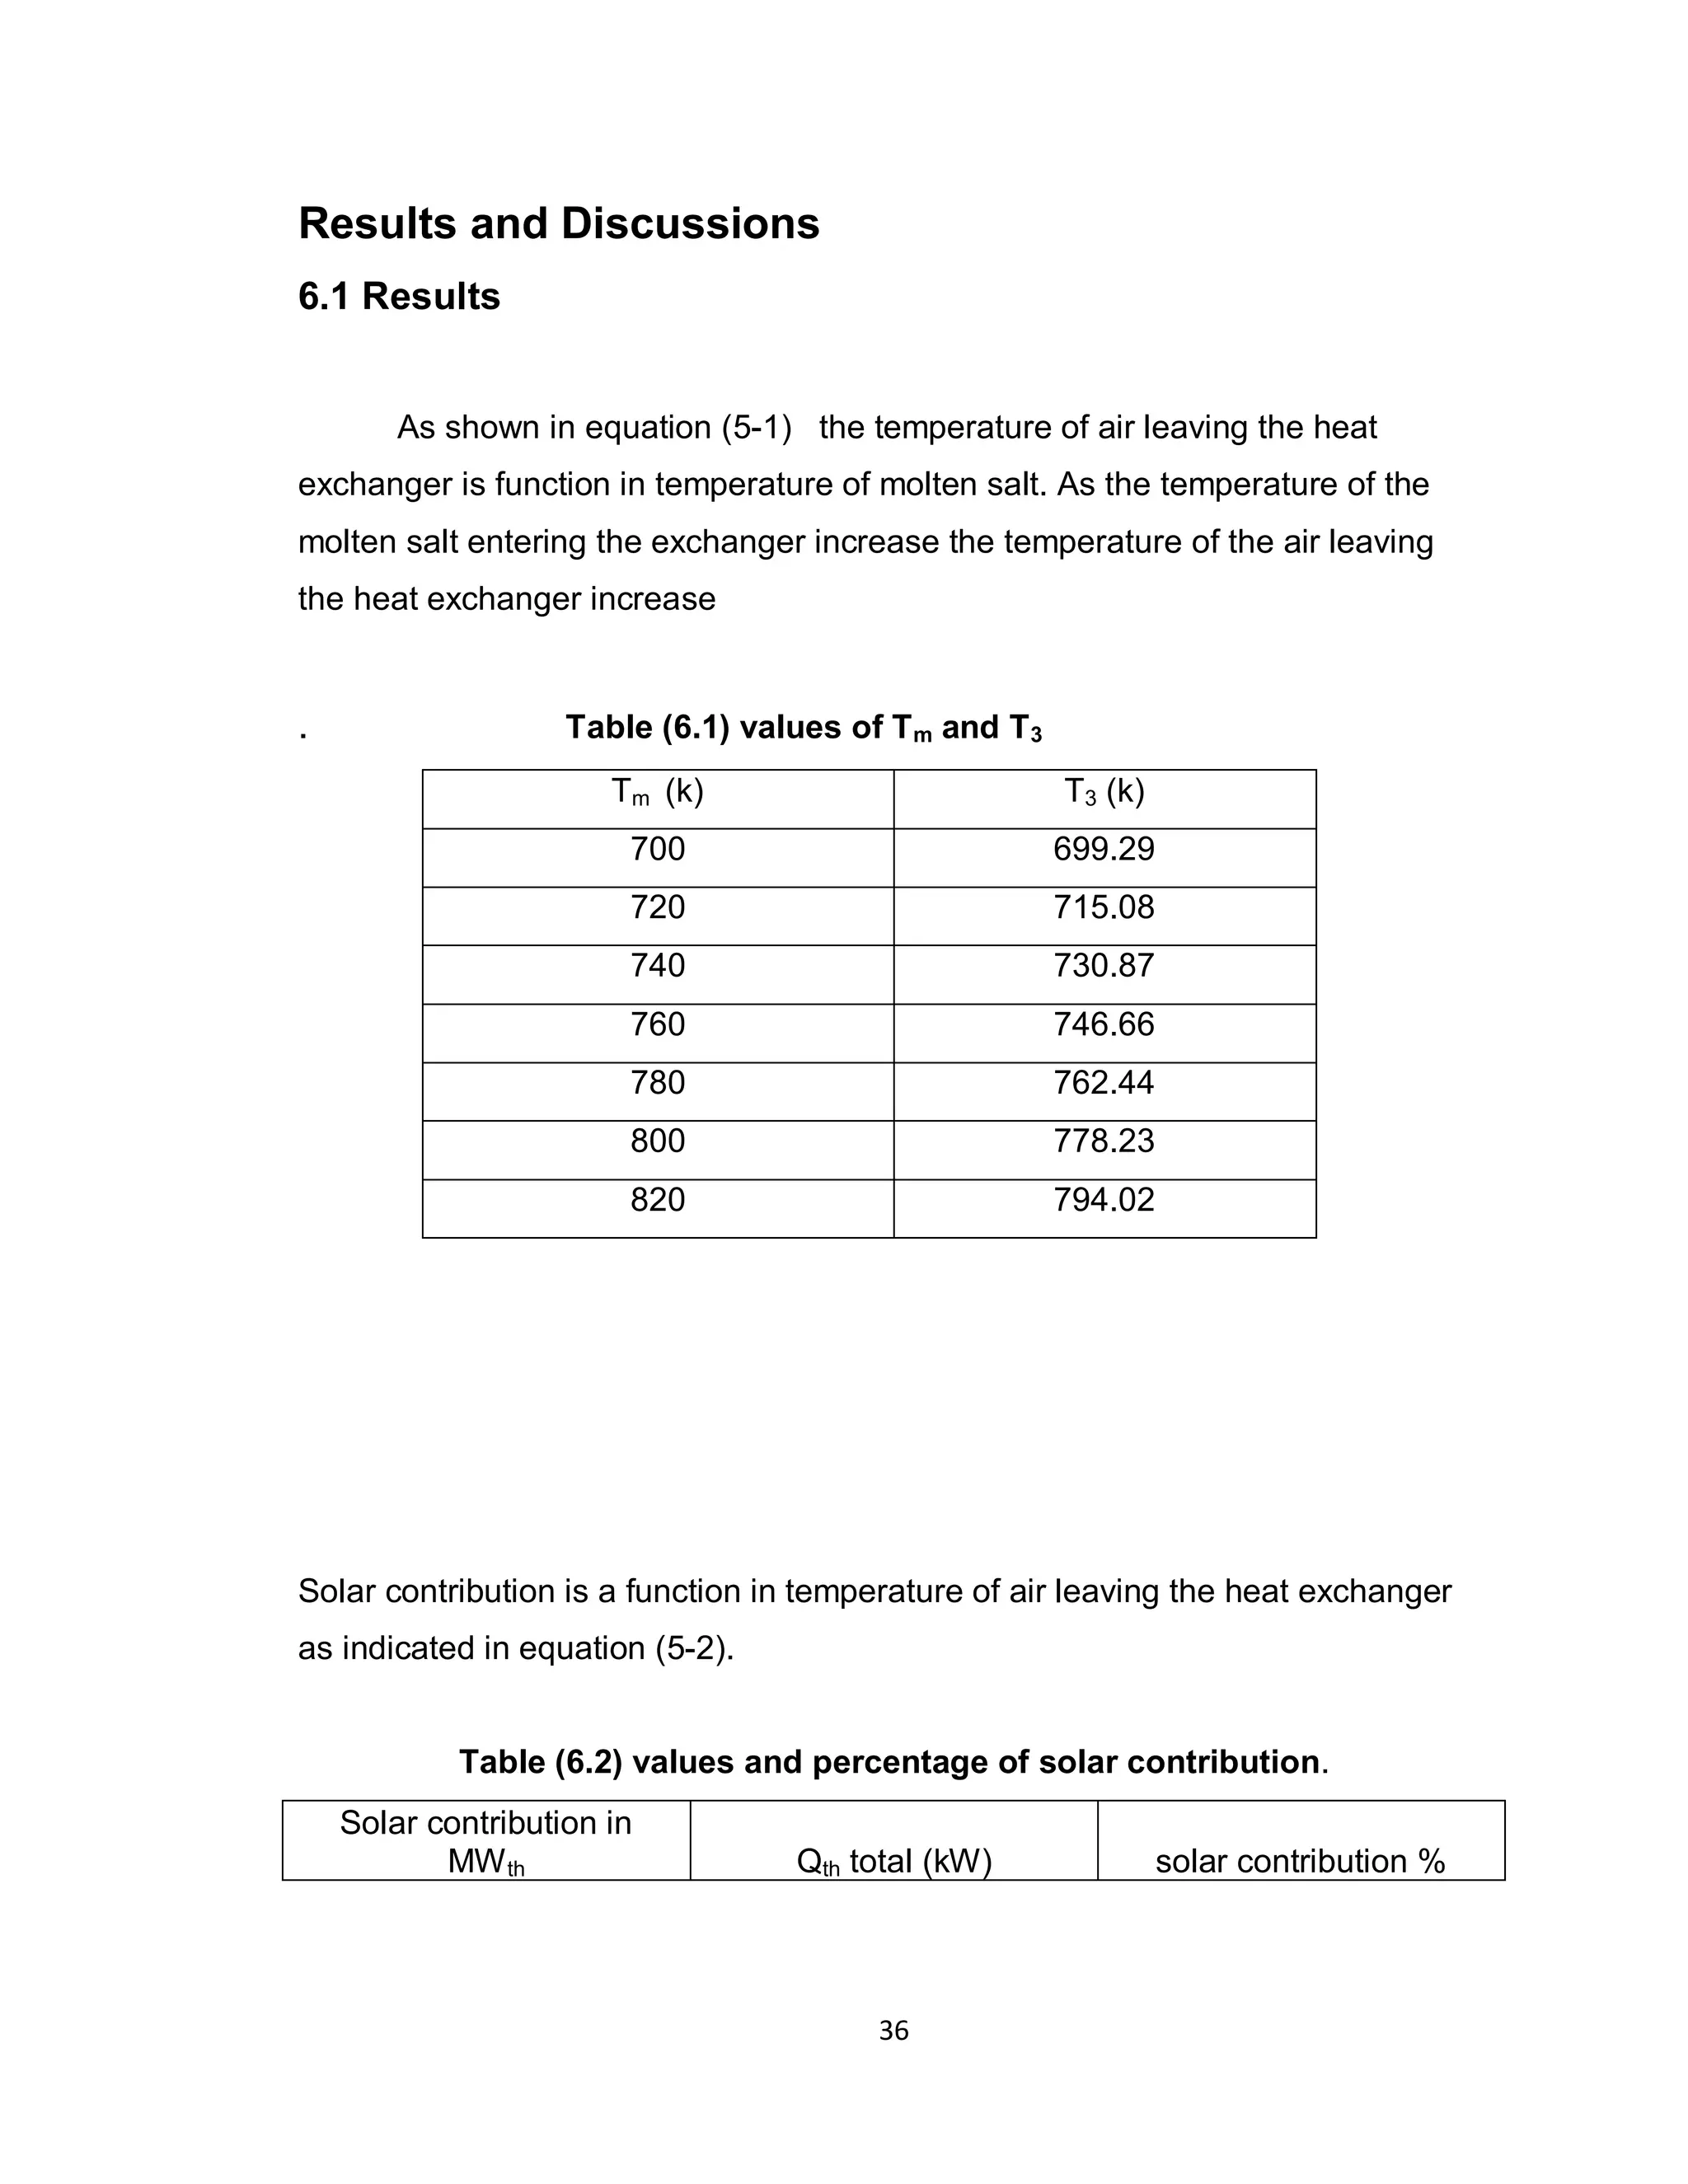
![30
T3 : temperature of air leaving the heat exchanger
The new amount of fuel consumption due to using solar energy is function
in the outlet temperature from heat exchanger T3 , as it increase the amount of
fuel consumption decrease.
Substituting the value of QLHV ,Cp air , Cp gas , m.
air and Tout the equation be :
= ……………………………….(4-9)
The amount of fuel saving due to using solar energy =
Total amount of fuel consumption at full fossil – amount of fuel consumption at
certain solar contribution
This expression could be written as below :
= - ……………………(4-10)
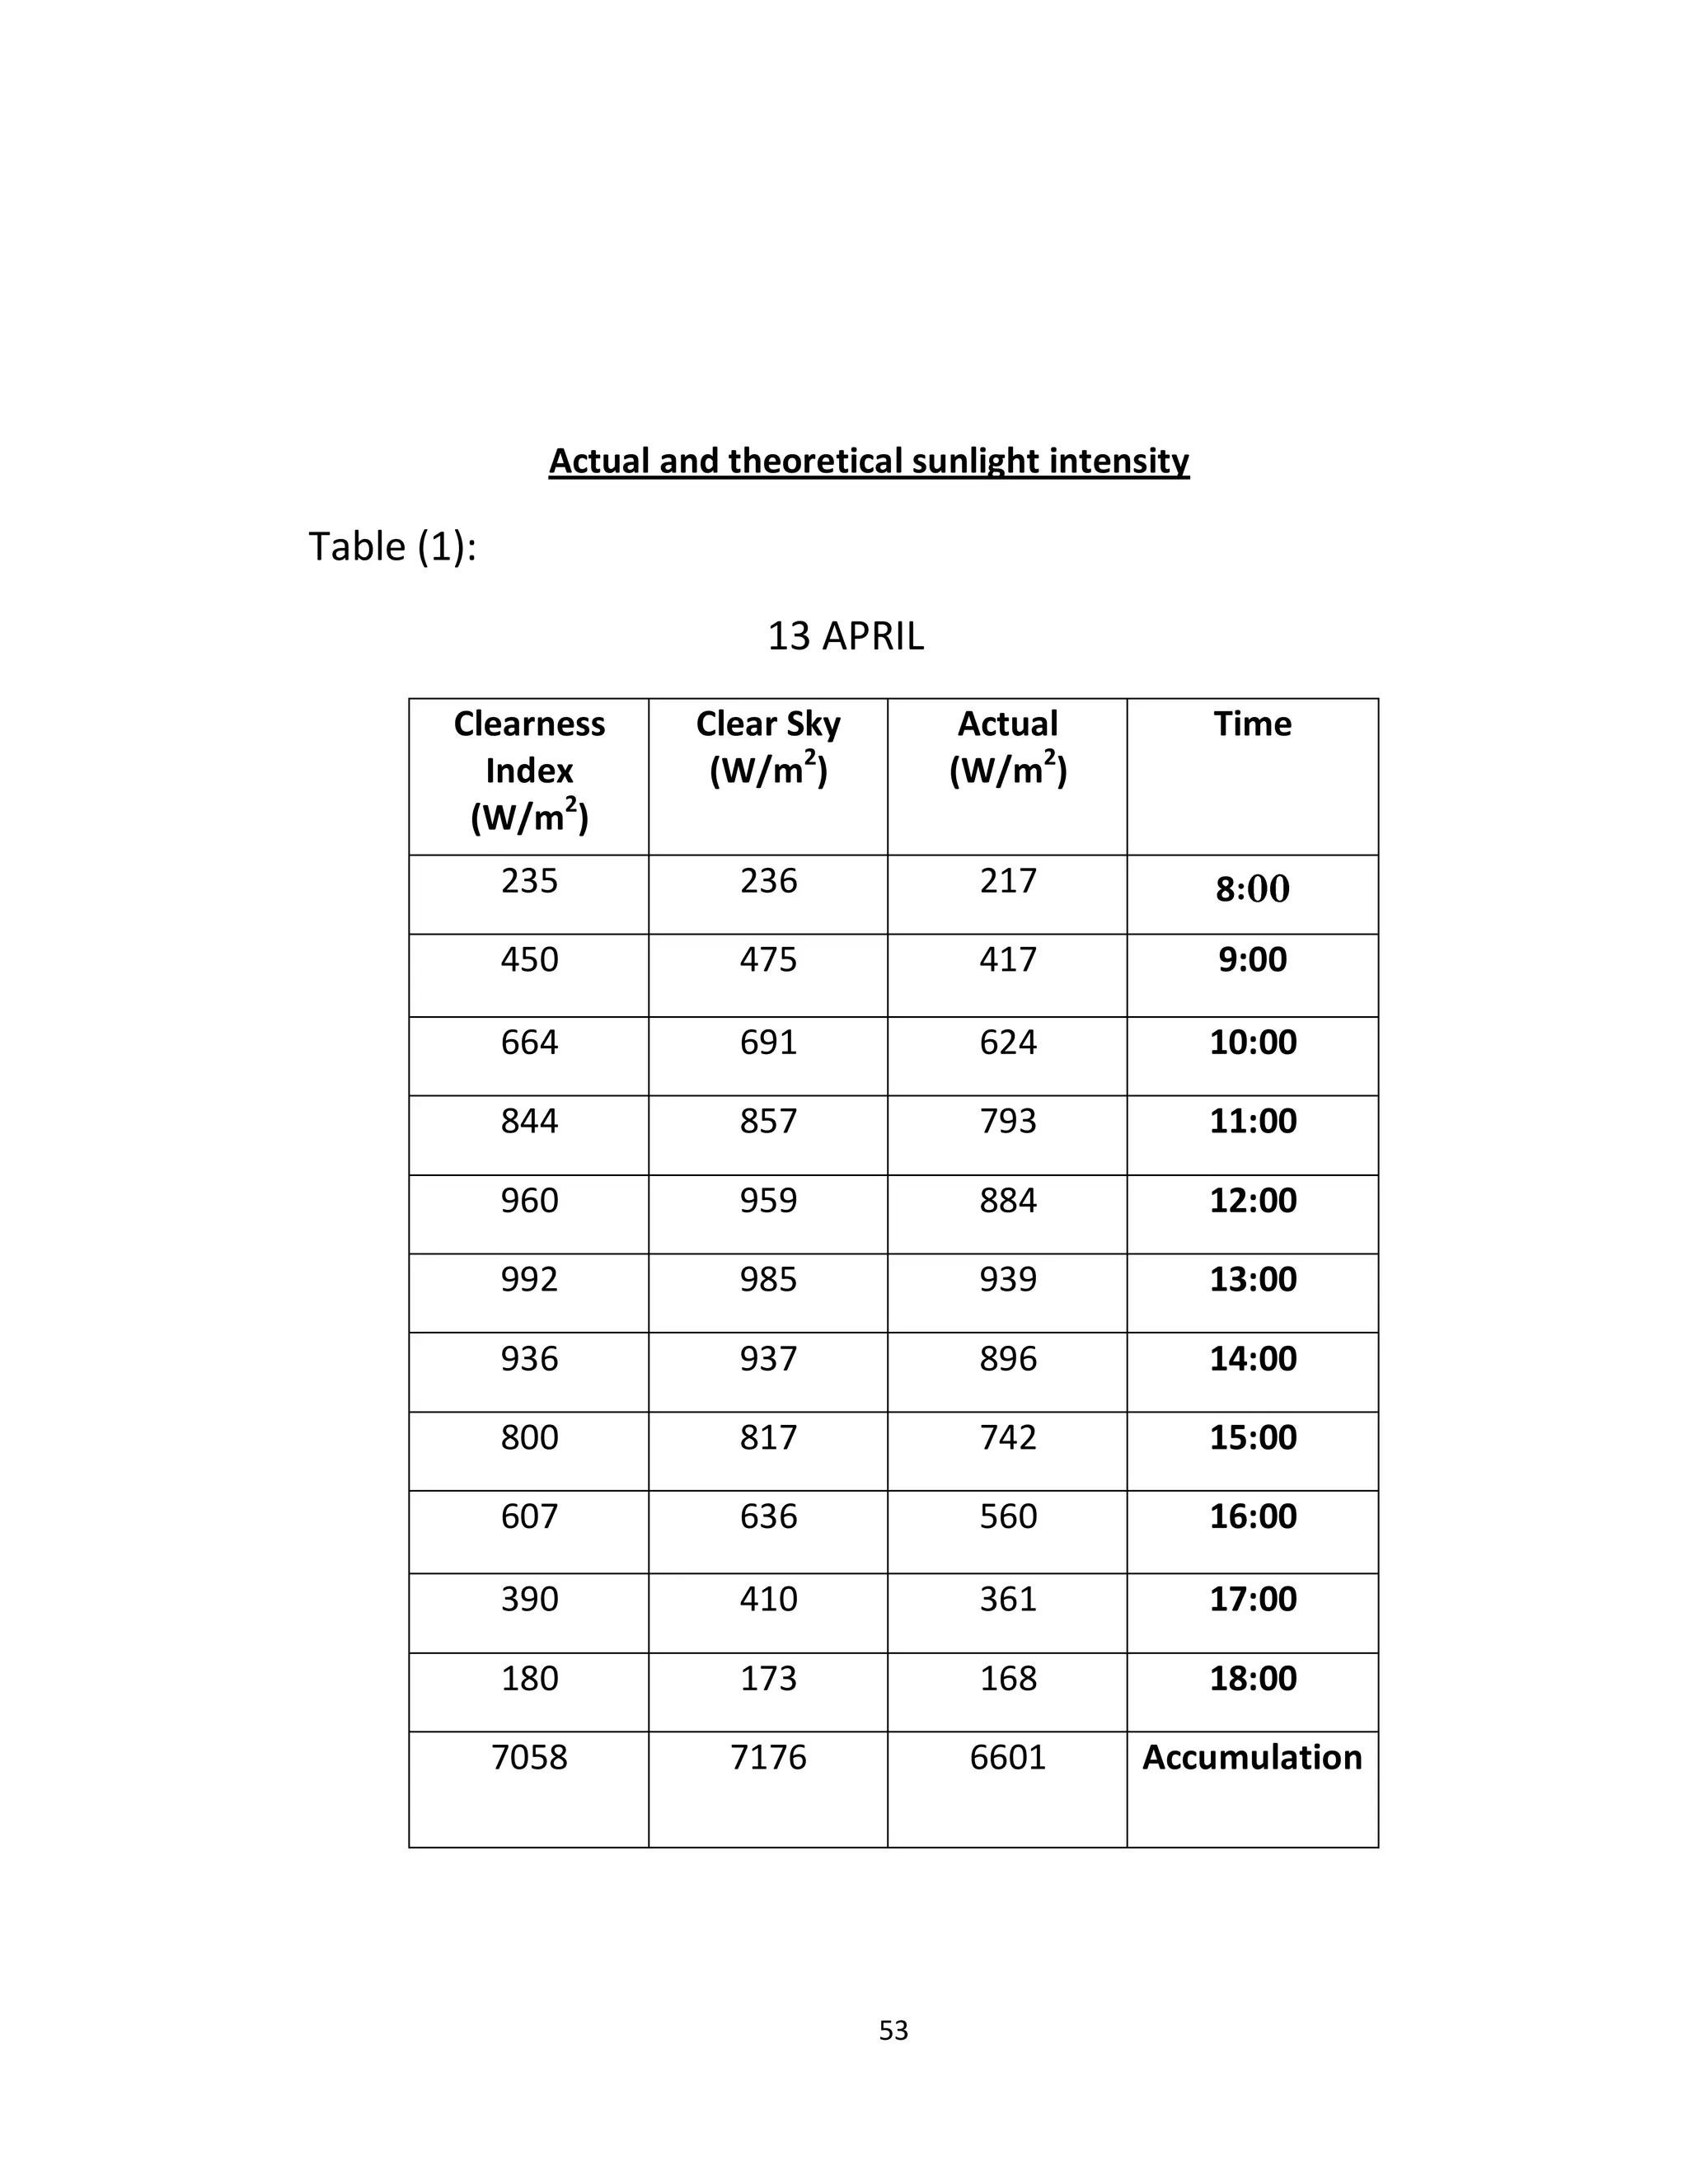
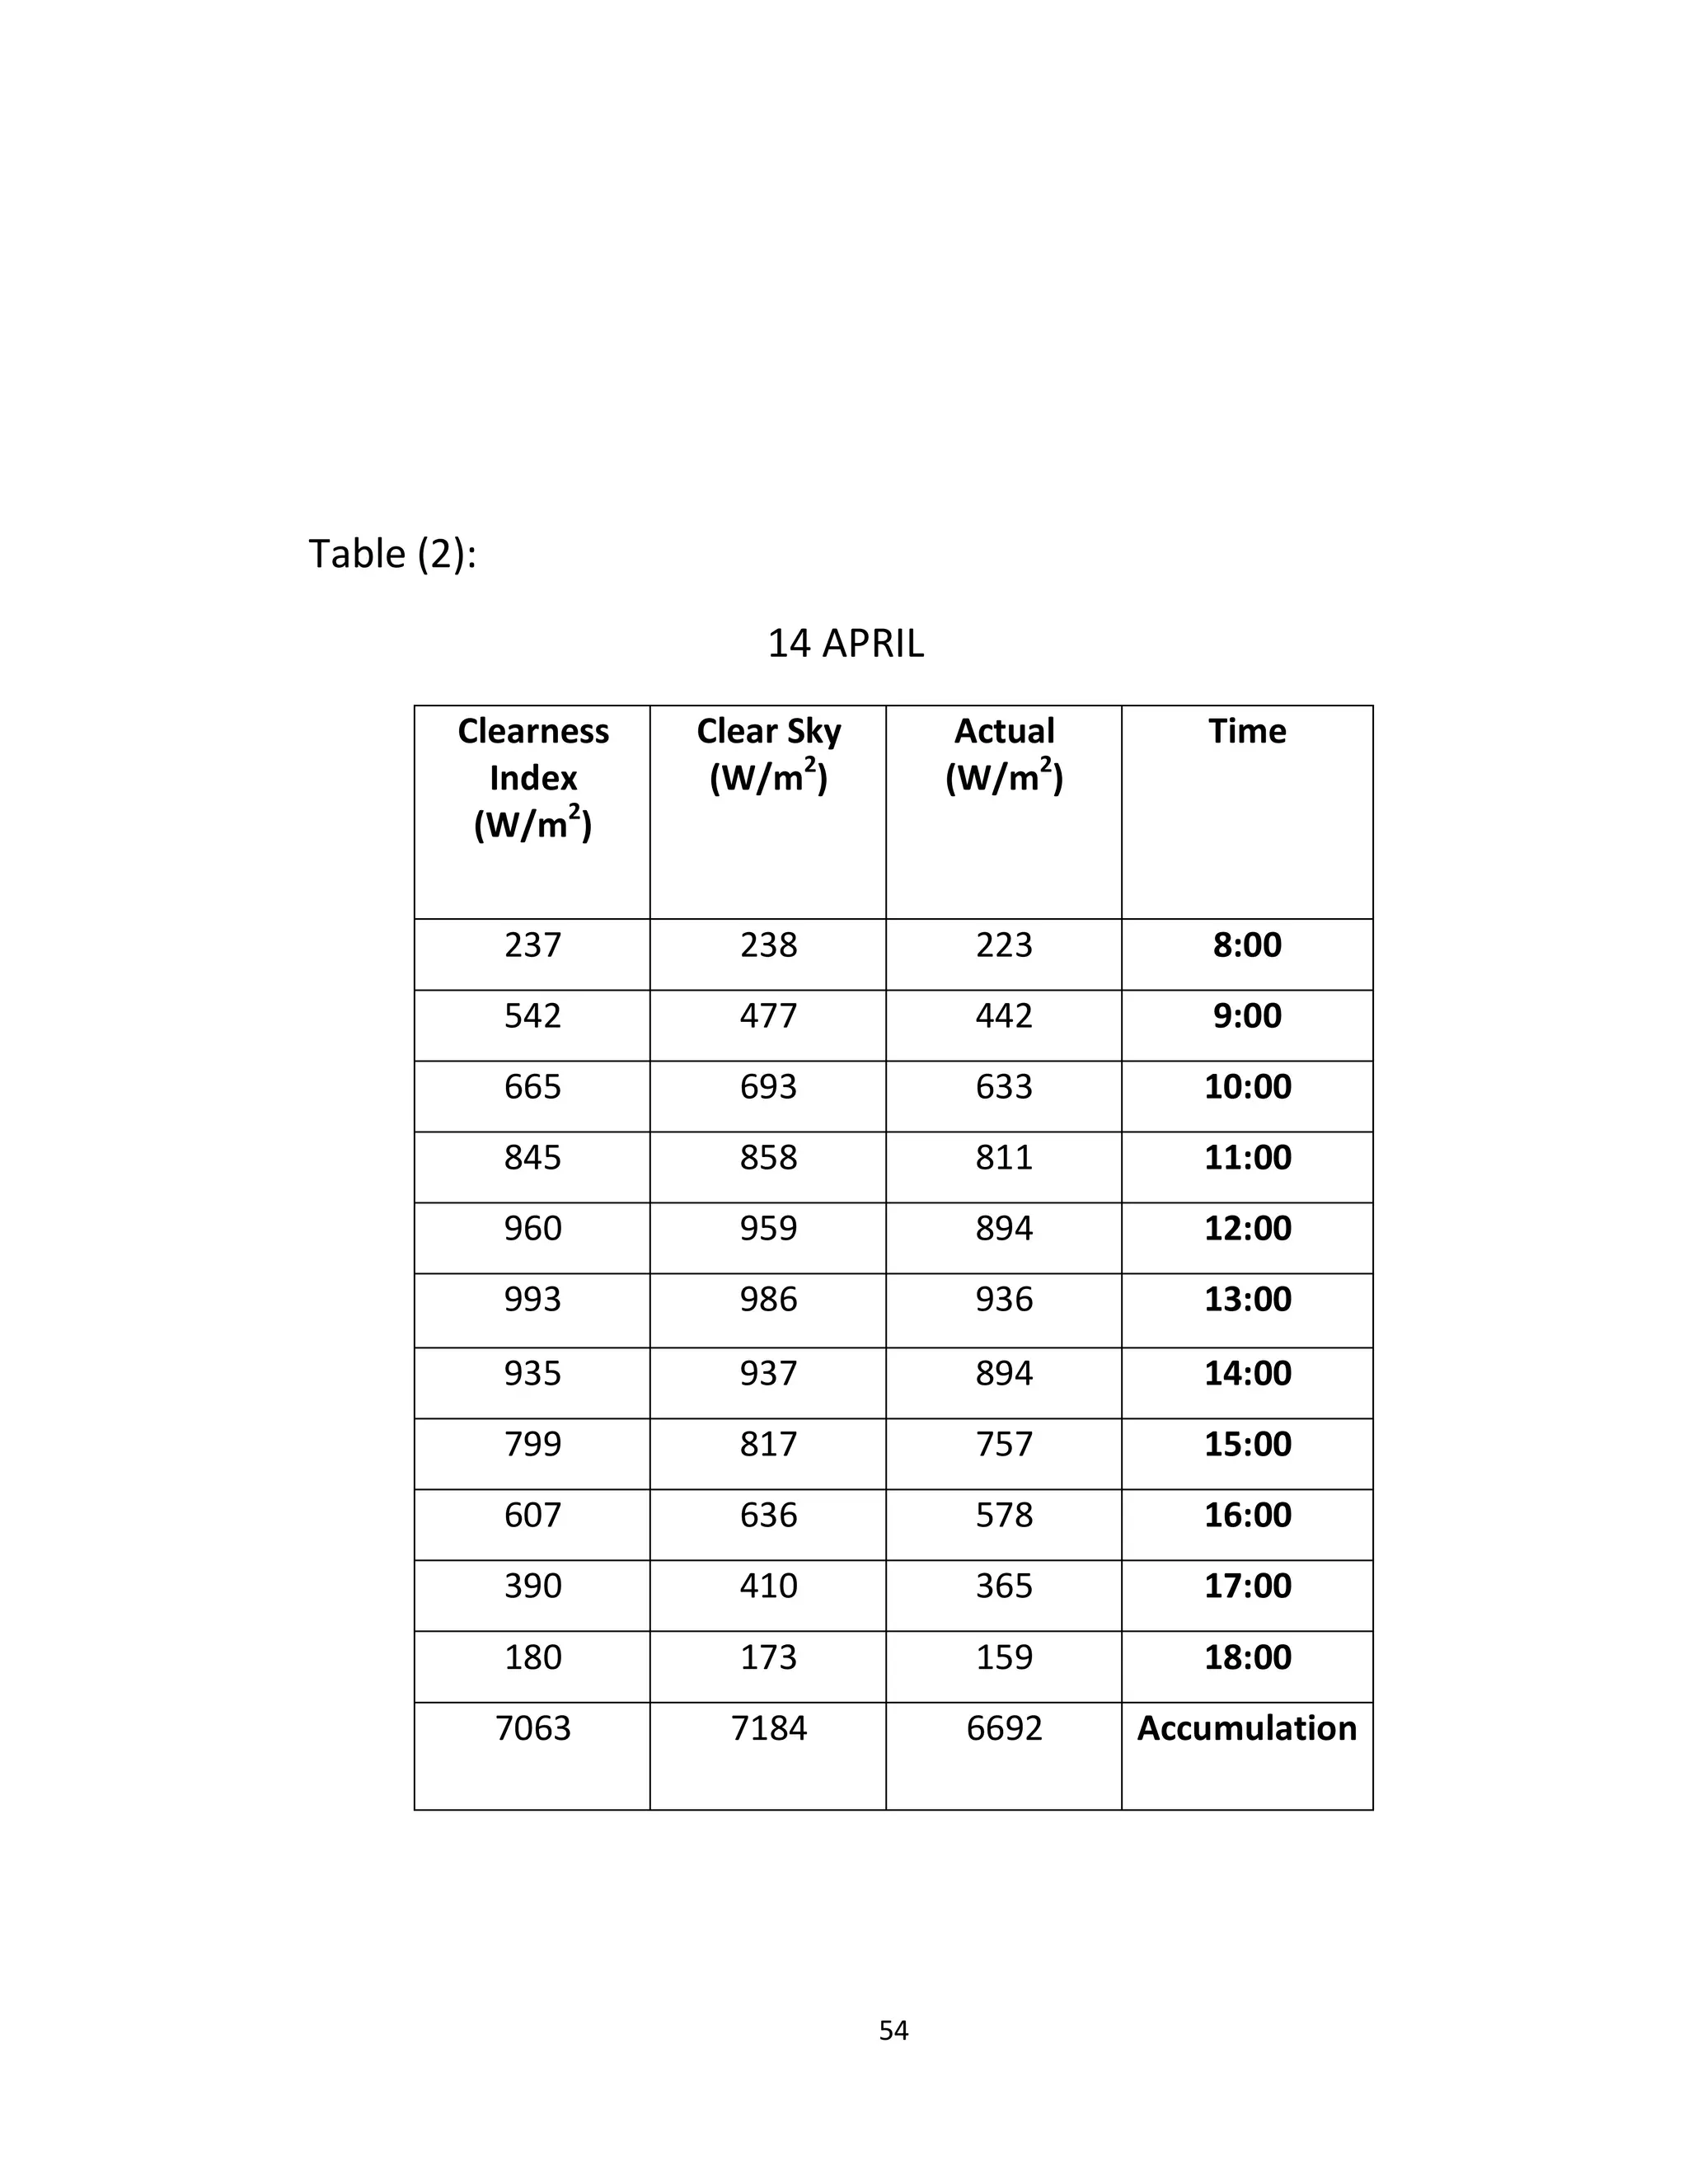
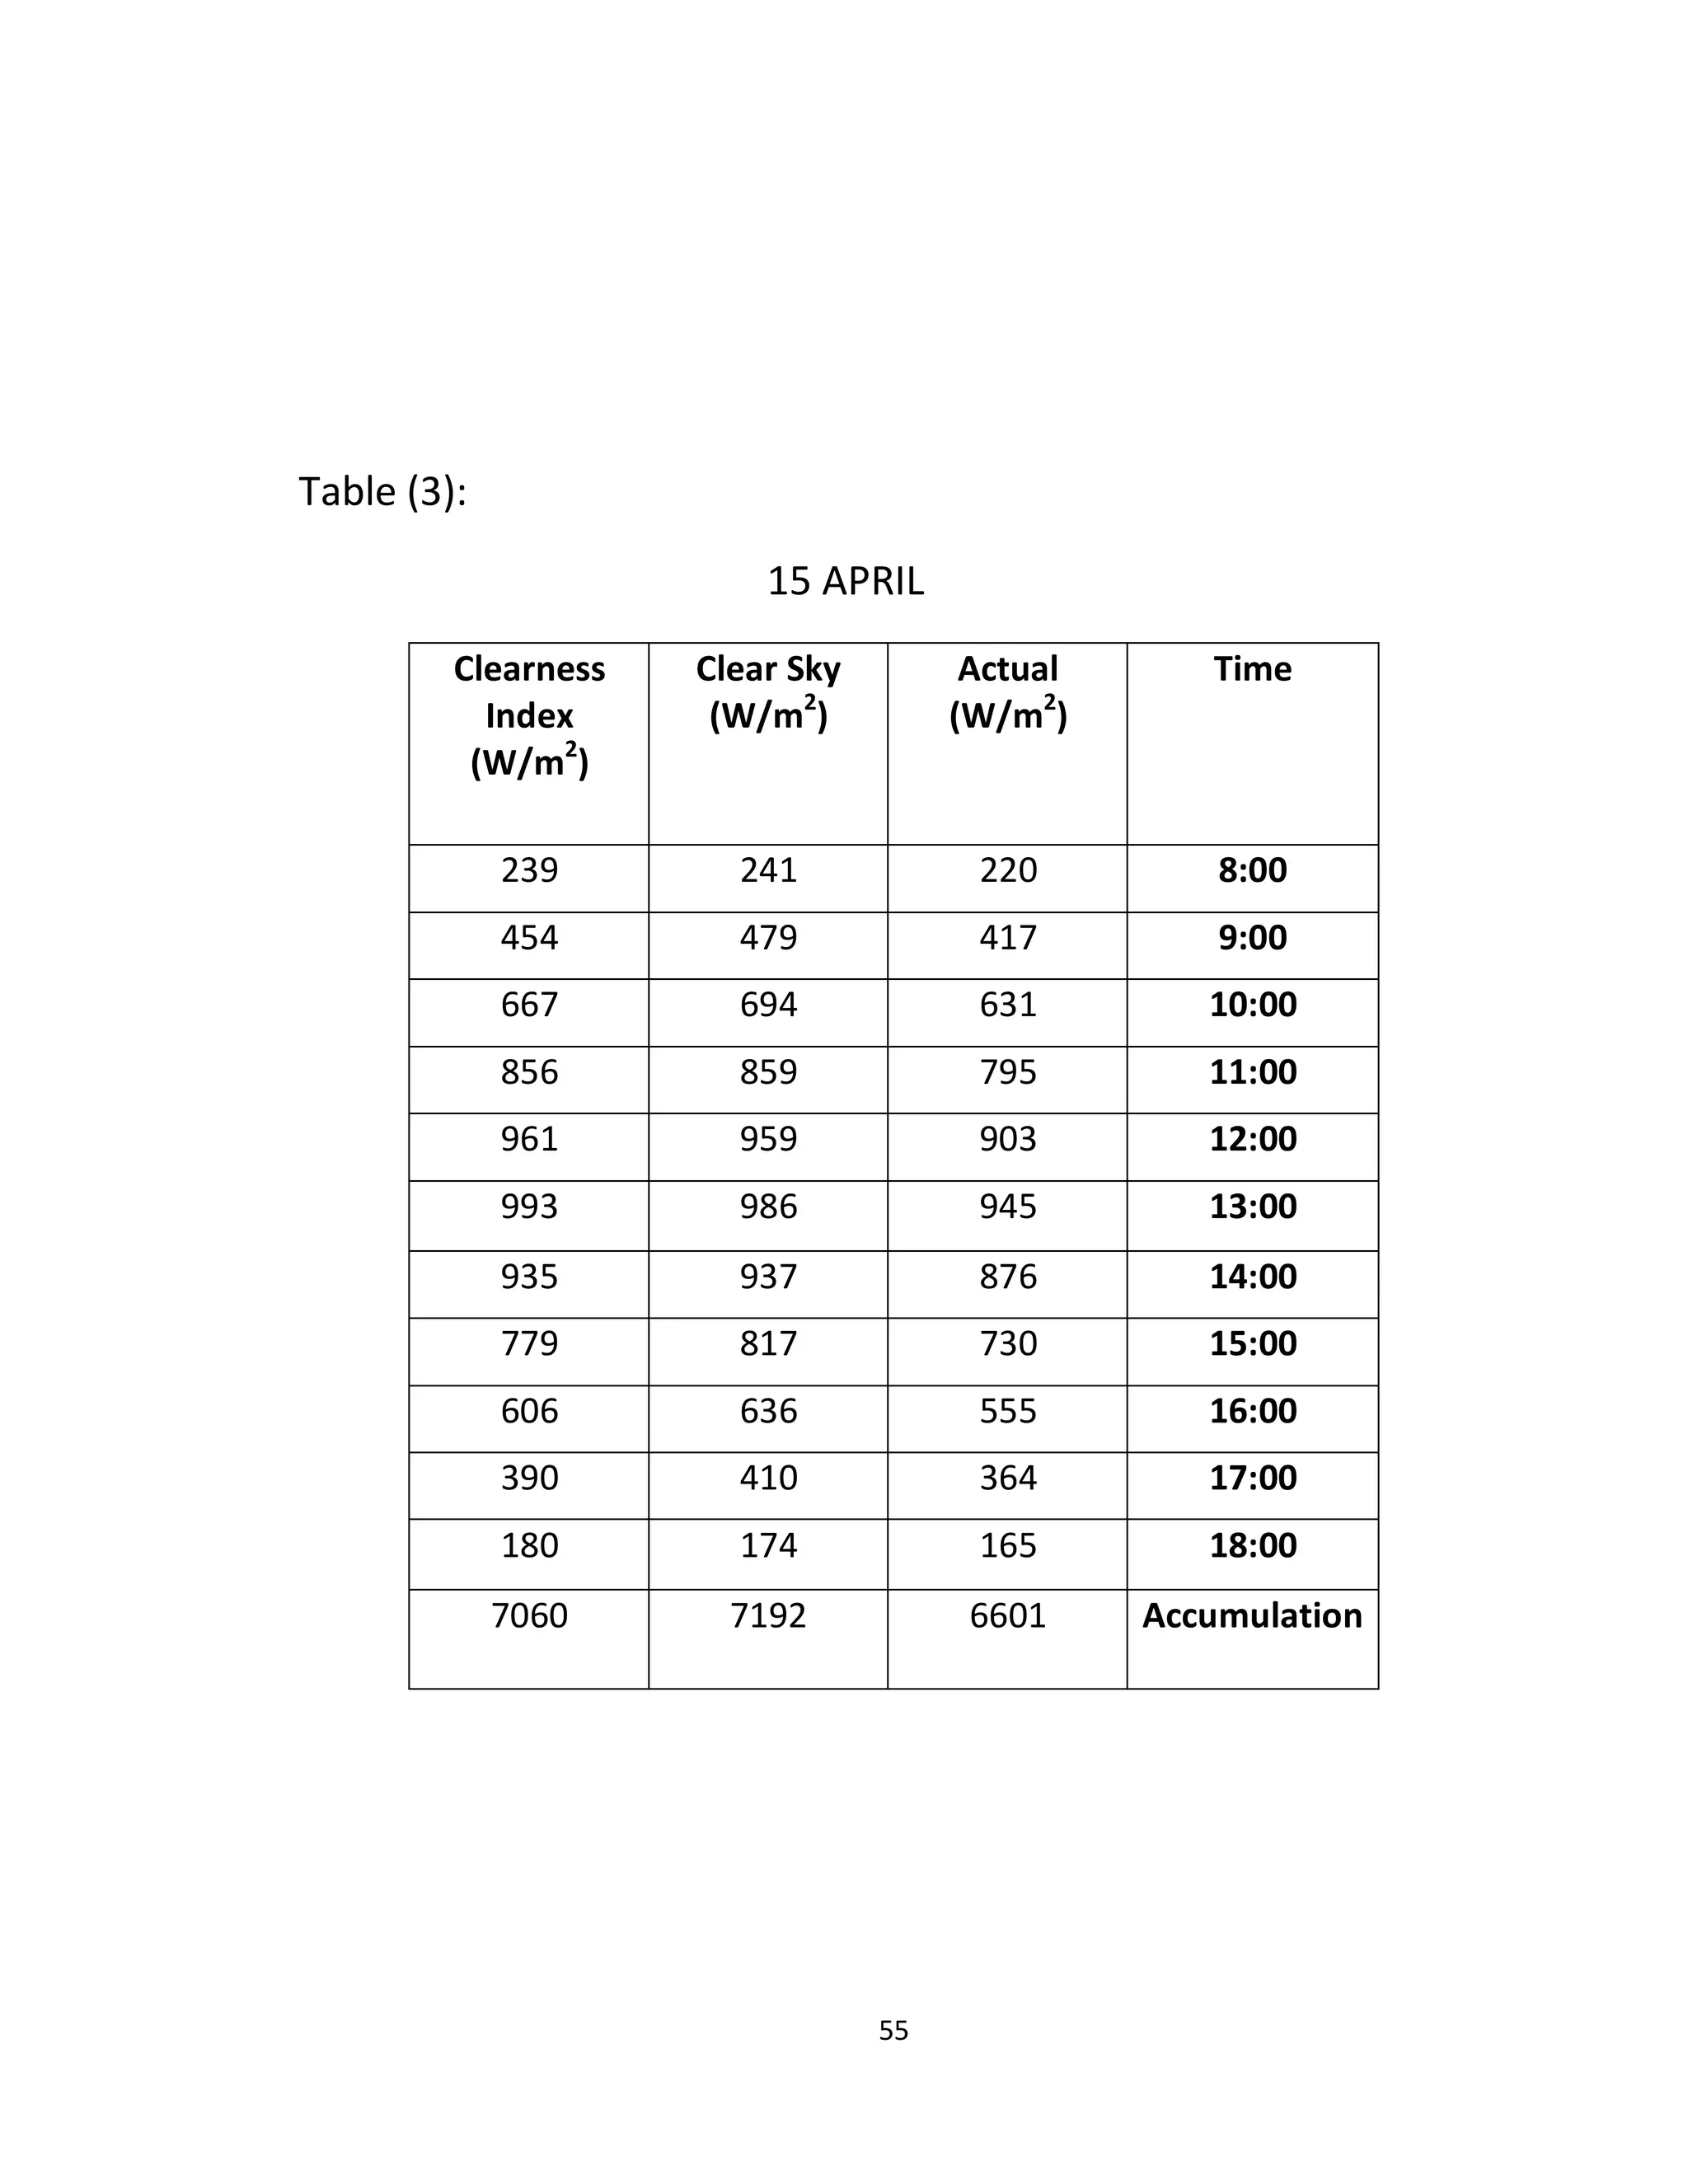
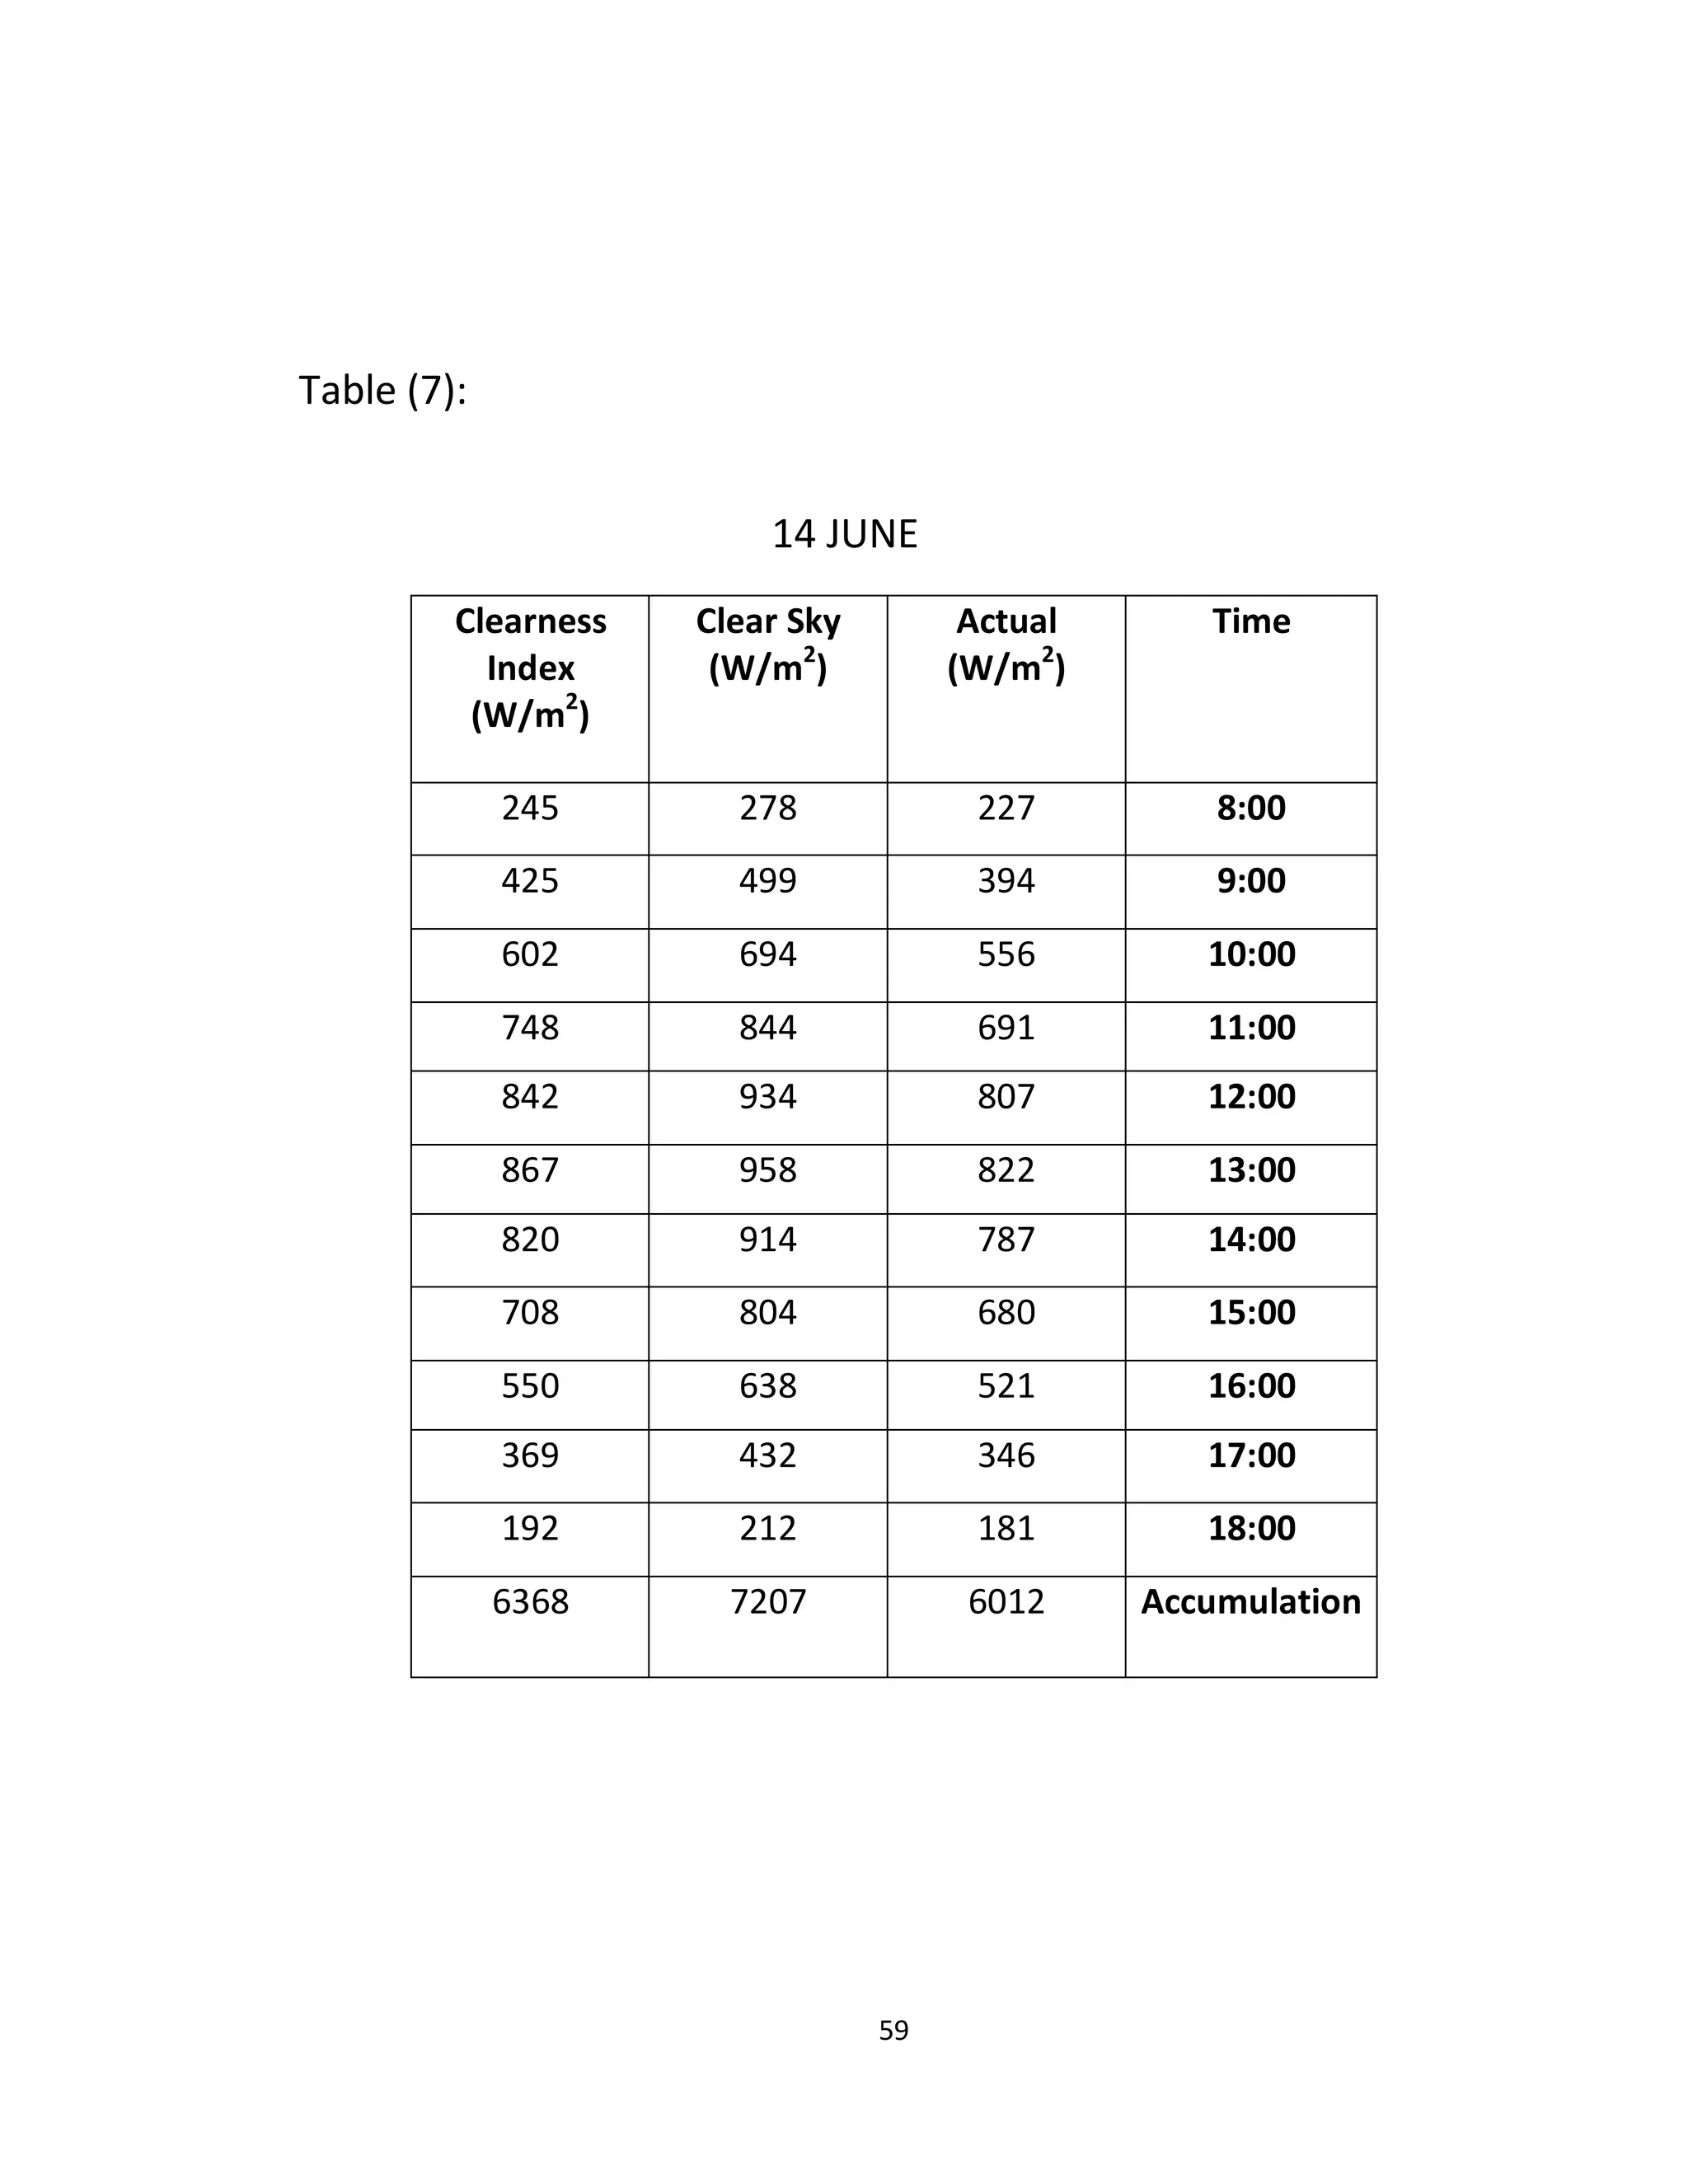
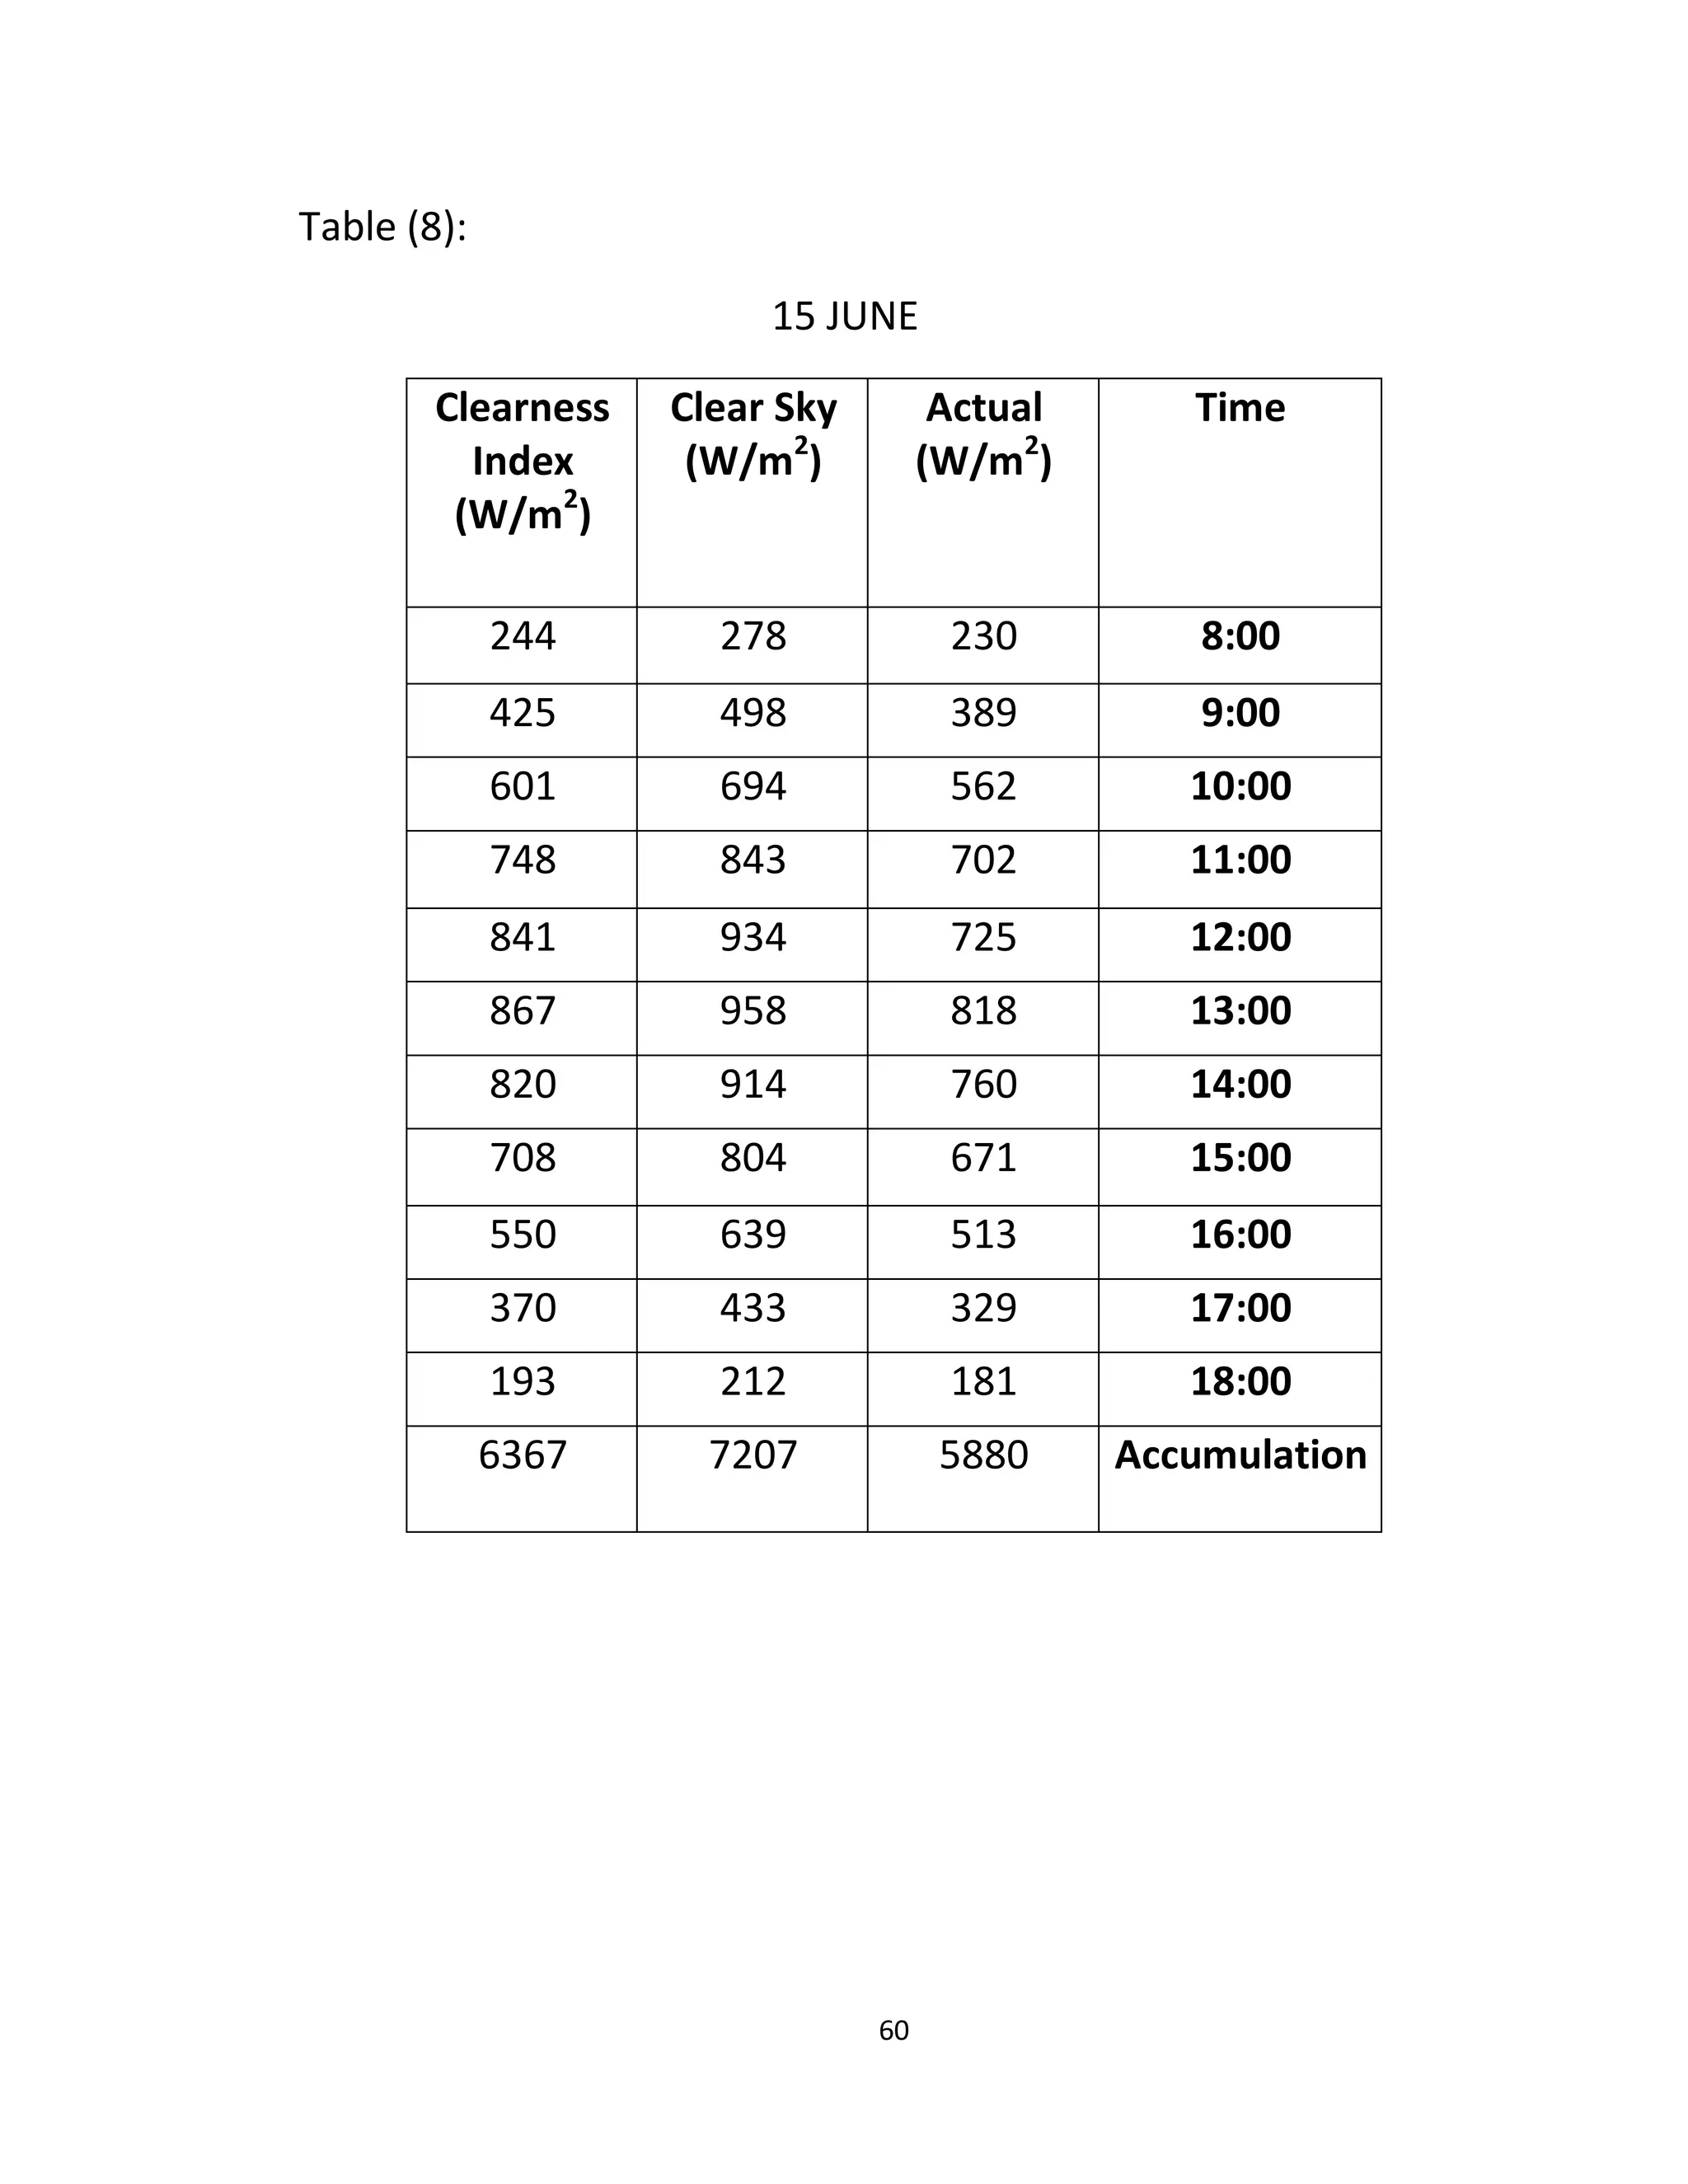
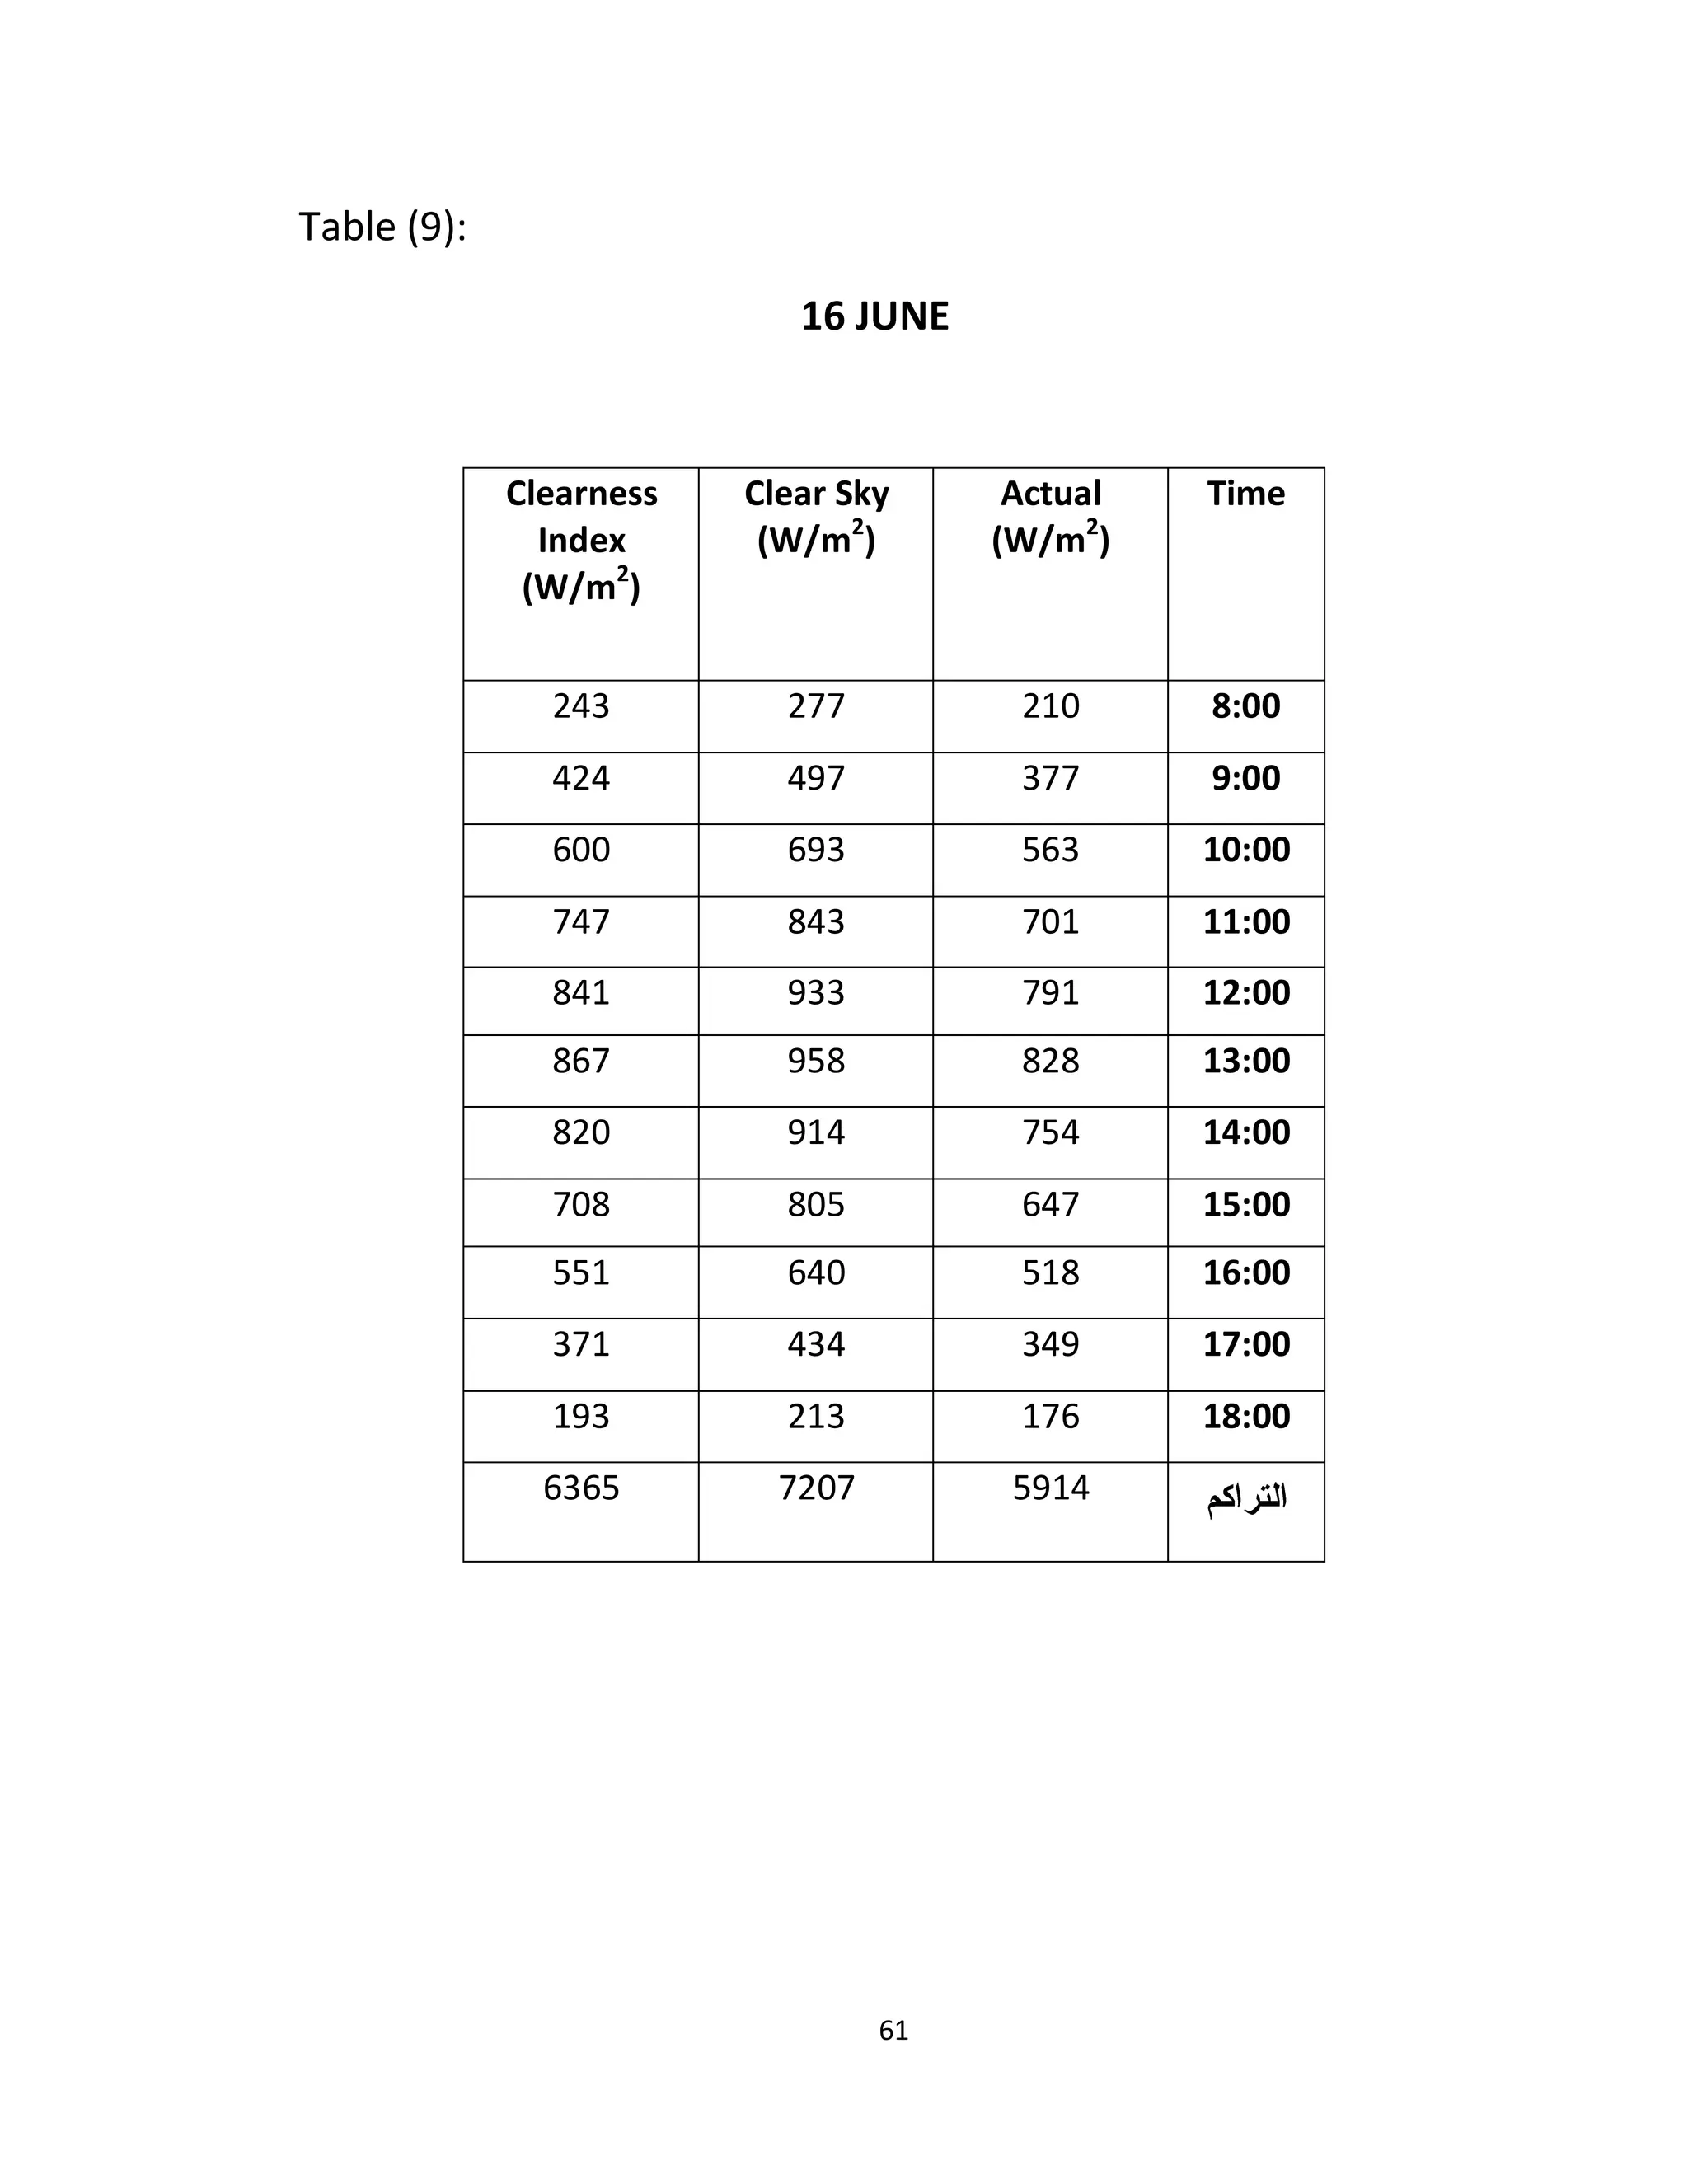
4.3.5 Calculations of solar field area:
Upon the values of solar intensity of radiation taken in Khartoum state during
summer months[6] ( April, May and June ) shown in appendix (1) the solar field
area required to generate certain value of thermal energy can be calculated from
the equation below :](https://image.slidesharecdn.com/9c3e6cc7-a938-4c33-8ada-7c9ef73985ee-150322161150-conversion-gate01/75/CSP-Project-30-2048.jpg)


This document discusses using concentrating solar power (CSP) technology to preheat air for the Garri combined cycle power plant in Sudan to reduce its high operating costs. It examines central receiver, parabolic trough, and dish CSP systems. A hybrid option is proposed that introduces solar thermal energy to contribute a certain percentage to the total power generated, reducing fuel costs and risks of fully converting the plant to solar. A feasibility study will analyze the economics of the hybrid plant compared to the fully fossil-fueled plant.


