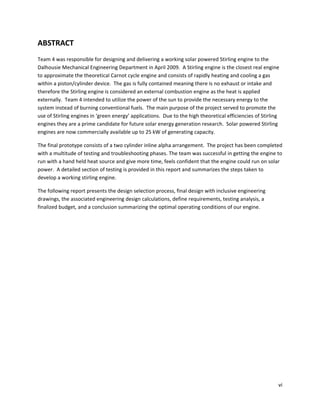
TEAM 04 
     SOLAR AND WASTE HEAT POWERED STIRLING ENGINE  


    FINAL REPORT 
    “The Little Engine that Could… and Did!” 

    The goal of team 04 was to design and build a working Stirling engine suitable 
    for classroom demonstration. As an added challenge the group is planning to 
    have the engine run entirely from solar energy as well as other heat sources. 

    Andrew McMurray 
    B00406524 
     
    Alex Morash 
    B00410812 
     
    Bryan Neary 
    B00401625 
     
    Kristian Richards                             Submission Date:      April 9th  
    B00411178                                     Submitted To:         Dr. Militzer 
                                                                        Dr. Groulx 


TABLE OF CONTENTS 
LIST OF ILLUSTRATIONS  ............................................................................................................................... iv 
                     .
LIST OF TABLES .............................................................................................................................................. v 
ABSTRACT ..................................................................................................................................................... vi 
1.      INTRODUCTION ..................................................................................................................................... 1 
2.      BACKGROUND ....................................................................................................................................... 2 
      2.1.     Ideal Stirling Engine Cycle ............................................................................................................. 2 
      2.2.     Real Stirling Engine Cycle .............................................................................................................. 3 
3.      DESIGN REQUIREMENTS ....................................................................................................................... 6 
4.      DESIGN SELECTION  ............................................................................................................................... 7 
                        .
      4.1.     Rotary Stirling Engine .................................................................................................................... 8 
      4.2.     Gamma Stirling Engine .................................................................................................................. 8 
      4.3.     Alpha Stirling Engine ‐ 90° Arrangement ...................................................................................... 9 
5.      COMPONENT DESIGN, FABRICATION AND BUILD PROCESS ............................................................... 10 
      5.1.     Frame .......................................................................................................................................... 10 
      5.2.     Cylinders and Cylinder Heads ..................................................................................................... 11 
      5.3.     Pistons ......................................................................................................................................... 12 
      5.4.     Cranks  ......................................................................................................................................... 12 
                     .
      5.5.     Flywheel and Collars ................................................................................................................... 13 
      5.6.     Piston Rods and Brass Connection Fittings ................................................................................. 14 
      5.7.     Fresnel Spot Lens ........................................................................................................................ 14 
6.      DESIGN ANALYSIS AND REVISED CALCULATIONS ............................................................................... 16 
      6.1.     Schmidt Analysis of Ideal Isothermal Model  .............................................................................. 16 
                                                         .
      6.2.     Fin Heat Transfer ......................................................................................................................... 18 
7.      INITIAL TESTING .................................................................................................................................. 19 
      7.1.     Testing Observations................................................................................................................... 19 
      7.2.     Design Solutions .......................................................................................................................... 20 
8.      DESIGN REFINEMENTS & PERFORMANCE IMPROVEMENTS .............................................................. 21 
      8.1.     Design Refinements .................................................................................................................... 21 
        8.1.1.        Frame Heat Dissipation ....................................................................................................... 21 
        8.1.2.        Compression Reduction ...................................................................................................... 22 
        8.1.3.        Transfer Tube ...................................................................................................................... 23 
      8.2.     PERFORMANCE IMPROVEMENTS ............................................................................................... 24 

                                                                                                                                                                 ii 
 
8.2.1.        Internal Fins ........................................................................................................................ 24 
        8.2.2.        Regenerator ........................................................................................................................ 25 
9.      Testing and Troubleshooting .............................................................................................................. 27 
      9.1.     Fresnel Lens Testing .................................................................................................................... 27 
        9.1.1.        Test #1 ‐ General Testing Results ‐ January 23rd (2 pm) ...................................................... 27 
        9.1.2.        Test #2‐ Temperature Measurements ‐ April 1st (12:40 to 1:10 pm)  ................................. 28 
                                                                                      .
        9.1.3.        Test #3 ‐ Solar Energy Input to Gamma ‘Windmill’ Stirling Engine ‐ April 1st ..................... 30 
      9.2.     Iterative Testing and Troubleshooting Procedure ...................................................................... 30 
      9.3.     Temperature Data Acquisition .................................................................................................... 33 
        9.3.1.        Thermocouples ................................................................................................................... 33 
        9.3.2.        Benchtop Digital Display ..................................................................................................... 34 
        9.3.3.        Thermocouple arrangement ............................................................................................... 35 
      9.4.     Stirling Engine Optimization........................................................................................................ 35 
        9.4.1.        Test #1 ‐ March 30th, 2009 .................................................................................................. 36 
        9.4.2.        Test #2 ‐ April 1st, 2009 ....................................................................................................... 37 
        9.4.3.        Test #3 ‐ Run A ‐ April 4th, 2009 .......................................................................................... 39 
        9.4.4.        Test #3 ‐ Run B ‐ April 4th, 2009 ........................................................................................... 42 
        9.4.5.        Test #3 ‐ Run C ‐ April 4th, 2009 ........................................................................................... 43 
      9.5.     Repeatability and Comparison to Theory ................................................................................... 44 
10.  BUDGET ............................................................................................................................................... 45 
11.  CONCLUSION ....................................................................................................................................... 46 
      11.1.       Design Requirements Fulfillment ............................................................................................ 46 
      11.2.       Optimal System Operating Condition ..................................................................................... 47 
12.  REFERENCES ........................................................................................................................................ 48 
 
APPENDIX A – Gantt Chart 
APPENDIX B – Ideal Isothermal Analysis 
APPENDIX C – Heat Transfer Calculations 
APPENDIX D – Engineering Drawings 


                                                                                                                                                            iii 
 
 LIST OF ILLUSTRATIONS 
Figure 1 ‐ Solar Energy Project Proposal of Solar Array sited in California Mojave Desert using 
SunCatcherTM Technologies from SES Stirling Energy Systems ..................................................................... 1 
Figure 2 ‐ Ideal Stirling Cycle P‐v and T‐s Diagrams ...................................................................................... 2 
Figure 3 ‐ Real Stirling Cycle P‐v Diagram Approximation ............................................................................ 4 
Figure 4 ‐ Rotary Stirling Engine .................................................................................................................... 8 
Figure 5 ‐ Gamma Stirling Engine .................................................................................................................. 9 
Figure 6 ‐ Alpha Stirling Engine – 90° Arrangement ..................................................................................... 9 
Figure 7 ‐ Final Concept to Build Comparison ............................................................................................. 10 
Figure 8 ‐ Assembled Frame and New Bearing Seat ................................................................................... 11 
Figure 9 ‐ Hot and Cold Cylinders and Cylinder Heads ............................................................................... 12 
Figure 10 ‐ Piston Manufacturing and Final Product .................................................................................. 12 
Figure 11 ‐ Crank Design Showing Force Couple and Stroke Length .......................................................... 13 
Figure 12 ‐ Stirling Cycle Flywheel Dependance ......................................................................................... 14 
Figure 13 ‐ Brass Fittings and Connecting Rods .......................................................................................... 14 
Figure 14 ‐ Fresnel Lens and Frame ............................................................................................................ 15 
Figure 15 ‐ Simplified Isothermal Alpha Stirling Engine .............................................................................. 16 
Figure 16 ‐ Sinusoidal Volume Dependence on Crank Angle ...................................................................... 17 
Figure 17 ‐ Heat Transfer and Fin Efficiency ............................................................................................... 18 
Figure 18 ‐ Initial Testing Setup .................................................................................................................. 19 
Figure 19 ‐ Heat Damage to Temporary Transfer Tube .............................................................................. 20 
Figure 20 ‐ Hot Cylinder Insulation ............................................................................................................. 21 
Figure 21 ‐ Thermal Image .......................................................................................................................... 22 
Figure 22 ‐ Stroke Length Reduction  .......................................................................................................... 23 
                                         .
Figure 23 ‐ Heat Damaged Transfer Tube ................................................................................................... 23 
Figure 24 ‐ Steel Transfer Tube ................................................................................................................... 24 
Figure 25 ‐ Internal Fins Fabrication Process .............................................................................................. 25 
Figure 26 ‐ Internal Fin Placement .............................................................................................................. 25 
Figure 27 ‐ Regenerator Components  ........................................................................................................ 26 
                                           .
Figure 28 ‐ Installed Regenerator with Ice Water Bath .............................................................................. 26 
Figure 29 ‐ Fresnel Lens and Infrared Thermometer Readings .................................................................. 27 
Figure 30 ‐ Various Objects Held under the Fresnel Lens ........................................................................... 28 
Figure 32 ‐ Temperature Increase of Steel Stock vs. Time  ......................................................................... 29 
                                                                          .
Figure 31 ‐ Cylindrical Steel Object ............................................................................................................. 29 
Figure 33 ‐ Gamma 'Windmill' Stirling Engine ............................................................................................ 30 
Figure 34 ‐ Surface Thermocouple .............................................................................................................. 33 
Figure 35 ‐ Probe Thermocouple Setup ...................................................................................................... 34 
Figure 36 ‐ Omega MDSSi8 Digital Thermometer ....................................................................................... 34 
Figure 37 ‐ Thermocouple Setup  ................................................................................................................ 35 
                                   .
Figure 38 ‐ Optimization Test #1 Setup ...................................................................................................... 36 
Figure 39 ‐ Optimization Test #2 Setup with Regenerator ......................................................................... 37 

                                                                                                                                                     iv 
 
Figure 40 ‐ Optimization Test #2 Hot Cylinder Temperatures .................................................................... 38 
Figure 41 ‐ Optimization Test #2 Cold Cylinder Temperatures ................................................................... 38 
Figure 42 ‐ Optimization Test #2 Clamp and Regenerator Temperatures .................................................. 39 
Figure 43 ‐ Optimization Test #3 ‐ Run A ‐ Hot Cylinder Temperatures ..................................................... 40 
Figure 44 ‐ Optimization Test #3 ‐ Run A ‐ Cold Cylinder Temperatures .................................................... 40 
Figure 45 ‐ Optimization Test #3 ‐ Run A ‐ Clamp and Regen Temperatures ............................................. 41 
Figure 46 ‐ Optimization Test #3 ‐ Run A ‐ RPM and Power ....................................................................... 42 
Figure 47 ‐ Optimization Test #3 ‐ Run B ‐ RPM and Power ....................................................................... 43 
Figure 48 ‐ Schmidt Analysis Results for December Design .......................................................................... 4 
Figure 49 ‐ Schmidt Analysis Results for January Revised Design ................................................................. 5 
Figure 50 ‐ Schmidt Analysis Results Using Actual Results from April Optimizations .................................. 5 
 

LIST OF TABLES 
Table 1 : Ideal Stirling Cycle Process Summary ............................................................................................. 3 
Table 2 : Design Requirements ..................................................................................................................... 6 
Table 3 : Design Selection Matrix  ................................................................................................................. 7 
                                    .
Table 4 : Results of Schmidt Analysis of Ideal Isothermal Model ............................................................... 17 
Table 5 : Troubleshooting Parameters ........................................................................................................ 31 
Table 6 : Successive Iterative Testing Process ............................................................................................ 32 
Table 7 : Optimization Test#1 Results  ........................................................................................................ 36 
                                           .
Table 8 : Theory and Testing Results .......................................................................................................... 44 
Table 9 : Team 04 Budget ........................................................................................................................... 45 
Table 10 : Design Requirement Status ........................................................................................................ 46 
Table 11 : Optimal Engine Conditions ......................................................................................................... 47 


                                                                                                                                                     v 
 
ABSTRACT 
Team 4 was responsible for designing and delivering a working solar powered Stirling engine to the 
Dalhousie Mechanical Engineering Department in April 2009.  A Stirling engine is the closest real engine 
to approximate the theoretical Carnot cycle engine and consists of rapidly heating and cooling a gas 
within a piston/cylinder device.  The gas is fully contained meaning there is no exhaust or intake and 
therefore the Stirling engine is considered an external combustion engine as the heat is applied 
externally.  Team 4 intended to utilize the power of the sun to provide the necessary energy to the 
system instead of burning conventional fuels.  The main purpose of the project served to promote the 
use of Stirling engines in ‘green energy’ applications.  Due to the high theoretical efficiencies of Stirling 
engines they are a prime candidate for future solar energy generation research.  Solar powered Stirling 
engines are now commercially available up to 25 kW of generating capacity. 

The final prototype consists of a two cylinder inline alpha arrangement.  The project has been completed 
with a multitude of testing and troubleshooting phases. The team was successful in getting the engine to 
run with a hand held heat source and give more time, feels confident that the engine could run on solar 
power.  A detailed section of testing is provided in this report and summarizes the steps taken to 
develop a working stirling engine. 

The following report presents the design selection process, final design with inclusive engineering 
drawings, the associated engineering design calculations, define requirements, testing analysis, a 
finalized budget, and a conclusion summarizing the optimal operating conditions of our engine. 


                                                                                                             vi 
 
1. INTR
      RODUCTI
            ION 
In the recent ‘green‐en
                      nergy’ movem   ment the Stirling cycle has received renewed interesst in the area of 
solar enerrgy generatio
                      on, and it is th            of team 04 to help raise aw
                                     he intention o                           wareness and promote 
renewable energies by y demonstrating the poten   ntial of the Sti
                                                                 irling engine.   

Stirling en
          ngines are kno own for havinng a high therrmodynamic efficiency.  Id  deally, a Stirlin
                                                                                                ng cycle enginne 
can be de esigned to app proximate thee theoretical Carnot cycle engine.  For e   example, Stirrling Energy 
Systems, Inc (SES), a co ompany based in California, USA specia   alizing in solar
                                                                                 r energy gene  eration equipment 
is currently recognized d for holding t
                                      the world reccord for solar‐‐to‐grid conve ersion efficienncy of 31.25% % 
                         TM
                         T                                                                 1
with theirr SunCatcher  solar powe   ered Stirling e
                                                   engine and mi  irrored dish c collector.   See Figure 1 forr a 
                                              TM
picture off a proposed a array of SunC
                                     Catcher  unit  ts.  SES has proposed to bu   uild 70,000 of these units in 
the Californian Mojave  e Desert and IImperial Valle
                                                   ey that will yield a combined generating     g capacity of 
1,750 MW  W of electricity.  Team 04 a
                                     accredits thesse SES project ts as well as oother projects s of similar 
aspirationns for inspiring the team too design and build a working Stirling en  ngine to fulfill the requirem ments 
of Dalhou usie Design Prroject 2008/009. 


    Figure 1 ‐ S
               Solar Energy Pro
                              oject Proposal o                ted in California Mojave Desert using SunCatch TM Technolog
                                             of Solar Array sit                                            her          gies 
                                      2
    from SES SStirling Energy Systems  


The reporrt will outline a background of the ideal Stirling cyclee, summarize the design seelection process, 
present th
         he final design and individual compone    ents, discuss t
                                                                 the calculations and technical engineering 
decisions made to refin ne the final design, presen              nements and testing proce
                                                   nt design refin                         edures.  The t
                                                                                                        team 
budget will also be preesented as we ell as a detaile
                                                    ed conclusionn outlining the
                                                                               e design requ
                                                                                           uirements 
establishe
         ed in first sem
                       mester.  The fiinal engineering drawings are attached  d in the Appen
                                                                                           ndix D. 
                                                            
1                                                                                                                               th
     Stirling Energy Systems, SES.  (2008a). New Wo
                                                  orld Record for Sola
                                                                     ar‐to‐Grid Convers
                                                                                      sion Efficiency.  Ac
                                                                                                         ccessed on Septem
                                                                                                                         mber 20 , 2008 fro
                                                                                                                                          om 
http://www.s
           stirlingenergy.com
                            m/downloads/12‐F
                                           February‐2008‐SES
                                                           S‐Stirling‐Energy‐and‐Sandia‐National‐Laboratories‐se
                                                                                                               et‐New‐World‐Rec
                                                                                                                              cord.pdf 
2
  Stirling Ene
             ergy Systems, SEES. (2008b). Sola              d on November 15th, 2008 from 
                                             ar Two. Accessed
http://www  w.stirlingenergy.c
                             com/projects/de efault.asp 

 
                                                                                                                                                1 
 
2. BACKGROUND   
The following sections are intended to provide a brief overview of the ideal Stirling cycle 
thermodynamics and assumptions made in the analysis of a real Stirling engine.  It is very important to 
note that the real Stirling cycle is very complex and relies on a combination of design approximations 
and experimental tests to successfully design and build a working Stirling engine.  Since the analyses 
developed for designing Stirling engines are inaccurate and because experimentation is expensive the 
accepted course for building a Stirling engine is to model off of existing engines using experimental 
scaling parameters.  Unfortunately, for the design of this project there is a lack of reference material 
that could be used for scaling purposes.  Hence, the team has relied heavily on scaling the design from a 
known working gamma type Stirling engine, property of Dalhousie.  By using these approximations with 
ideal Stirling cycle theory and analyses the team is confident that the project will be successful given the 
time allotted for testing and refinement in 2009.  The project has been designed to allow for refinement 
and adjustments which is critical given the lack of known theory. 


2.1. Ideal Stirling Engine Cycle 
The ideal Stirling cycle is represented in Figure 2 and consists of four processes which combine to form a 
closed cycle: two isothermal and two isochoric processes.  The processes are shown on both a pressure‐
volume (P‐v) diagram and a temperature‐entropy (T‐s) diagram as per Figure 2.  The area under the 
process path of the P‐v diagram is the work and the area under the process path of the T‐s diagram is 
the heat.  Depending on the direction of integration the work and heat will either be added to or 
subtracted from the system.  Work is produced by the cycle only during the isothermal processes.  To 
facilitate the exchange of work to and from the system a flywheel must be integrated into the design 
which serves as an energy exchange hub or storage device.  Heat must be transferred during all 
processes.  See Table 1 for a description of the 4 processes of the ideal Stirling cycle (Borgnakke et al., 
2003). 


                                           Figure 2 ‐ Ideal Stirling Cycle P‐v and T‐s Diagrams3 

                                                            
       3
          Power from the Sun. (2008a). Power Cycles for Electricity Generation. Accessed on October 12th, 2008 from 
     http://www.powerfromthesun.net/chapter12/Chapter12new.htm#12.3.1%20%20%20%20%20Stirling%20Engines 

                                                                                                                           2 
 
The net work produced by the closed ideal Stirling cycle is represented by the area 1‐2‐3‐4 on the P‐v 
diagram.  From the first law of thermodynamics the net work output must equal the net heat input 
represented by the area 1‐2‐3‐4 on the T‐s diagram.  The Stirling cycle can best approximate the Carnot 
cycle out of all gas powered engine cycles by integrating a regenerator into the design.  The regenerator 
can be used to take heat from the working gas in process 4‐1 and return the heat in process 2‐3.  Recall 
that the Carnot cycle represents the maximum theoretical efficiency of a thermodynamic cycle.  Cycle 
efficiency is of prime importance for a solar powered engine for reasons that the size of the solar 
collector can be reduced and thus the cost to power output ratio can be decreased. 

Table 1 : Ideal Stirling Cycle Process Summary
Process 1‐2 : Isothermal compression 
       •      Heat rejection to low temperature heat sink  
       •      1Q2 = area 1‐2‐b‐a on T‐s diagram 
       •      Work is done on the working fluid (energy exchange from flywheel)   
       •      1W2 = area 1‐2‐b‐a on P‐v diagram 

Process 2‐3 : Isochoric heat addition 
       •      Heat addition (energy exchange from regenerator) 
       •      2Q3 = area 2‐3‐c‐b on T‐s diagram 
       •      No work is done 
       •      2W3 = 0 

Process 3‐4 : Isothermal expansion 
       •      Heat addition from high temperature heat sink 
       •      3Q4 = area 3‐4‐d‐c on T‐s diagram 
       •      Work is done by the working fluid (energy exchange to flywheel) 
       •      3W4 = area 3‐4‐a‐b on P‐v diagram 

Process 4‐1 : Isochoric heat rejection 
       •      Heat rejection (energy exchange to regenerator) 
       •      4Q1 = area 1‐4‐d‐a on T‐s diagram 
       •      No work is done 
       •      4W1 = 0 


2.2. Real Stirling Engine Cycle 
The real Stirling engine cycle is represented in Figure 3 below.  As can be seen there is work being done 
during processes 2‐3 and 4‐1 unlike the prediction of zero work in the ideal cycle.  One of the major 
causes for inefficiency of the real Stirling cycle involves the regenerator.  The addition of a regenerator 
adds friction to the flow of the working gas.  In order for the real cycle to approximate the Carnot cycle 
the regenerator would have to reach the temperature of the high temperature thermal sink so that 
TR=TH.  A measure of the regenerator effectiveness is given by Equation 1, with the value of e=1 being 
ideal. 


                                                                                                                                                                                           3 
 
 
                                                    Figure 3 ‐ Real Stirling Cycle P‐v Diagram Approximation4 
 
                     ……………………………………………………………………………………… (1)
 
TH = Temperature of high thermal sink 
TL = Temperature of low thermal sink 
TR = Mass averaged gas temperature of regenerator leaving during heating 
The Carnot efficiency is denoted by Equation 2 and the real cycle efficiency with regenerator is denoted 
by Equation 3.  Though regeneration is not required for a Stirling cycle, its inclusion can help improve 
the efficiency if applied properly.  Note how the regenerator efficiency does not tend to zero as the 
regenerator effectiveness tends to zero. 
 
                   1             ……………………………………….………….………….……………… (2) 


                                                ⁄       ⁄                ⁄      ⁄
                                                                                       ……………………………………… (3)

                                           ………………………………………………………………………... (4) 


4
     Power from the Sun. (2008b). Power Cycles for Electricity Generation. Accessed on October 12th, 2008 from 
http://www.powerfromthesun.net/chapter12 /Chapter12new.htm#12.3.1%20%20%20%20%20Stirling%20Engines 

 
                                                                                                                      4 
 
Another major cause for inefficiencies of the real Stirling cycle engine is that not all of the working gas 
participates in the cycle, i.e. dead volume.  The dead volume involves the volume that does not 
participate in the swept volume of the piston stroke.  Martini (2004) states that the relationship 
between the percentage of dead volume in the system to the decrease in work done per cycle is linear.  
Therefore, if the engine has 20% dead volume then the power output would be 80% of the power that 
would be produced with zero dead volume.  In actuality, dead space will always be present because the 
addition of internal heat exchangers, clearances, transfer tubes, and regenerators are required to 
enhance the heat exchange of the real system.   

Though the ideal Stirling cycle can be analyzed using known thermodynamic principles, the analysis 
exists as an approximation of the real Stirling engine.  Team 4 took this into consideration in the final 
design of the Stirling engine so that certain design parameters such as the stroke length, temperature 
differential, and flywheel mass could be altered during the testing phase to optimize the Stirling engine. 


                                                                                                           5 
 
3. DESIGN REQUIREMENTS  
The following design requirements of Table 2 summarize the scope of the project, the final goals, and 
objectives team 04 intended to achieve.   

Table 2 : Design Requirements   
Design & Operational Elements 
    •    Must be able to operate using a solar heat source. 
    •    Must be able to operate using a compact heat source that is safe for indoor use. 
    •    Must be able to operate unassisted after starting for a minimum of 5 minutes (except for a 
         controlling heat source). 
    •    Must be built to a standard which delivers a minimum service life expectancy of 5 years, if 
         properly maintained. 

Size, Weight and Complexity 
    •    Total engine size and weight to be such that safe and easy transportation is possible by 1 
         person. 
    •    Must be mounted on a compact support structure for stability and safety. 
    •    Will be designed for ease of maintenance and assembly. 

Aesthetics & Safety 
    •    High temperature regions must be clearly indicated. 
    •    Engine cylinder must be equipped with a removable fitting for piston inspection and pressure 
         release. 

Documentation 
    •    Supporting documentation and user instructions to be provided for later usage within the 
         Mechanical Engineering department of Dalhousie University. 

Cost & Materials 
    •    Pending the usage of machining time and salvaged components, the prototype is estimated to 
         cost less than $3500. 
    •    Construction materials for the support frame and engine will consist mainly of steel or 
         aluminum, depending on cost, availability, and component purpose. 
    •    Precision components such as pistons, piston rings, and bearings may be purchased off the shelf 
         or salvaged. 


                                                                                                         6 
 
4. DESIGN SELECTION 
In order to ensure the best design was chosen the design selection process was evaluated with respect 
to 8 design criteria.  Options were brainstormed and researched within each category to weight each 
design selection based on a scale of importance.  Weighted design selection charts were assembled with 
all important considerations to determine the best choice. The categories are: Power output, friction 
losses, simplicity, thermal isolation, available literature, temperature differential, efficiency, and visual 
aesthetics.  These categories are weighted from most important (x5) to least important (x1) which acts 
as a multiplier. Table 3 shows the design selection matrix.  


    Table 3 : Design Selection Matrix 


Each design concept is rated from best (x5) to worst (x1) with respect to the design criteria. Team 04 
prioritized these criterions with power generation and visual aesthetics for classroom demonstration as 
the most important.  The other criterions were chosen based on clear differences between the design 
concepts and necessary design components. The major issues to overcome when building a Stirling 
engine are friction losses, maintaining a high temperature differential and thermal isolation. Each 
criterion was weighted based on how easy the issue is to overcome. The available literature for each 
concept was rated least important because it has little to do with design.  Any available literature may 
however, aid in thermodynamic calculations for the chosen concept.  From Table 3 the team concluded 
that the Inline Alpha Stirling Engine was the best design concept for this project. 


                                                                                                            7 
 
4.1. Rotary Stirling Engine 
Figure 4 displays the Rotary Stirling Engine in its four main positions. It is clear that the rotary design has 
few moving parts and therefore has the least amount of losses due to friction.  As shown in the design 
selection matrix, the Rotary Stirling Engine performs poorly in the categories of: power output, thermal 
isolation, available literature, temperature differential and efficiency. This poor performance ultimately 
caused the rotary concept to fail the team’s selection process. 


                                                               Figure 4 ‐ Rotary Stirling Engine5 


a) The air is in the cold lower portion, contracting, and drawing the piston upwards. 
b) The inertia of the flywheel continues rotation in this neutral phase. 
c) The air is in the hot upper portion, expanding, and pushing the piston downwards. 
d) The inertia of the flywheel continues rotation in this neutral phase. 


4.2. Gamma Stirling Engine 
The Gamma Stirling Engine appears to be a popular design for working models.  The main difference in 
this model is the use of two cylindrical pistons as per Figure 5. The motion of the displacer piston in the 
gamma concept is reciprocating as opposed to rotational in the rotary design.  As outlined in the design 
selection matrix, the gamma concept shows an increase in friction losses when compared to the rotary 
design.  This would be a result of an increase in moving parts and an increase in complexity of design. 
Thermal isolation and maintaining a temperature differential become easier with the gamma model as 
this design uses two isolated pistons. 


5
  Lewis, Jim. (2001). New Simplified Heat Engine. Modified from http://www.emachineshop.com 
/engine/animation.htm 
                                                                                                                8 
 
Figure 5 ‐ G
                                                     Gamma Stirling E
                                                                    Engine 


4.3. Alp
       pha Stirling
                  g Engine ‐ 90° Arrang
                                      gement 
The 90° arrangement o  of the Alpha SStirling Engine
                                                   e shown in Figure 6 featur
                                                                            res two sealed d pistons with
                                                                                                        h a 
transfer tube and optio onal regeneraator between n the two cylin
                                                                nders.  Whenn compared to  o the rotary a
                                                                                                        and 
gamma co  oncepts in thee selection m
                                    matrix, the alpha arrangement is the mo ost efficient and produces the 
most powwer.  However  r, due to the 9
                                     90° orientatioon this concept has the po
                                                                            otential to cre
                                                                                          eate more fricction.  
Alignment of the shaft ts would be crrucial and anyy error would
                                                               d add to the s
                                                                            system friction: ultimately 
deciding wwhether or no ot the design succeeds. 


                                  Figure 6 ‐ Alpha Stir
                                                      rling Engine – 90
                                                                      0° Arrangement


a) Expanssion ‐ Most of f the gas is in the hot cylinder and begin   ns to expand driving both pistons inward.  
   Work i is output duriing the onset  t of this proceess. 
b) Transfeer ‐ Cold pisto
                        on is forced ddownward allo    owing the heated gas to b be transfer to the cold cylin
                                                                                                             nder. 
c) Contraction ‐ Expan nded gas is in the cold cylin   nder and cont tracts drawing both pistonns outward. 
d) Transfeer ‐ The contrracted gas is s still located in
                                                       n the cold cylinder.  Work is input into t
                                                                                                the system byy the 
   inertia
         al energy of thhe flywheel w which carries t  the crank throough 90°, transferring the gas back to tthe 
   hot cylinder, and co ompleting the  e cycle. 

                                                                                                                    9 
 
5. COMPONENT DESIGN, FABRICATION AND BUILD PROCESS 
Following the design selection process the Inline Alpha Stirling Engine Arrangement shown in Figure 7 
was chosen for the final design.  This design excelled in the categories of power output, thermal 
isolation, temperature differential and visual aesthetics. 


                                   Figure 7 ‐ Final Concept to Build Comparison 

The design of our engine was based on ease of assembly and disassembly. Because of this, all 
components are fastened together using either nuts and bolts or cap head machine screws.  This was 
beneficial for our team as it allowed for quick engine component modifications, such as size of stroke 
length and piston rod length.  The entire fabrication process took approximately one month. This was 
due to the large number of parts and high level of precision required. The following sub‐sections will 
outline the design methods of various components as well as discuss any modifications made to the 
initial designs. 

5.1. Frame 
As depicted in Figure 8, the frame will be used to support the piston cylinders and flywheel rotating 
assembly.  The frame was constructed of ½” 6061 Aluminum Plate because it is light weight, durable and 
easy to machine.  The majority of the frame manufacturing was completed using a milling machine, with 
the exception of parts that require a precision circular hole (i.e. flywheel supports and cylinder clamps).  
The bearing seats in the supports for the flywheel were slightly changed during the fabrication process.  
For a cleaner look, instead of having the bearing flush with the outside edge of the frame, the bearing 
was pushed further into the stand and an internal retaining ring was used to hold it in place (Figure 8).  


                                                                                                          10 
 
 
                               Figure 8 ‐ Assembled Frame and New Bearing Seat 


5.2. Cylinders and Cylinder Heads 
To maximize the heat transfer between the cold cylinder and the surrounding water bath the team 
designed a simple array of annular fins to increase the external surface area of the cylinder. Heat 
transfer calculations for steel and brass, available in Appendix C, show an approximate 320‐400% 
increase in heat transfer with the addition of a fin 15mm in length.  Based on these calculations the 
team selected brass as the cold cylinder material as it enabled a larger heat transfer when compared to 
steel.  Other benefits of choosing brass over steel are that it will not rust in the ice bath and it has 
improved dry frictional characteristics with steel (i.e. brass is a self lubricating metal). 

The team chose a large number of fins with a spacing 2.5 times the thickness to ensure maximum 
surface area. Because the system involves free convection it was important to choose large fin spacing. 
By increasing the water volume between the fins the result is effectively an increase in the engine 
efficiency. A larger volume of water between fins will take longer to heat up, thus maintaining a higher 
temperature differential for an extended period of time. 

The original cylinder design was a one piece cylinder and cylinder head.  After some brainstorming and 
discussions with our technician, our team decided it was best to construct the cylinder and cylinder head 
in two pieces.  This would allow for a more precise finish on the inside bore of the cylinders as well as 
allow for easy assembly and troubleshooting if required.  The manufacturing process was carried out 
using a lathe.  The finalized cylinders can be seen in Figure 9. 


                                                                                                       11 
 
 
                               Figure 9 ‐ Hot and Cold Cylinders and Cylinder Heads 

5.3. Pistons 
To help reduce friction and increase durability, grooved pistons are used in our system.  The grooves 
around the piston serve as a pressure seal when the piston and cylinder are machined to low tolerances. 
The piston was originally going to be constructed of cold rolled steel to ensure consistency in thermal 
expansion for the hot cylinder assembly.  However, our technician supplied us with a similar material 
that was easier to machine and finish.  This was considered to be important due to the high tolerances 
between the piston and cylinder walls. The better the surface finish the lower the friction generated.  

The brass‐on‐steel interaction between the cold cylinder and piston will not pose an issue for thermal 
expansion due to the low temperature gradient across the cold cylinder assembly as designed. The 
interaction of brass and steel has low sliding frictional properties. Figure 10 displays the manufacturing 
process of one of the pistons on the lathe as well as the finished product. 


                                Figure 10 ‐ Piston Manufacturing and Final Product 

5.4. Cranks 
The design of the cranks had to incorporate two things, stroke length and the generation of a force 
couple.  The stroke length of our system is twice the distance from the center of rotation of the crank to 


                                                                                                         12 
 
the location where the piston rod is connected.  The stroke length could be easily lengthened or 
shortened by changing the location of the hole accordingly. 

In addition to stroke length, the other governing factor on the design of the crank was the need to 
create a force couple that would cancel the linear translational force exerted on the system due to the 
mass of the piston accelerating over its stroke length.  As the piston reaches top and bottom dead 
center in its stroke, the acceleration of the piston mass changing directions generates a sinusoidal force 
on the system which has the potential to produce undesired and damaging vibrations.  In order to cancel 
this sinusoidal force caused by the piston mass, the crank is typically designed as an eccentric mass that 
creates a balancing force.  Figure 11 shows the initial design of the crank with the force couple indicated.  
Here FC defines the balancing force of the eccentric crank and FP is the force due to the sinusoidal 
motion of the piston. 


                                     ½ Stroke Length


                                  Fp                                  Fc


                          Figure 11 ‐ Crank Design Showing Force Couple and Stroke Length 

5.5. Flywheel and Collars 
One of the major components of our design is the flywheel; a mechanical device designed to have a 
significant rotational moment of inertia.  Flywheels are used as rotational energy storage devices to 
resist changes in rotational speed, thus aiding in maintaining smooth shaft rotation. In addition to this, 
flywheels assist in driving the system over the duration of a cycle in which no net power is being 
produced.  During these periods the flywheel uses its stored energy to power the system through the 
portion of the cycle where no power is produced.  This feature is very important in the design of a 
Stirling Engine because 25% of the cycle is flywheel dependant (both pistons are compressing the 
working fluid); hence work is required by the system.  Another 50% of the cycle does not involve any 
work input or output; here the flywheel is required to provide the power necessary to smoothly 
overcome any frictional forces in the system. This concept is presented in Figure 12. The states of the 
cycle can be referenced as per Figure 2, Figure 3 and Figure 16.  It was manufactured from steel using a 
lathe. 


                                                                                                          13 
 
 
                                 Figure 12 ‐ Stirling Cycle Flywheel Dependance 

5.6. Piston Rods and Brass Connection Fittings 
The fittings used to connect the piston rods to the pistons and cranks were made of brass due to its low 
sliding frictional properties.  During the manufacturing process a slight modification was made to one of 
the brass fittings. The length of the piece closest to the piston was increased from 0.875” to 1.125” to 
allow for more threads for the machine screw holding the piston in place.  As a result the original piston 
rod length was shortened by 0.250”.  Team 04 made sure to make brass fitting design simple to inter‐
change piston rod length as it might be necessary during the testing phase of the project.  The piston rod 
and brass fitting setup can be seen in Figure 13. 


                                  Figure 13 ‐ Brass Fittings and Connecting Rods 

5.7. Fresnel Spot Lens 
For the solar aspect of our design project our team selected a Fresnel Spot Lens.  A spot lens was chosen 
for its concentrated beam shape and adjustability in focusing the incident solar radiation onto the hot 
cylinder head.  The Lens was purchased online and measures 27” x 36”.  Our team constructed a frame 
for the lens that allows for vertical adjustments as well as 360° rotation about the horizontal axis.  This 


                                                                                                         14 
 
was crucial as it allowed for tracking of the sun which is required to maintain spot temperature intensity.  
Figure 14displays the Fresnel lens and frame. 


                                       Figure 14 ‐ Fresnel Lens and Frame 


                                                                                                         15 
 
6. DESIGN ANALYSIS AND REVISED CALCULATIONS 
The following sections summarize the results of intensive engineering calculations concerned primarily 
with the external heat transfer and thermodynamics of the working fluid.  The raw data and calculations 
can be found in the Appendices.  The calculations have been re‐done to reflect the changes made to the 
design in January and the final optimized configuration as of April 2009.   

6.1. Schmidt Analysis of Ideal Isothermal Model 
To determine the theoretical energy output an ideal isothermal analysis was performed on a simplified 
model of the final engine design.  The ideal isothermal analysis is incapable of predicting results for the 
real cycle but can be used as a guide for design refinement purposes and to gauge the maximum 
theoretical capabilities of the engine.  The assumptions of an ideal isothermal model are defined below: 

        • Temperature of compression space/cold cylinder is at the lower limit of the cold sink 
        • Temperature of expansion space/hot cylinder is at the upper limit of the hot sink  
        • Heat exchangers are 100% effective  
        • Regenerator is 100% effective 
        • Volume of the working spaces vary sinusoidally with crank angle 
         
Refer to Figure 15 for a representation of the isothermal alpha Stirling engine.  The issue with the 
isothermal analysis is that the heat transfer from the internal heat exchangers is zero because there is 
no temperature differential to facilitate the flow of heat.  The net heat exchange between the 
compression and expansion spaces with the surroundings is equal to the net work.  A more accurate 
model would involve an adiabatic analysis; however, the solution is much more complicated and 
requires an iterative solver.  The solution to the adiabatic analysis is still an approximation and it could 
not be justified for this design. 


                                                      Figure 15 ‐ Simplified Isothermal Alpha Stirling Engine6 

                                                            
6
  Urieli, Israel. (2002a). Isothermal Analysis of Alpha Stirling Engine. Accessed on November 1st, 2008 from 
http://www.sesusa.org/DrIz/isothermal/isothermal.html 

                                                                                                                      16 
 
The ideal isothermal approximation of the Stirling cycle was used to generate a list of equations 
describing the thermodynamic process.  The Schmidt analysis was then used to solve these equations 
for pressure, temperature and energy transfer by assuming that volume varies sinusoidally with the 
crank angle as per Figure 16.  The states of the cycle from 1‐4 are labeled as per Figure 2 and Figure 3 as 
per Section 2.  Please refer to Appendix B for the derivation and solution of the isothermal Schmidt 
analysis.    


                                             1            2            3            4


                                     Figure 16 ‐ Sinusoidal Volume Dependence on Crank Angle7 

The analysis was performed using the original design specified in December, the refined design specified 
by the final build report in January, and by using the test results and configuration of the optimized 
design specified at the beginning of April.  The results are presented in Table 4.  The optimized design is 
discussed in more detail in Section 9.  In Section 9 the results from April will be used in a comparison of 
theory to experimental results to determine the overall performance of the engine and the accuracy of 
the Schmidt analysis.   
                                                        
                                   Table 4 : Results of Schmidt Analysis of Ideal Isothermal Model 
                Results                              December                     January                   April 
                PMEAN (kPa)                              299                         306                    177 
                PMAX (kPa)                               715                         747                    201 
                PMIN (kPa)                               125                         125                    156 
                QOUTPUT(J)                             ‐25.94                      ‐17.07                 ‐0.6338 
                QINPUT (J)                              54.45                       35.82                  1.424 
                WNET (J)                                28.51                       18.75                  0.7906 
                RPM                                 assume 200                  assume 200              measured 384 
                Power (W)                                95                          94                       5 
                Efficiency (%)                           52                          52                      56 


7
  Urieli, Israel. (2002b). Schmidt Analysis. Accessed on November 1st, 2008 from http://www.sesusa. org/DrIz/isothermal/Schmidt.html 


                                                                                                                                        17 
 
6.2. Fin Heat Transfer 
To prove the effectiveness of adding external fins to the cold cylinder a heat transfer analysis was 
carried out.  Calculations were carried out for both steel and brass. The results are shown in Figure 17.  
As a result of this analysis the initial fin length of 10mm was increased to 15mm as results show a 
considerable increase in heat transfer.  The fin length, in theory, should have been increased to 30mm 
for maximum heat transfer in steel.  When using brass for the cylinder material the heat transfer 
continues to increase with fin length; this is due to its high thermal conductivity.  However; due to frame 
clearance issues and ease of machining a fin length of 15mm was chosen.  With this fin length there is an 
approximate 320% increase in heat transfer for steel and 400% for brass when compared to using no 
fins.  The calculation results for 10mm and 15mm are depicted in Appendix C. 

                                        Heat Transfer and Fin Efficiency with Varying Fin Length
                 120                                                                                              1

                                                                                                                  0.9
                 100
                                                                                                                  0.8

                                                                                                                  0.7
                         80


                                                                                                                        Fin Efficiency
     Heat Transfer (W)


                                  Heat Transfer Without Fins
                                                                                                                  0.6
                                  Steel Fins
                         60       Brass Fins                                                                      0.5
                                  Steel Fin Efficiency
                                                                                                                  0.4
                                  Brass Fin Efficiency
                         40
                                                                                                                  0.3

                                                                                                                  0.2
                         20
                                                                                                                  0.1

                          0                                                                                       0
                              0            0.01                  0.02                    0.03       0.04   0.05
                                                                        Fin Length (m)
                                                                                                                                          
                                                    Figure 17 ‐ Heat Transfer and Fin Efficiency 


                                                                                                                  18 
 
7. INITIAL TESTING 
Following the completion of engine component fabrication and assembly a preliminary test was 
performed to evaluate engine performance. The test was performed with the engine configuration as 
seen in Figure 18. The test consisted of applying a propylene heat source to the hot cylinder head with 
no ice water cooling applied to the cold cylinder. The test was performed with all engine components 
being unmodified except for the use of a rubber transfer tube as procurement of additional materials 
was required. 


                                        Figure 18 ‐ Initial Testing Setup 

7.1. Testing Observations 
After applying the heat source and achieving temperatures of approximately 350˚C on the hot cylinder 
head, operation of the engine was unsuccessful. In addition to unsatisfactory performance many 
undesired conditions were witnessed.  Following the initial testing failure, it became immediately 
apparent that a number of issues would have to be addressed: 1) the flexible transfer tube with low 
melting point would have to be replaced for a more permanent and robust connection, 2) as expected, 
the metal to metal contact of the frame with the hot cylinder acted as a thermal short that would need 
to be isolated/insulated to prevent large heat transfer losses to the frame and for safety reasons, and 3) 
high bending stresses and deflections from the large compression ratios were significant and would have 
to be reduced. Maximum system pressure was found to be 10 psi with single cylinder pressures capable 
of reaching 20 psi. Figure 19 illustrates the damage to the rubber transfer tube as a result of heat 
transfer to the brass push‐on connections. 


                                                                                                       19 
 
Heat Damage


                             Figure 19 ‐ Heat Damage to Temporary Transfer Tube 

7.2. Design Solutions 
Initial testing provided useful information regarding engine performance and highlighted undesirable 
conditions. Solutions to these issues were addressed during the design refinement process and include 
reducing stroke length to decrease compression, insulating hot cylinder from the frame, replacing the 
rubber transfer tube with a metal pipe, and promoting heat transfer to the working gas.


                                                                                                    20 
 
8. DESIGN REFINEMENTS & PERFORMANCE IMPROVEMENTS  
To address the problems identified during our initial testing, a rigorous design refinement was 
undertaken.  Because the art of designing a Stirling engine is not a hardened science, the design 
refinement process is not as simple as selecting a new electric motor from a catalogue,  or picking up a 
new piece of hardware from a supplier. This meant that often several iterations were required in order 
to see an improvement in performance. Many performance solutions were designed and tested in 
sequence with increasing success.  The following sub‐sections will discuss in detail the major design 
refinements and performance improvements undertaken.  It is in Section 9 that the iterative testing and 
troubleshooting procedure is demonstrated along with the testing results. 

8.1. Design Refinements 
8.1.1. Frame Heat Dissipation  
Following our initial application of heat to the engine, it was apparent that there was a significant 
amount of heat being dissipated from the hot cylinder through the aluminum frame. This caused the 
entire engine assembly to become hot to the touch and transferred significant amounts of heat to the 
cylinder being cooled. This however was expected and a solution to the problem was readily available.  

To prevent heat from transferring to the frame from the hot cylinder, an insulating layer of material was 
required at their point of contact. In order to accommodate a layer of insulation between the cylinder 
and the frame, modifications were required on the hot side of the cylinder clamps.  1/8“ was removed 
from the cylinder clamps so that the hot cylinder floated freely. Two layers of Teflon wrap in addition to 
Fiberglass paper insulation was then tightly wrapped around the hot cylinder to fill the 1/8” gap 
between the cylinder and frame clamps, see Figure 20. After the insulation was secured and the clamps 
adjusted, heat was again applied to the cylinder. A significant improvement was achieved with minimal 
heat being transferred to the frame. With the cylinder head being upwards of 550°C, the region of the 
frame in contact with the insulation would reach a maximum temperature of 65°C, safe enough to 
touch. Figure 21 is a thermal image taken of the engine after being heated and illustrates the 
temperature difference achieved between the cylinder head and the frame. 


                                       Figure 20 ‐ Hot Cylinder Insulation 

                                                                                                        21 
 
 
                                          Figure 21 ‐ Thermal Image 

8.1.2. Compression Reduction  
It was evident from the initial test that the cylinder compression was too high for the scale of our 
application. The pressures achieved in the cylinders were enough to cause significant vibration and 
bending of the frame itself. High compression, however, is the main characteristic of the Alpha type 
Stirling engine due to there being two sealed pistons and cylinders. Suitable compression ratios for 
these types of engines are not well documented therefore an iterative design refinement was required 
when trying to achieve a compression ratio that provided a significant performance increase. 

To reduce the compression, two options were available. One was to decrease the stroke length which 
would reduce the volume of air being compressed; the second was to reduce the connecting rod length 
which would increase the minimum volume of the system there by decreasing the amount of 
compression. 

The stroke length was first reduced by ¾” by drilling new holes in the cranks. This significantly reduced 
the compression and provided the first noteworthy performance gains. After testing this stroke length 
with various sizes of connecting rods, the stroke was again reduced by 5/8”, see Figure 22. After 
machining several new sizes of connecting rods, it was possible to significantly decrease the 
compression of the system. The motor exhibited “signs of life” and would attempt to maintain itself in 
operation.  


                                                                                                         22 
 
 
                                      Figure 22 ‐ Stroke Length Reduction 

8.1.3. Transfer Tube 
The original transfer tube, which was only selected for initial testing, had a maximum temperature 
rating that was much less than the application required. Heat quickly conducted through the brass 
fitting on the cylinder head, elevating the temperature of the hose beyond its melting point. Sufficient 
testing was unable to be performed until a suitable replacement transfer connection was found. 

Several attempts were made to build a transfer tube using ½”copper pipe; however, soldering the joints 
was not an option as most solder has a melting temperature of around 190°C which is below the 
operating temperature of the hot cylinder. The brass fitting on the cylinder head had the potential to 
melt the solder. An alternative to soldering the joints was the use of JB weld. This provided initial 
success however sufficient temperatures caused the JB weld to crack, reducing the integrity of the 
transfer tube, see Figure 23. Finally the use of threaded steel fittings provided an adequate solution that 
withstood repeated tests without diminished results, see Figure 24. 


                                    Figure 23 ‐ Heat Damaged Transfer Tube 


                                                                                                         23 
 
 
                                        Figure 24 ‐ Steel Transfer Tube 

8.2. PERFORMANCE IMPROVEMENTS 
Following several iterations of design refinements, many of the initial complications were overcome. In 
an effort to improve the performance and efficiency of the engine, several engineering improvements 
were made.  Due to the extensive amount of time dedicated to design and the high quality of machining, 
the engine had a high mechanical efficiency. Frictional losses were not a major factor limiting 
performance; however, it was evident that improvements were required to increase the thermal 
efficiency of the system. 

8.2.1. Internal Fins 
Early in the design process initial brainstorming began on an internal fin array that would increase heat 
transfer to and from the working gas. This concept was not finalized before fabrication of the engine had 
commenced and the idea was put on hold. After the initial testing provided insight into the thermal 
efficiency of the engine, it was decided that internal fins might provide increased engine performance.  

The internal fin array was to be seated against the cylinder head (both hot and cold) and in the direct 
path of the gas flow to maximize heat transfer. The fins of an aluminum vehicle radiator provided an 
ideal solution with relatively minimal fabrication required. A used radiator was salvaged from an auto 
shop and a portion of the fin structure was removed. A circular pattern equal to the internal diameter of 
the cylinders was then applied to the section of radiator where it was then cut with a band saw and 
sanded smooth, see Figure 25.  Aluminum sleeves were machined to encase the circular fins and to 
protect the cylinder walls from scratching. In addition to providing protection, the aluminum sleeves 
ensure an intimate contact with the cylinder walls for the efficient heat transfer. Figure 26 shows the 
completed fins situated in the cylinder. The internal fins proved effective at assisting heat transfer and 
provided a notable performance increase. 


                                                                                                        24 


                                  Figure 25 ‐ Internal Fins Fabrication Process 


                                       Figure 26 ‐ Internal Fin Placement 

8.2.2. Regenerator 
In an effort to further increase the thermal efficiency of the engine the use of a regenerator was 
selected. The initial engine design called for the use of a regenerator, however, our limited 
understanding of regenerator design and the difficulties we had already incurred due to troublesome 
transfer tubes, made us reluctant to begin further modifications.  

The effect of including a regenerator in the transfer tube had already been examined during the design 
selection process and operates much like an economizer situated in the gas flow between the hot and 
cold cylinders. The regenerator design consisted of a section of ¾”steel pipe with flanges welded on 
each end, see Figure 27. The flanged pipe was fitted between the cylinders and replaced the existing 
transfer tube, see Figure 28. Steel wool was inserted in the pipe to provide a dense thermal mass to 
exchange heat with the gas flow between cylinders. The large surface area of the steel wool provided 

                                                                                                       25 
 
efficient heat transfer to strip heat from the gas as it flowed into the cold cylinder and return that heat 
to the cooled gas as it traveled back into the hot cylinder. The addition of the regenerator provided a 
significant performance increase and allowed for sustained operation of the engine. 


                                       Figure 27 ‐ Regenerator Components 


                               Figure 28 ‐ Installed Regenerator with Ice Water Bath


                                                                                                           26 
 
9. Testing and Troubleshooting 
The following sections will describe the various tests performed on the solar collector and Stirling engine 
from January to April 2009. Of critical importance is the iterative testing procedure developed by the 
team to progressively and successfully optimize engine performance.  This procedure was necessary as 
there are many parameters that must be considered when designing a Stirling engine which are not 
easily determined and often require fine tuning and modification of the constructed engine.  This proved 
to be a gamble as the team would only get one shot to build an engine, so the team designed an engine 
that could be easily modified to meet a wide range of operating conditions and assembly configurations.  
It is for these reasons that team 4 planned in advance an extended testing period. 

9.1. Fresnel Lens Testing 
The solar collector used in the following tests is referred to as a Fresnel lens.  The lens is a light weight 
acrylic film fixed in a rectangular wooden frame of dimensions 36”x 27” for a total area of 0.627 m2.  
Using a daily average solar insolation of ~ 500 W/m2 for the month of March as cited by Environment 
Canada, the maximum solar input using the lens would be ~314 W.  This number is a conservative 
estimate and realistic heat rates were determined indirectly through experimental measurements in 
Test #2 below.  Proper safety precautions were strictly practiced when using the lens: 1) weld goggles 
were used by the individual when required for recording temperatures, 2) the lens was tilted away from 
the sun when transporting and left unattended, 3) the focal point was tracked and located using a long 
piece of wood, and 4) fire extinguishers and/or water was close at hand in case of fire. 

9.1.1. Test #1 ‐ General Testing Results ‐ January 23rd (2 pm) 
Following the construction of the wooden frame depicted in Figure 29 required to support the Fresnel 
lens, team 4 conducted numerous qualitative and quantitative tests which involved simply holding a 
variety of objects under the focal point of the lens.  These tests helped serve as a basis for 
understanding the effects of surface conditions and types of materials on heat generation rates and 
temperature distributions.   


                            Figure 29 ‐ Fresnel Lens and Infrared Thermometer Readings 


                                                                                                           27 
 
Figure 30 depicts some of the various objects used to demonstrate the concentrating power of the 
     Fresnel lens.  The first object is of an aluminum can that was held under the focal point for 
     approximately 10 seconds.  Aluminum has a melting temperature of 660°C.  Even though aluminum 
     has a high thermal conductivity and reflective surface the lens was still able to concentrate enough 
     energy fast enough to melt the aluminum.  The amount of heating could be increased by insulating 
     the object from the environment and by painting the surface a dull black to minimize reflectivity. 
     The lens was also capable of creating molten asphalt.  It was also demonstrated that the lens could 
     set fire to wood instantaneously. 


                               Figure 30 ‐ Various Objects Held under the Fresnel Lens 


9.1.2. Test #2‐ Temperature Measurements ‐ April 1st (12:40 to 1:10 pm) 

The intent of this test was to determine the rate of heat absorption of a cylindrical steel object of 
dimensions 3”D x 2‐1/8”L.  The surface of the object was painted black and the sides and base were 
insulated.  A digital picture of the cylindrical steel object is shown in Figure 31.  The ambient 
temperature was 5°C on a clear, sunny day.  The temperature was read at a depth of three quarters the 
length using an infrared thermometer and recorded every 30 seconds for a total of 30 minutes.  The 
results are displayed in Figure 32 below.  The temperature increases over time in an exponential 
relationship as expected from theory (as the surface temperature increases the losses due to convection 
and radiation increase so a leveling off occurs).  Temperatures just above 310°C were achieved at the 30 
minute mark. 

The test was repeated with the propylene torch which is the heat source used during testing.  The idea 
here is to compare the relative heat transfer rates of the torch and lens.  Figure 32 shows that it took 
the torch half the time to reach temperatures above 310°C, so a very crude approximation suggests that 
the torch has double the heating potential in comparison to the lens.  Note that the performance of the 
lens depends on the time of year, weather, time, and ambient air conditions, as well as other numerous 
factors so it is possible to improve on this.  It is very important to consider the testing results from 
Section 9.4.5 which required the team to apply the torch only 40 to 50% of the operating time to sustain 
peak RPM above 300.  From these results, it is not difficult to say that it is very possible for the engine to 
operate with the Fresnel lens alone under the right conditions. 


                                                                                                               28 
 
 
                                                       Figure 31 ‐ Cylindrical Steel Object


                                           Test #4 ‐ Fresnel Lens Testing
                            350

                            300

                            250
         Temperature (°C)


                            200

                            150

                            100

                             50

                              0
                                  0        5             10            15             20             25   30
                                                                  Time (min)
                                      Fresnel Lens Heat Source             Propylene Torch Heat Source
                                                                                                                
                                         Figure 32 ‐ Temperature Increase of Steel Stock vs. Time 
     
By using the temperature data of heating the steel specimen over the 30 minutes a rough 
estimate of the average net solar heating was calculated as 147 W.  Considering an ideal solar 
input of 314 W, the overall solar collection efficiency is about 47% depending on ambient 
conditions.  Since the heating rates of the torch are about double that of the Fresnel lens, a 
conservative estimate for the amount of net heat input from the torch would be about 300 W.  
These power rates are not absolute, but resemble the difference between input and losses and 
would equal to zero once the temperature reaches steady state.  
                                                                                                                   29 
 
9.1.3. Test #3 ‐ Solar Energy Input to Gamma ‘Windmill’ Stirling Engine ‐ April 1st 

April 1st would prove to be the last available day to test the solar collector before the project deadline 
on April 9th due to lack of permitting weather conditions.  Thus, the team was not able to demonstrate 
that the engine could be powered solely by solar radiation.  Though the test was never performed on 
the optimized and very much capable engine, the results from the lens testing show that it is very 
possible to get the engine running from solar radiation alone using the existing solar collector (if not it 
would be a simple matter of buying a slightly bigger lens!). 

In spite of the lack of solar testing results, the team was able to get the model gamma displacer type 
Stirling engine to run from solar radiation alone as depicted in Figure 33.  This test itself demonstrates 
that it is possible to power a Stirling engine using the existing solar collector.  It is important to note that 
the team’s engine was capable of operating much faster, longer and more efficiently than the gamma 
engine when using the same propylene torch as a heat source.  The scalability of the team’s alpha 
engine to the gamma engine are similar geometrically (swept volume, piston diameter, etc.) which also 
helps to validate the potential for the engine to be solar powered.   


                                        Figure 33 ‐ Gamma 'Windmill' Stirling Engine 

9.2. Iterative Testing and Troubleshooting Procedure 
Testing of the Stirling engine began on February 25th and was unsuccessful.  The initial assembly is 
depicted in Figure 18 and reveals the incomplete frame.  Since the initial failure, multiple engine 
configurations have been tested by manipulating the various design parameters.  In the beginning it was 
extremely difficult to diagnose why the engine refused to run because there were many parameters to 
consider, many of which were multi‐dependent on each other (i.e. depending on the configuration, a 
change in one parameter might improve the engine performance in some respect but negatively 
influence other parameters so as to unexpectedly render the engine in a worse condition or result in no 
effect at all). 

Through trial and error team 4 began to develop a greater understanding of these relationships which are summarized in 
are summarized in Table 5 below.  Following a complicated but intelligent iterative testing and troubleshooting process team 


                                                                                                                         30 
 
4 was able to successfully optimize engine performance.  The rest of this section will describe the various tests performed 
and demonstrate the successive iteration process summarized in  


                                                                                                                               31 
 
Table 6. 

As per Table 5, a list of potential actions is provided as a guide for making adjustments and for 
troubleshooting suspected poor performance areas.  A positive effect will be defined as an effect that 
has the result of improving the overall efficiency or improving the conditions of operation from the 
context of necessity, i.e. efficiency is reduced but the change is necessary for the engine to run as 
intended.  A negative effect will be defined as anything other than a positive effect.  As indicated by the 
results, each action has both negative and positive effects on engine performance which necessitates 
the need for a structured iterative testing process. 

Table 5 : Troubleshooting Parameters 
ID         Action                                              Effects of Changing Parameter                                               Result

                            • Compression ratio is decreased                                                                                 √ 
1     Reduce stroke 
                            • Reduced potential for friction and binding (slower piston travel and less severe crank angle)                  √ 
      length 
                            • Reduced swept volume (reduced theoretical power output for engine size‐scale)                                  X 
2     Increase dead         • Compression ratio is decreased (greatest effect)                                                               √ 
      space                 • Reduces heat transfer and efficiency                                                                           X 
                            • Improve heat transfer between cylinder walls and working gas (air) by increasing surface area                  √ 
3     Internal Heat 
                            • Increases dead space (see 2 – will be considered negative as dead space added is not an option)                X 
      Exchangers 
                            • Increases system flow friction                                                                                 X 
4     No lubrication        • Reduced friction compared to liquid lube (for hot cylinder oil is cooked, and cold cylinder oil thickens)      √ 
      (dry‐running)         • The lack of lubrication reduces the pressure sealing ability of pistons                                        X 
5     Solid graphite        • Excellent friction reduction (can resist high hot cylinder temperatures of maximum 550°C)                      √ 
      lubrication           • Suitable alternative to oil lubrication but still lacks high pressure sealing abilities                        X 
6     Increase flywheel     • Increases stored energy of the system (allows more consistent operation at high compression ratios)            √ 
      size                  • Longer rev‐up time (actual energy output is low, therefore slower acceleration)                                X 
      Metal transfer        • Threaded NPT connections provide tighter pressure seals                                                        √ 
7 
      tube vs. Flexible     • Metal can withstand the higher operational temperatures                                                        √ 
      rubber                • Undesirable heat transfer to cold cylinder is increased significantly                                          X 
                            •   Improve efficiency                                                                                           √ 
      Add or increase 
8                           •   Reduce the heat transfer requirements from the thermal reservoirs to the working gas                         √ 
      size of 
                            •   Increases system flow friction                                                                               X 
      regenerator 
                            •   Increases dead space (see 2 – will be considered negative as dead space added is not an option)              X 
9                           • Helium has a higher heat capacity (5x more than air) and thermal conductivity (6x more than air)               √ 
      Helium injection 
                            • Helium has a lower density (7x less than air), for the same pressure this is negative                          X 
10    Use higher            • Increases heat transfer rates into the system                                                                  √ 
      heating value fuel    • Can cause extreme localized temperatures (warping, hot spots, added friction etc.)                             X 
11    Improve heat          • Will help in heat transfer lag                                                                                 √ 
      distribution          • Could cause hot spots or heat unwanted areas as access to hot cylinder is limited at end and side              X 
12    Insulation of hot     • Improves the performance by limiting heat transfer losses                                                      √ 
      cylinder              • Potential alignment issues due to non‐rigid clamping surfaces                                                  X 


                                                                                                                                              32 
 
Table 6 : Successive Iterative Testing Process 
    Test    Date/Configuration                    Results                                                                          Action
                                                   Extreme compression ratios (possible solutions: 1, 2, 6) 
                                                   • 20 psi single cylinder, 10 psi system pressure 
             February 25th – Failure to run        • Significant frame bending of base ½” aluminum plate 
            • Large stroke length (2.5”)           Transfer tube melting (possible solutions: 7) 
     #1     • Minimum cylinder dead space          • Tube used was only for testing purposes until a more permanent fixture          12 
            • Flexible rubber transfer tube              could be fabricated upon final results (tube length, diameter) 
            • Propane torch heat source            Transfer of heat through clamps and frame (possible solutions: 12) 
                                                   • Significant impact on performance and efficiency 
                                                   • Safety hazard (must be addressed immediately) 
                                                   Transfer of heat through clamps and frame (resolved) 
             March 9th – Failure to run            • Max hot cylinder temperature of 260°C 
            • Addressed insulation of hot          • Clamps are warm but safe to the touch 
     #2                                                                                                                               2 
              cylinder by adding layer of          • Should install ice water bath on cold cylinder 
              insulation between clamps            Transfer tube melting (possible solutions: 7) 
                                                   Extreme compression ratios (possible solutions: 1, 2, 6) 
                                                   Reduction of compression ratio (possible solutions: 1, 2, 6) 
             March16th – Failure to run            • Improvement: flywheel carries the engine through more cycles 
     #3     • Reduced rod length 1/4”              • Reduction in frame flexure                                                     1, 10 
            • Ice water bath installed             Transfer tube melting (possible solutions: 7) 
                                                   Potential heat transfer issue (possible solutions: 3, 8, 9, 10, 11) 
                                                   Reduction of compression ratio (possible solutions: 1, 2, 6) 
                                                   • Improvement: flywheel carries the engine through more cycles 
                                                   • Reduction in frame flexure 
             March 17th – Failure to run 
                                                   Transfer tube melting (possible solutions: 7) 
     #4     • Reduced stroke length (1.75”)                                                                                        3, 4, 7 
                                                   Potential heat transfer issue (possible solutions: 3, 8, 9, 10, 11) 
            • Acetylene torch heat source 
                                                    • External heat good, suspect internal transfer to the gas is insufficient 
                                                   Lubrication (possible solutions: 4, 5) 
                                                   •      Oil breaking down in hot cylinder 
                      th
             March  20 – Failure to run            Compression ratio still too high (possible solutions: 1, 2, 6) 
            • Internal heat exchangers             Transfer tube melting (resolved) 
     #5     • Metal transfer tube                  Potential heat transfer issue (possible solutions:, 8, 9, 10, 11)                1,10 
            • No lubrication in hot cylinder       •      Installed aluminum internal heat exchanger inserts made from radiator 
            • Back to propane heat source          •      Noticeable improvement hints at heat transfer issues from prior 
                                                   Reduction of compression ratio (possible solutions: 2) 
                                                   •     Need to attempt maximum dead space configuration 
             March 23th – Failure to run 
                                                   •     At minimum stroke flywheel is sufficient for smooth cycle operation 
     #6     • Reduced stroke length (1.125”)                                                                                        2, 4 
                                                   •     Minimum stroke,  noticeable improvement  in smoothness of rotations 
            • Propane to Propylene fuel source 
                                                    Lubrication (possible solutions: 4, 5) 
                                                   •     Cold cylinder lubrication is cold and adds viscous friction 
                      th                           Reduction of compression ratio (resolved) 
             March 25  – Failure to run 
                                                   •     Maximum dead space and stroke length 
     #7     • Reduced rod length to shortest       Friction and binding of connections (possible solutions: 5)                      8,11 
            • Maximum cylinder dead space 
                                                   •     Not significant, but power output is minimal 
            • No lubrication in both cylinders 
                                                   Lack of energy transfer (possible solutions: 8, 9, 11) 
                      th                           Lack of energy transfer (possible solutions: 8, 9) 
             March 26  – Failure to run 
                                                   •     External heat input and internal heat exchangers not sufficient 
            • Same configuration as before 
     #8                                            •     Must change thermodynamic properties by lowering heat requirement         5, 8, 9 
            • Combined solar and torch heat 
                                                         (regenerator) or changing gas (helium) 
              source 
                                                   Friction and binding of connections (possible solutions: 5) 
         

Throughout the iterative design process the team was able to manipulate the design parameters and 
make gradual improvements and progress to the point that the engine needed only to be optimized to 
operate continuously.  In order to go through with optimization, it was necessary to gather more 
detailed temperature readings of the entire system using a data acquisition system described below. 

                                                                                                                                           33 
 
9.3. Temperature Data Acquisition  
Actual temperature measurement can be achieved with thermocouples.  Depending on the application 
different types of thermocouples can be used.  Choosing the correct thermocouple requires looking at a 
number of factors. The most important factors include thermocouple type and junction type.  
Thermocouple type is important because it incorporates temperature ranges, accuracy, and cost. 
Junction type is important when looking at probe thermocouples because this depends on the 
atmosphere of the intended application, intended life span of the thermocouple, the process being 
measured, and response time.   


9.3.1. Thermocouples 
Type K (CHROMEGA®‐ALOMEGA®) thermocouples were chosen based on a number of positive 
attributes. The first was their high temperature differential capability of ‐270 to 1372°C. This was 
positive because of the extreme temperatures of the alpha Stirling cycle. Also type K thermocouples are 
reasonable priced, mechanically strong, and is resistant to chemical attack. Surface and working fluid 
temperature measurements were desired for the system therefore surface and probe thermocouple 
arrangements were used.   

To measure the surface temperatures a type K surface thermocouple with self‐adhesive backing was 
chosen.  Figure 34is a picture of a new SA1‐K thermocouple.  This is not a probe type thermocouple so 
the junction type is always exposed directly to the applied surface.  The wire is Teflon coated to protect 
against heat damage.  


                       Adhesive Backing


                                                             Surface 
                                                        thermocouple wires 

                                                                                        
                                       Figure 34 ‐ Surface Thermocouple 

To measure the working fluid temperature a more complicated pressure tight thermocouple setup was 
needed. A type K probe thermocouple with exposed junctions was chosen for this application.  A probe 
thermocouple was needed for this measurement because it would be located inside a closed system. To 


                                                                                                         34 
 
keep system pressure a compression fitting was matched to the probe diameter and threaded into each 
cylinder head. In an exposed junction the wires are welded together and the insulation is sealed against 
penetration by liquid or gas. This type of thermocouple offers the least protection however was desired 
for accurate ambient working fluid temperature and fast response time.   Figure 35 shows a new 
KMTSS-010E-6 Omega thermocouple and compression fitting setup.  


                          Brass Compression Fitting


                        Exposed Junction  

                                                                                        
                                     Figure 35 ‐ Probe Thermocouple Setup 

9.3.2. Benchtop Digital Display 

The department of Mechanical Engineering supplied a new digital display thermometer unit, Omega 
MDSSi8, for testing.  This Portable and Rugged Metal Benchtop Enclosure was perfect for testing. This 
instrument allowed for easy thermocouple setup and the capability to monitor ten individual 
thermocouples via a dial as seen in Figure 36.  All exposed wires slide into screw down connections at 
the back for the unit.  Each wire terminal corresponds to the value on the dial at the front.  The team 
used junctions 5 through 10 for testing measurements.  


                                Figure 36 ‐ Omega MDSSi8 Digital Thermometer 


                                                                                                           35 
 
9.3.3. Thermocouple arrangement  

To accurately measure temperature distribution throughout the system, six thermocouples were 
strategically positioned on the Stirling engine, according to Figure 37. Infrared images were also used to 
see temperature distribution and are discussed in previous section.  Thermocouples were placed on 
multiple locations of interest: (1) Hot Cylinder Wall, (2) Hot Side Cylinder Clamp, (3) Hot Cylinder Head 
Fluid, (4) Regenerator, (5) Cold Cylinder Head Fluid, and (6) Cold Cylinder Head.  System fluid 
temperatures were also needed for engineering calculations: (5) Cold Cylinder Head Fluid.  The extreme 
hot head surface had to be measured using an infrared thermometer with a maximum 500°C output.  
The hot head was painted black with a flat matte finish to improve the infrared thermometer accuracy 
which assumes an irradiance emissivity of 1.0 (blackbody radiation).   


                                        Figure 37 ‐ Thermocouple Setup 


9.4. Stirling Engine Optimization 
After attaining moderate success in preliminary testing and troubleshooting an effort was made to 
record and monitor the conditions of operation to a greater detail so that further optimization could be 
achieved.  The following tests were conducted under controlled conditions to determine the 
temperatures throughout the engine during static priming and dynamic operation. 

Pressure gages of range 0 to 60 psig were used but did not generate usable results as the testable 
engine configuration was of low compression ratio.  Maximum pressures were not expected to exceed 1 
psig, though pressures in excess of 20 psig have already been realized in high compression ratio testing 
configurations, so leakage was not considered to be an issue. 


                                                                                                        36 
 
9.4.1. Test #1 ‐ March 30th, 2009 

Testing using the thermocouple display began on March 30th and the initial setup is displayed in Figure 
38.  The configuration consisted of a stroke length of 1.125”, maximum dead space, no lubrication, and a 
crude regenerator which was made by simply stuffing steel ribbon material into the existing transfer 
tube.  By using the thermal display the team was able to monitor the temperatures throughout the 
system and safely run the engine at higher temperatures.  In doing so the engine achieved a total 
operating time of 30 seconds which was a huge improvement from before.  The test results are 
summarized in Table 7.  The only noticeable differences between the static and operating conditions are 
that the mean cold air temperature increases while the hot air temperature decreases but less 
significantly.  This is because the hot head where the temperature is being measured is being heated 
directly while the major cooling in the cold cylinder occurs mostly deeper inside the cylinder where the 
external fins project. 


                                    Figure 38 ‐ Optimization Test #1 Setup 


                                    Table 7 : Optimization Test#1 Results 
                     Reading (°C)             Static Priming             Operating 
                     Hot Air                       453                     450 
                     Cold Air                      14.5                     51 
                     Hot Head                      446                     480 
                     Hot Cylinder                  228                    244.6 
                     Cold Head                     14.8                    17.8 
                     Transfer Tube                 115                    115.4 
                     Clamp                          53                      56 


                                                                                                        37 
 
9.4.2. Test #2 ‐ April 1st, 2009 

Following the moderate success of the previous test the team decided to design and install a ‘true’ 
regenerator with a larger capacity for steel ribbon to participate in heat exchange.  The dead space was 
also reduced to a minimum by swapping in longer rods.  The installed regenerator can be seen in Figure 
39.  The testing was a success and the operating time was increased to approximately 60 seconds. 


                             Figure 39 ‐ Optimization Test #2 Setup with Regenerator 

The team took the following temperature readings using a sampling time of 60 seconds, where each of 
the 6 temperature readings would be measured every 10 seconds.  The total priming time (heating 
under static conditions) was set for 30 minutes.  In Figure 40 the hot air temperature is seen increasing 
and decreasing.  This was the result of the heat source being turned on and off to try and maintain the 
hot air temperature around 400 to 450°C.  The reason for doing this was because the cylinder head 
heats up at a much higher rate than the side of the hot cylinder which was very pronounced.  This 
worried the team as this is an indication of heat transfer lag and could be detrimental to the design if 
the heat required by the working gas to operate the Stirling cycle was greater than that being supplied.   

The cold cylinder temperature readings are depicted in Figure 41 and are very closely related.  The cold 
air temperature only exceeds the cold head when the system is operating.  The results from Figure 42 
show that the clamps near the hot head only increase to a temperature of about 60 to 70°C which is safe 
to the touch and indicate that the insulation is working.  The temperature of the regenerator climbs to 
about 120°C.  The typical operating range recommended at this point would be when the hot air reaches 
a temperature of about 500°C and the hot cylinder side at about 260°C.  The next test attempts to 
record the RPM and potential power output as well as prime the engine in a shorter period of time. 


                                                                                                          38 
 
Test #2 ‐ Hot Cylinder Temperatures
                            600

                            500
         Temperature (°C)


                            400

                            300

                            200

                            100

                                 0
                                         0        5         10          15            20            25         30    35
                                                                            Time (min)
                                                            Hot Air             Hot Cylinder Side
                                                                                                                               
                                               Figure 40 ‐ Optimization Test #2 Hot Cylinder Temperatures 


                                             Test #2 ‐ Cold Cylinder Temperatures
                            25


                            20
        Temperature (°C)


                            15


                            10


                            5


                            0
                                     0        5           10           15           20          25            30    35
                                                                         Time (min)
                                                           Cold Air            Cold Head Surface
                                                                                                                           
                                               Figure 41 ‐ Optimization Test #2 Cold Cylinder Temperatures 


                                                                                                                                  39 
 
Test #2 ‐ Clamp and Regenerator Temperatures
                            140

                            120

                            100
         Temperature (°C)


                             80

                             60

                             40

                             20

                              0
                                  0        5          10          15           20          25          30    35
                                                                     Time (min)
                                                       Clamp (Hot)             Regenerator
                                                                                                                   
                                      Figure 42 ‐ Optimization Test #2 Clamp and Regenerator Temperatures 


9.4.3. Test #3 ‐ Run A ‐ April 4th, 2009 

For the third testing arrangement the team ran three separate Runs A, B, and C, and recorded the 
results.  Prior to testing, friction in the piston and cylinders was reduced by using graphite lubricant.  
Also, the compression ratio was reduced further by increasing the dead space to a maximum.  The 
regenerator was also packed more densely with steel ribbon.   Following the results from the prior test, 
the engine was primed to about 260°C on the hot cylinder side before initializing the cycle around the 20 
minute mark.  The hot cylinder temperatures of Figure 43 appear smoother because the heat was 
applied more consistently.  The remaining results for the cold cylinder and regenerator and clamps of 
Figure 44 and Figure 45 are consistent with the previous test. 

The engine ran continuously for 11 minutes and 12 seconds , reaching a peak speed of 192 RPM.  The 
engine could have continued running but the team removed the heat source at 9 minutes and the 
engine was able to run off stored energy for 2 minutes and 12 seconds.  

The engine went through cycles of slowing down and then speeding back up.  This could be explained by 
the variability of friction as it does not require much friction loss to bring the engine to a halt, and subtle 
changes in the alignment and bearing surfaces during operation can occur.  It was observed that the 
engine works best in a temperature range between 260°C to 300°C, which might imply that the hotter 
temperatures affect the system negatively.  It is unknown whether the high temperatures impose 
constrictions on heat transfer or cause mechanical binding/friction. 


                                                                                                                      40 


                                 Test #3 ‐ Run A ‐ Hot Cylinder Temperatures

                           600

                           500
        Temperature (°C)


                           400

                           300

                           200

                           100

                             0
                                 0           5             10             15            20             25      30
                                                                 Time (min)

                                                      Hot Air           Hot Cylinder Side
                                                                                                                         
                                     Figure 43 ‐ Optimization Test #3 ‐ Run A ‐ Hot Cylinder Temperatures 


                                 Test #3 ‐ Run A ‐ Cold Cylinder Temperatures

                           20
                           18
                           16
        Temperature (°C)


                           14
                           12
                           10
                            8
                            6
                            4
                            2
                            0
                                 0          5             10             15            20             25      30
                                                                 Time (min)

                                                             Cold Head Surface
                                                                                                                     
                                     Figure 44 ‐ Optimization Test #3 ‐ Run A ‐ Cold Cylinder Temperatures 


                                                                                                                            41 
 
Test #3 ‐ Run A ‐ Clamp and Regenerator 
                                              Temperatures
                          140

                          120
       Temperature (°C)


                          100

                           80

                           60

                           40

                           20

                           0
                                0            5             10            15            20            25        30
                                                                 Time (min)

                                                      Renenerator             Clamp (Hot)
                                                                                                                     
                                    Figure 45 ‐ Optimization Test #3 ‐ Run A ‐ Clamp and Regen Temperatures 


By replaying the video of the engine in slow motion following the initial energy input to the 
flywheel a graph of RPM and Power vs. time was produced as per Figure 46.  To determine the 
RPM, the number of rotations in 5 seconds was taken starting from every 10 second interval 
into the cycle to determine the 5 second forward difference average.  From here a trend line 
was fitted to the experimental results and the power was thus calculated.  The flywheel and 
cranks were treated as equivalent rotational disks of sizes 6.5”D x 1.25”T and 3”D x 0.5”T, 
respectively.  The translation of the pistons can be ignored because they do not gain energy as 
they continuously decelerate and accelerate.  The total mass moment of inertia was calculated 
to be 0.01872 kgm2.   

The average net power from start to peak RPM of 69 mW was calculated by finding the 
difference in rotational kinetic energy and dividing by the time interval.  The instantaneous net 
power was found by taking the derivative of the kinetic energy equation and using the RPM 
trend line.  The maximum potential power output should a generator be connected would be 
about 108 mW at about 130 RPM. 


                                                                                                                        42 
 
Test #3 - Run A - RPM and Power

                                 200
                                 180
                                 160
            Power (mW) and RPM


                                 140
                                 120
                                 100
                                 80
                                 60
                                 40
                                 20
                                   0
                                       0             10              20              30                40   50
                                                                          t (sec)
                                                                 RPM           Power Output
                                                                                                                  
                                           Figure 46 ‐ Optimization Test #3 ‐ Run A ‐ RPM and Power 


9.4.4. Test #3 ‐ Run B ‐ April 4th, 2009 

Following a similar process in Run ‘A’, the peak RPM of 312 was achieved at about 70 seconds 
into the cycle.  The average net power output was determined as 118 mW and the maximum 
power potential was calculated as 162 mW at about 256 RPM.  It is interesting to note the 
difference in the power output and RPM between Runs ‘A’ and ‘B’, however, it was observed 
that the engine experiences cyclic variations of both heat transfer and friction.  The results are 
displayed in Figure 47. 


                                                                                                                     43 
 
Test #3 - Run B - RPM and Power

                              350

                              300
         Power (mW) and RPM


                              250

                              200

                              150

                              100

                               50

                               0
                                    0             20                   40                   60      80
                                                           t (sec)

                                                           RPM           Power Output
                                                                                                          
                                        Figure 47 ‐ Optimization Test #3 ‐ Run B ‐ RPM and Power 


9.4.5. Test #3 ‐ Run C ‐ April 4th, 2009 

Video footage of the last run did not record the transient acceleration so a figure of the RPM and power 
could not be reproduced.  However, the fastest speeds were achieved in this run with a maximum RPM 
of about 384.  As suspected, towards the end of the video at about 4 minutes into the cycle, the sounds 
of rubbing could be heard.  This had been dealt with before and the team quickly identified the frictional 
rubbing to be from the pin and piston rod connection in the hot cylinder.  This connection was 
lubricated with oil and once it was heated for prolonged periods the oil evaporated and an increase in 
friction sufficient to slow the engine was realized.  This was overcome by lubricating all bearing and 
frictional surfaces with dry graphite lubrication. 


                                                                                                             44 
 
9.5.  Repeatability and Comparison to Theory 

The results of testing reveal that the operation and performance of the engine is repeatable.  The 
variations of friction and heat transfer make it difficult to get the engine to run consistently at 
prescribed conditions, however, the engine can be primed and operated to run at the optimized 
temperatures.  The following Table 8 summarizes and compares the testing results to theoretical 
predictions.  The net power output predicted by theory does not consider the system friction losses.  
The remaining values correlate better an expected to the gross approximations made by the isothermal 
analysis.  This is perhaps due to the fact that the actual heat requirement of the cycle is much lower 
than the total stored energy.  Also, the hot cylinder continued to heat up as the engine was operating 
which indicates that there was sufficient heat transfer input to keep the engine running. 

                                     Table 8 : Theory and Testing Results 
        Parameter                       Theory ‐ April        Test 3 ‐ A     Test 3 ‐ B    Test 3 ‐ C 
        Mean Pressure (psig)                5.17                 < 1            < 1           < 1 
        RPM                                  384                192            312           384 
        Hot Temp (°C)                        372              260‐500        280‐500       280‐500 
        Cold Temp (°C)                        0                  17             20            20 
        Net Power Output (mW)               5000                108            162           n/a 


                                                                                                         45 
 
10. BUDGET 
     Table 9 : Team 04 Budget 
Part Name                   Description                              Vendor/Supplier  Qty  Subtotal               To date 
Piston/Cylinder                                                                                    $223.50        $199.00 
Cold Cylinder               Yellow Brass Round stock 4x7"            Metals 'R' US           1         $182.00             $172.00 
Hot Cylinder                Steel Round stock 2.75x7"                Metals 'R' US           1          $19.00              $13.90 
Pistons                     Steel Round stock  2.25x2.5"             Metals 'R' US           2          $15.00               $8.45 
Connecting Rods             Steel Round stock  0.25x7"               Metals 'R' US           2           $4.00               $0.00 
Rod Ends                    Brass Round stock 1x2"                   Metals 'R' US           2            $3.50               $4.65 
Rotating Assembly                                                                                  $132.90       $41.57 
Piston Counter weight       Steel Plate 1x1x1/4" (ft.)               Metals 'R' US           2           $18.90            $6.15 
Shaft                       Steel Round stock  3/8x8"                Metals 'R' US           1            $9.00            $0.00 
Flywheel                    Steel Plate 1x1x3/4" (ft.)               Metals 'R' US           2           $55.00           $29.90 
Bearings                    Low Friction Ball Bearings               Kinecor                 2           $50.00            $5.52 
Frame                                                                                              $467.80       $202.04 
Frame Angle                 Aluminum Angle Stock 1x1x0.25"x2'L       Metals 'R' US           1           $5.00             $2.70 
Frame Base                  Aluminum Plate 6.5x12.25x0.5"            Metals 'R' US           1          $43.80           $115.00 
Frame Cylinder              Aluminum Plate 6x6x0.5”                  Metals 'R' US           1          $30.00         ^included 
Frame Shaft                 Aluminum Plate 7x13x0.5"                 Metals 'R' US           2         $135.00         ^included 
Cylinder Clamps             Aluminum Plate 12x10x0.5”                Metals ’R’US            1           $80.00       ^included 
Cylinder insulation         Semi‐ridged high temp wool insulation    McMaster Carr           1           $35.00           $47.74 
Nuts and Bolts              Various                                  Various                 1         $100.00            $36.60 
Ice Water Bath              Plexus Glass Sheet 1’x0.125”x4'L         Home Depot              1           $39.00            $0.00 
Measurement Tools                                                                                 $ 240.00       $284.50 
Pressure Gauge              Analog Gauge (1/4 MPT)                   Omega                   1         $100.00               $50.00 
Pressure Snubber            PS‐4G                                    Omega                   2           $0.00               $32.00 
Thermocouples               SA1‐K (surface)                          Omega                   5           $0.00               $75.00 
Thermocouples               KMTSS‐125E‐6                             Omega                   3         $140.00               $90.00 
Compression Fittings        BRLL‐18‐14, SSLK‐18‐14                   Omega                   3           $0.00               $37.50 
Thermocouple DAQ Block      Mechanical Engineering Lab               Lab                     1            $0.00           $0.00 
Solar Power Collector                                                                              $260.00       $117.73 
Fresnel lens                47x35" Lens                              Ebay/Greenpower         1         $200.00          $102.16 
Stand                       Wood 2x4"‐ 12ft.                         Home Depot              3           $60.00           $15.57 
Miscellaneous                                                                                      $255.00       $124.18 
Shipping Costs              Various                                  Various                           $100.00               $23.00 
Stationary Cost                                                      Various                            $50.00               $38.19 
Lubrication/ Consumables                                             Various                            $75.00               $31.18 
Transfer Tube               Copper, Rubber Hose, Steel Tube          Various                            $30.00               $31.81 
                                                                                                                                    
Net Cost                                                                                             $1,579.20             $969.02 
Tax 13%                                                                                                $205.90             $125.97 
Total Cost                                                                                           $1,784.50          $1094.99 

                            Supervisor Signature  
                                                                                                                                    
                            _______________________________                                       $1,784.50           $1094.99


                                                                                                                        46 
      
11. CONCLUSION 
11.1. Design Requirements Fulfillment 
Following completion of testing all but one of the original design requirements were fulfilled. The engine 
design allows for ease of assembly and provides the user with the ability to change operating 
parameters including compression ratio and cylinder volume. The engine can sustain operation in excess 
15 minutes which is ideal for demonstration purposes. Included with the engine are multiple 
thermocouples to monitor internal and external temperatures across the system.  

Lens testing prior to engine completion provided exceptional results with temperatures of a target steel 
mass reaching 310°C. Sustained operation of the department owned gamma Stirling engine was 
achieved with use of the Fresnel lens. However, final design refinements to our engine were not 
completed at the time of solar testing. Following the completion of the design refinements and 
performance improvements, weather conditions did not provided adequate solar exposure for testing. 
Although weather conditions did not permit our group to operate our engine using the solar lens, we are 
confident that we would achieve success given the extensive lens and engine testing that was 
performed. 

Table 10 provides a summary of the project design requirements and their fulfillment status. 

Table 10 : Design Requirement Status 
       Design Requirement                         Status                            Comment 
Must be able to operate on a                     Pending                Weather uncooperative. Unable 
solar heat source.                                                      to test with completed engine 
                                                                        during sunny day. 
Must be able to operate using a                                         Propane, Butane, Propylene 
compact heat source for indoor                                
use. 
Must be able to operate                                                 Engine capable of 15 min + 
unassisted after starting for a                                         demonstrations. 
minimum of 5 minutes. 
Must be built to a standard                                             Excellent design and fabrication 
which delivers a minimum                                                quality. Routine maintenance 
service life expectancy                                                 required. 
of 5 years, if properly 
maintained. 
Safely transportable by 1 person.                                       Engine weighs 35lb 
                                                              
Must be mounted on a compact                                            Compact aluminum frame 
support structure for stability                                         provides stability and safety. 
and safety. 


                                                                                                          47 
 
Will be designed for ease of                                          Engine can be disassembled and 
maintenance and assembly.                                             reassembled with ease. 
 
High temperature regions must                                         Hot cylinder head labeled and 
be clearly indicated.                                                 painted. 
Engine cylinder must be                                               Fittings located in both cylinder 
equipped with a removable                                             heads and used for pressure 
fitting.                                                              sensors and thermocouples. 
Supporting documentation and                                          Maintenance and operation 
user instructions to be provided.                                     manual provided. 
Total cost to be less than $3500.                                     Final cost of materials and 
                                                                      sensors: $1095 
Frame material consists of steel                                      Frame constructed from 
and aluminum for low cost build.                                      aluminum. 
Precision materials including                                         Bearings purchased. 
bearings may be purchased.                                  


11.2. Optimal System Operating Condition 
Concluding the extensive testing period it was determined that optimal system conditions and engine 
configurations existed. Maximum engine performance was experienced with an engine configuration 
and temperature conditions summarized in Table 11. 

Table 11 : Optimal Engine Conditions 

                       Parameter                                    Optimal Condition 
                                         Engine Configuration 
Stroke Length                                       1.125” (minimum compression) 
Connecting Rod Length                               Smallest (max volume) 
Performance Improvements                                • Internal Fins 
                                                        • Regenerator with durlon 8400 gaskets 
Lubricant                                           Graphite dry lubricant in both cylinders 
                                                     
                                        Temperature Conditions 
Hot Cylinder Head                                   500˚C 
Hot Cylinder Body                                   260˚C 
Temperature Priming Time                            ~20 Minutes 
Cold Cylinder Head                                  17˚C 
Cold Cylinder Body                                  0˚‐10˚C (Ice Water Bath) 


                                                                                                       48 
 
12. REFERENCES 
Bergman, T. L., Dewitt, D. P., Incropera, F. P., & Lavine, A. S. (2007). Introduction to Heat Transfer. 5th ed.  
     John Wiley & Sons.  


Borgnakke, C., Sonntag, R. E., & Wylen, G. V. (2003).  Fundamentals of Thermodynamics.  6th ed.  John 
     Wiley & Sons.  


Hibbeler, R. C. (2005). Mechanics of Materials. 6th ed.  Published by Pearson: Prentice Hall.   


Martini, W. R. (2004). Stirling Engine Design Manual. Published by University PR of the Pacific.  


Stirling Engine Society, SESUSA. (2006).  Ideal Isothermal Analysis.  Accessed on October 5th, 2008 from 
       http://www.sesusa.org/DrIz/isothermal/isothermal.html 


                                                                                                             49 


    APPENDIX A – Gantt Chart


                          50 


    51 


    APPENDIX B – Ideal Isothermal Analysis 


                                         1 
 
Ideal Isothermal Analysis – Schmidt Analysis 
The foregoing analysis is referenced from SESUSA (2006).  

Assumptions 
    •    Temperature of compression space (cold cylinder) at lower limit of cold sink (TL=Tc=Tk = 0°C) 
    •    Temperature of expansion space (hot cylinder) at upper limit of the hot sink (TH=Th=Te = 300°C) 
    •    Heat exchangers are 100% effective 
    •    Volume of working spaces varies sinusoidally 

Equation Formulation 
    1.                                                           (Total Mass) 
          
    2.                                                           (Ideal Gas Law) 
          
    3.                                                           (Substitution 1 and 2) 
          
    4.                                            (Effective Regenerator Temperature Assuming Linear Profile) 
                    /
          
    5.                                                           (Substituation 3 and 4) 

                                  /

          
         Note: Equation 5 depicts pressure as a function of Vc and Ve (all other partial volumes are 
         constant) 
          
    6.                                                                              (Cyclic Work Integral) 
          
    7.          /    
          
         Note: From the ideal Stirling cycle we can determine intuitively the following heat transfer 
         results:  
          
    8. Qc = Wc=
    9. Qe = We=                        
         Qk = 0  (no temperature difference, no heat transfer) 
         Qh = 0   (no temperature difference, no heat transfer) 
         Qr = 0   (internal heat transfer does not result in a change in energy of the system) 


The zero heat transfer in the heat exchanger sections is a paradox which results from the isothermal 
assumption and is not realistic for real Stirling engine systems.  A more appropriate analysis will employ 
the ideal adiabatic assumption; however, the results from this analysis are still useful for qualitative 
analysis and the solution is much simpler.  This is a good starting point. 

Solution 
The following derivations use the equations formulated from basic isothermal theory above. 
 
Volume 

Note: for volume dependence on crank angle   see the chart provided in reference section. 

    10.            ,               ,       1                θ /2 

    11.            ,               ,       1       cos α            θ /2 

    12.                ,               θ 

    13.                    ,   sin                 θ  

Vcl =clearance volume  
Vsw=swept (stroke) volume 
 =crank angle 
 =phase angle (       /2  

Pressure 
    14.

                                       ,                ,                                  /             ,   ,
             15.

             16.

                                                              ,            ⁄
             17.                                                   ⁄                   ⁄
                                                    ,                              ,


             18.               ⁄

                                               ,                       ,       ,                     ,
             19.                                            2

    20.                                when                       360° (n=0,1,2…)

    21.                                when                       180°                     1,3,5 …


                                                                                                                 3 
 
22.
                                                                         √


Energy 
                                                  ,
    23. Qc = Wc =
                                                  ,
    24. Qe = We =

          Integrated solution: 

    25.                 ,                √1            1                     where             
           
    26.                 ,         sin             √1           1             where             
           

Numerical Results 


                                  Figure 48 ‐ Schmidt Analysis Results for December Design 


                                                                                                  4 
 
 
             Figure 49 ‐ Schmidt Analysis Results for January Revised Design 


    Figure 50 ‐ Schmidt Analysis Results Using Actual Results from April Optimizations 


                                                                                          5 


    APPENDIX C – Heat Transfer Calculations 


                                          6 


    APPENDIX D – Engineering Drawings


No.    Part Name                         Material              Qty    Build Group 
1      Frame ‐ Base                      Aluminum              1      Angus MacPherson 
2      Frame ‐ Cylinder Support          Aluminum              1      Angus MacPherson 
3      Frame ‐ Shaft Support             Aluminum              2      Angus MacPherson 
4      Angle ‐ Cylinder Support          Aluminum              2      Angus MacPherson 
5      Angle ‐ Shaft Support             Aluminum              2      Angus MacPherson 
6      Clamp ‐ Cylinder                  Aluminum              4      Angus MacPherson 
7      Regenerator                       Steel                 1      Angus MacPherson 
8      Cylinder ‐ Hot                    Steel                 1      Angus MacPherson 
9      Cylinder ‐ Cold                   Brass                 1      Angus MacPherson 
10     Piston                            Steel                 2      Angus MacPherson 
11     Connector ‐ Piston                Brass                 2      Angus MacPherson 
12     Connector ‐ Rod                   Steel                 2      Angus MacPherson 
13     Crank/Counter Weight              Steel                 2      Angus MacPherson 
14     Shaft                             Steel                 1      Angus MacPherson 
15     Flywheel                          Steel                 1      Angus MacPherson 
16     Bearings                          Steel                 2      Buyout 
‐      Fresnel Lens                      Acrylic               1      Buyout 
‐      Frame ‐ Fresnel Lens              Pine                  N/A    Team 04 
‐      Ice Water Bath ‐ Cold Cylinder    Plexus‐glass          N/A    Team 04 
‐      Insulation ‐ Hot Cylinder         Mineral Wool Fiber    N/A    Buyout 
‐      Fasteners                         Steel                 N/A    Buyout 


Final report- stirling