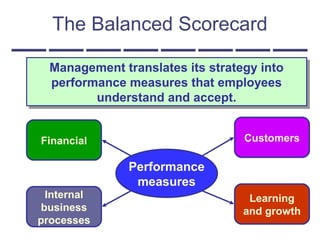
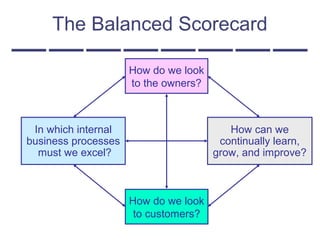
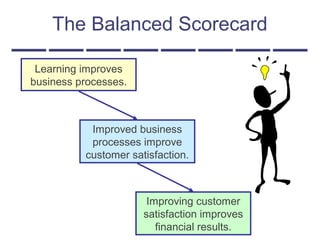
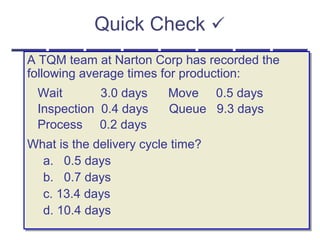
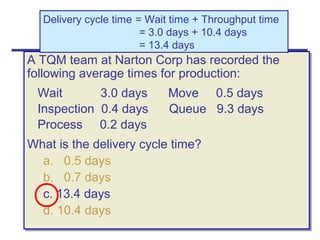
Balanced Scorecard
The Balanced Scorecard
Management translates its strategy into
performance measures that employees
understand and accept.
Management translates its strategy into
performance measures that employees
understand and accept.
Performance
measures
Customers
Learning
and growth
Internal
business
processes
Financial
The Balanced Scorecard
How do we look
to the owners?
How can we
continually learn,
grow, and improve?
In which internal
business processes
must we excel?
How do we look
to customers?
The Balanced Scorecard
Learning improves
business processes.
Improved business
processes improve
customer satisfaction.
Improving customer
satisfaction improves
financial results.
Benefits of Balance Scorecard
If implemented well:
• Forces management to articulate a coherent
strategy.
• Strategy is communicated throughout
organization.
• Performance measures are more likely to be
consistent with strategy and actionable.
• Portfolio of measures reduces gaming
problems.
• Feedback loop makes strategy dynamic.
Some Possible Problems
Cultural/behavioral
• Program fatigue.
• Culture shock/resistance.
• Every existing performance measure
has a champion.
• Gaming still possible.
Cultural/behavioral
• Program fatigue.
• Culture shock/resistance.
• Every existing performance measure
has a champion.
• Gaming still possible.
Process time is the only value-added time.
Delivery Performance
Measures
Wait Time
Process Time + Inspection Time
+ Move Time + Queue Time
Delivery Cycle Time
Order
Received
Production
Started
Goods
Shipped
Throughput Time
Delivery Performance
Measures
Manufacturing
Cycle
Efficiency
Value-added time
Manufacturing cycle time
=
Wait Time
Process Time + Inspection Time
+ Move Time + Queue Time
Delivery Cycle Time
Order
Received
Production
Started
Goods
Shipped
Throughput Time
Quick Check 
A TQM team at Narton Corp has recorded the
following average times for production:
Wait 3.0 days Move 0.5 days
Inspection 0.4 days Queue 9.3 days
Process 0.2 days
What is the throughput time?
a. 10.4 days
b. 0.2 days
c. 4.1 days
d. 13.4 days
A TQM team at Narton Corp has recorded the
following average times for production:
Wait 3.0 days Move 0.5 days
Inspection 0.4 days Queue 9.3 days
Process 0.2 days
What is the throughput time?
a. 10.4 days
b. 0.2 days
c. 4.1 days
d. 13.4 days
A TQM team at Narton Corp has recorded the
following average times for production:
Wait 3.0 days Move 0.5 days
Inspection 0.4 days Queue 9.3 days
Process 0.2 days
What is the throughput time?
a. 10.4 days
b. 0.2 days
c. 4.1 days
d. 13.4 days
A TQM team at Narton Corp has recorded the
following average times for production:
Wait 3.0 days Move 0.5 days
Inspection 0.4 days Queue 9.3 days
Process 0.2 days
What is the throughput time?
a. 10.4 days
b. 0.2 days
c. 4.1 days
d. 13.4 days
Quick Check 
Throughput time = Process + Inspection + Move + Queue
= 0.2 days + 0.4 days + 0.5 days + 9.3 days
= 10.4 days
Quick Check 
A TQM team at Narton Corp has recorded the
following average times for production:
Wait 3.0 days Move 0.5 days
Inspection 0.4 days Queue 9.3 days
Process 0.2 days
What is the MCE?
a. 50.0%
b. 1.9%
c. 52.0%
d. 5.1%
A TQM team at Narton Corp has recorded the
following average times for production:
Wait 3.0 days Move 0.5 days
Inspection 0.4 days Queue 9.3 days
Process 0.2 days
What is the MCE?
a. 50.0%
b. 1.9%
c. 52.0%
d. 5.1%
A TQM team at Narton Corp has recorded the
following average times for production:
Wait 3.0 days Move 0.5 days
Inspection 0.4 days Queue 9.3 days
Process 0.2 days
What is the MCE?
a. 50.0%
b. 1.9%
c. 52.0%
d. 5.1%
A TQM team at Narton Corp has recorded the
following average times for production:
Wait 3.0 days Move 0.5 days
Inspection 0.4 days Queue 9.3 days
Process 0.2 days
What is the MCE?
a. 50.0%
b. 1.9%
c. 52.0%
d. 5.1%
Quick Check 
MCE = Value-added time ÷ Throughput time
= Process time ÷ Throughput time
= 0.2 days ÷ 10.4 days
= 1.9%
Quick Check 
A TQM team at Narton Corp has recorded the
following average times for production:
Wait 3.0 days Move 0.5 days
Inspection 0.4 days Queue 9.3 days
Process 0.2 days
What is the delivery cycle time?
a. 0.5 days
b. 0.7 days
c. 13.4 days
d. 10.4 days
A TQM team at Narton Corp has recorded the
following average times for production:
Wait 3.0 days Move 0.5 days
Inspection 0.4 days Queue 9.3 days
Process 0.2 days
What is the delivery cycle time?
a. 0.5 days
b. 0.7 days
c. 13.4 days
d. 10.4 days
A TQM team at Narton Corp has recorded the
following average times for production:
Wait 3.0 days Move 0.5 days
Inspection 0.4 days Queue 9.3 days
Process 0.2 days
What is the delivery cycle time?
a. 0.5 days
b. 0.7 days
c. 13.4 days
d. 10.4 days
A TQM team at Narton Corp has recorded the
following average times for production:
Wait 3.0 days Move 0.5 days
Inspection 0.4 days Queue 9.3 days
Process 0.2 days
What is the delivery cycle time?
a. 0.5 days
b. 0.7 days
c. 13.4 days
d. 10.4 days
Quick Check Delivery cycle time = Wait time + Throughput time
= 3.0 days + 10.4 days
= 13.4 days

Costi Standard: 7. Balanced Scorecard

  • 1.
  • 2.
    The Balanced Scorecard Managementtranslates its strategy into performance measures that employees understand and accept. Management translates its strategy into performance measures that employees understand and accept. Performance measures Customers Learning and growth Internal business processes Financial
  • 3.
    The Balanced Scorecard Howdo we look to the owners? How can we continually learn, grow, and improve? In which internal business processes must we excel? How do we look to customers?
  • 4.
    The Balanced Scorecard Learningimproves business processes. Improved business processes improve customer satisfaction. Improving customer satisfaction improves financial results.
  • 5.
    Benefits of BalanceScorecard If implemented well: • Forces management to articulate a coherent strategy. • Strategy is communicated throughout organization. • Performance measures are more likely to be consistent with strategy and actionable. • Portfolio of measures reduces gaming problems. • Feedback loop makes strategy dynamic. If implemented well: • Forces management to articulate a coherent strategy. • Strategy is communicated throughout organization. • Performance measures are more likely to be consistent with strategy and actionable. • Portfolio of measures reduces gaming problems. • Feedback loop makes strategy dynamic.
  • 6.
    Some Possible Problems Cultural/behavioral •Program fatigue. • Culture shock/resistance. • Every existing performance measure has a champion. • Gaming still possible. Cultural/behavioral • Program fatigue. • Culture shock/resistance. • Every existing performance measure has a champion. • Gaming still possible.
  • 7.
    Process time isthe only value-added time. Delivery Performance Measures Wait Time Process Time + Inspection Time + Move Time + Queue Time Delivery Cycle Time Order Received Production Started Goods Shipped Throughput Time
  • 8.
    Delivery Performance Measures Manufacturing Cycle Efficiency Value-added time Manufacturingcycle time = Wait Time Process Time + Inspection Time + Move Time + Queue Time Delivery Cycle Time Order Received Production Started Goods Shipped Throughput Time
  • 9.
    Quick Check  ATQM team at Narton Corp has recorded the following average times for production: Wait 3.0 days Move 0.5 days Inspection 0.4 days Queue 9.3 days Process 0.2 days What is the throughput time? a. 10.4 days b. 0.2 days c. 4.1 days d. 13.4 days A TQM team at Narton Corp has recorded the following average times for production: Wait 3.0 days Move 0.5 days Inspection 0.4 days Queue 9.3 days Process 0.2 days What is the throughput time? a. 10.4 days b. 0.2 days c. 4.1 days d. 13.4 days
  • 10.
    A TQM teamat Narton Corp has recorded the following average times for production: Wait 3.0 days Move 0.5 days Inspection 0.4 days Queue 9.3 days Process 0.2 days What is the throughput time? a. 10.4 days b. 0.2 days c. 4.1 days d. 13.4 days A TQM team at Narton Corp has recorded the following average times for production: Wait 3.0 days Move 0.5 days Inspection 0.4 days Queue 9.3 days Process 0.2 days What is the throughput time? a. 10.4 days b. 0.2 days c. 4.1 days d. 13.4 days Quick Check  Throughput time = Process + Inspection + Move + Queue = 0.2 days + 0.4 days + 0.5 days + 9.3 days = 10.4 days
  • 11.
    Quick Check  ATQM team at Narton Corp has recorded the following average times for production: Wait 3.0 days Move 0.5 days Inspection 0.4 days Queue 9.3 days Process 0.2 days What is the MCE? a. 50.0% b. 1.9% c. 52.0% d. 5.1% A TQM team at Narton Corp has recorded the following average times for production: Wait 3.0 days Move 0.5 days Inspection 0.4 days Queue 9.3 days Process 0.2 days What is the MCE? a. 50.0% b. 1.9% c. 52.0% d. 5.1%
  • 12.
    A TQM teamat Narton Corp has recorded the following average times for production: Wait 3.0 days Move 0.5 days Inspection 0.4 days Queue 9.3 days Process 0.2 days What is the MCE? a. 50.0% b. 1.9% c. 52.0% d. 5.1% A TQM team at Narton Corp has recorded the following average times for production: Wait 3.0 days Move 0.5 days Inspection 0.4 days Queue 9.3 days Process 0.2 days What is the MCE? a. 50.0% b. 1.9% c. 52.0% d. 5.1% Quick Check  MCE = Value-added time ÷ Throughput time = Process time ÷ Throughput time = 0.2 days ÷ 10.4 days = 1.9%
  • 13.
    Quick Check  ATQM team at Narton Corp has recorded the following average times for production: Wait 3.0 days Move 0.5 days Inspection 0.4 days Queue 9.3 days Process 0.2 days What is the delivery cycle time? a. 0.5 days b. 0.7 days c. 13.4 days d. 10.4 days A TQM team at Narton Corp has recorded the following average times for production: Wait 3.0 days Move 0.5 days Inspection 0.4 days Queue 9.3 days Process 0.2 days What is the delivery cycle time? a. 0.5 days b. 0.7 days c. 13.4 days d. 10.4 days
  • 14.
    A TQM teamat Narton Corp has recorded the following average times for production: Wait 3.0 days Move 0.5 days Inspection 0.4 days Queue 9.3 days Process 0.2 days What is the delivery cycle time? a. 0.5 days b. 0.7 days c. 13.4 days d. 10.4 days A TQM team at Narton Corp has recorded the following average times for production: Wait 3.0 days Move 0.5 days Inspection 0.4 days Queue 9.3 days Process 0.2 days What is the delivery cycle time? a. 0.5 days b. 0.7 days c. 13.4 days d. 10.4 days Quick Check Delivery cycle time = Wait time + Throughput time = 3.0 days + 10.4 days = 13.4 days