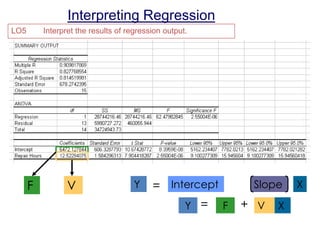
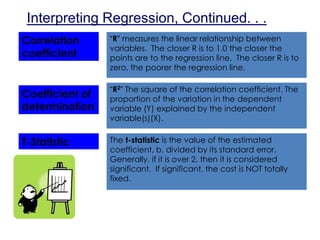
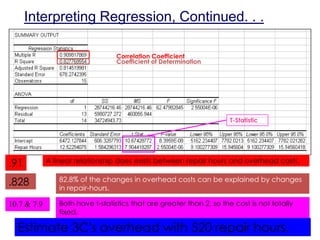
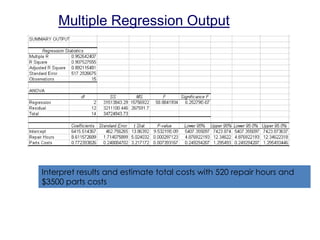
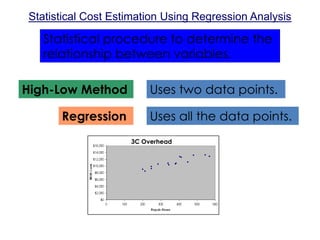
Cost Behavior
Cost Behavior
• Variable

• Fixed

• Mixed
Estimating Mixed Costs
• Scattergraph method
• Goal: Derive TC equation
– Hi-Low analysis
– Regression
– Multiple Regression
Interpreting Regression
LO5

Interpret the results of regression output.

F

V

Y

= Intercept
Y =

Slope
F

+ V

X

X
Interpreting Regression, Continued. . .
Correlation
coefficient

“R” measures the linear relationship between
variables. The closer R is to 1.0 the closer the
points are to the regression line. The closer R is to
zero, the poorer the regression line.

Coefficient of
determination

“R2” The square of the correlation coefficient. The
proportion of the variation in the dependent
variable (Y) explained by the independent
variable(s)(X).

T-Statistic

The t-statistic is the value of the estimated
coefficient, b, divided by its standard error.
Generally, if it is over 2, then it is considered
significant. If significant, the cost is NOT totally
fixed.
Interpreting Regression, Continued. . .
Correlation Coefficient
Coefficient of Determination

T-Statistic

.91

A linear relationship does exists between repair hours and overhead costs.

.828

82.8% of the changes in overhead costs can be explained by changes
in repair-hours.

10.7 & 7.9

Both have t-statistics that are greater than 2, so the cost is not totally
fixed.

Estimate 3C’s overhead with 520 repair hours.
Multiple Regression
Multiple Regression:

When more than one predictor (x)
is in the model.

Is repair-hours the only activity that drives
overhead costs at 3C?
Predictors:

X1: Repair-hours
X2: Parts Cost

Equation:

TC = VC(X1) + VC(X2) + FC
Multiple Regression, Continued. . .
3C Cost Information
Month

OH Costs

Repair-Hours (X1)

Parts (X2)

1

$9,891

248

$1,065

2

$9,244

248

$1,452

3

$13,200

480

$3,500

4

$10,555

284

$1,568

5

$9,054

200

$1,544

6

$10,662

380

$1,222

7

$12,883

568

$2,986

8

$10,345

344

$1,841

9

$11,217

448

$1,654

10

$13,269

544

$2,100

11

$10,830

340

$1,245

12

$12,607

412

$2,700

13

$10,871

384

$2,200

14

$12,816

404

$3,110

15

$8,464

212

$ 752
Multiple Regression Output

Interpret results and estimate total costs with 520 repair hours and
$3500 parts costs
Statistical Cost Estimation Using Regression Analysis

Statistical procedure to determine the
relationship between variables.
High-Low Method
Regression

Uses two data points.
Uses all the data points.
3C Overhead
Implementation Problems
LO6

Identify potential problems with regression data.

1. Curvilinear costs
2. Outliers
3. Spurious relations

Curvilinear costs

4. Assumptions
Identify relevant range

Analyze relevant range

Relevant
Range
ICE
Month

Customer Accts

Paychecks Proc

Acct Svc Costs

1

325

1029

63800

2

310

993

68900

3

302

1268

64000

4

213

1028

61300

5

222

984

61600

6

214

712

50800

7

131

762

51020

8

123

739

54300

9

115

708

50500

10

296

1232

64800

11

213

978

58000

12

222

929

57500

13

217

1059

62200

14

132

942

54900

15

300

1299

71530

16

315

1283

64800

3650

15945

959950

Totals
Required:

Based on customer accounts, paychecks processed
HiLo Analysis
Regression
Multiple Regression

Cost Behavior

  • 1.
  • 2.
  • 3.
    Estimating Mixed Costs •Scattergraph method • Goal: Derive TC equation – Hi-Low analysis – Regression – Multiple Regression
  • 4.
    Interpreting Regression LO5 Interpret theresults of regression output. F V Y = Intercept Y = Slope F + V X X
  • 5.
    Interpreting Regression, Continued.. . Correlation coefficient “R” measures the linear relationship between variables. The closer R is to 1.0 the closer the points are to the regression line. The closer R is to zero, the poorer the regression line. Coefficient of determination “R2” The square of the correlation coefficient. The proportion of the variation in the dependent variable (Y) explained by the independent variable(s)(X). T-Statistic The t-statistic is the value of the estimated coefficient, b, divided by its standard error. Generally, if it is over 2, then it is considered significant. If significant, the cost is NOT totally fixed.
  • 6.
    Interpreting Regression, Continued.. . Correlation Coefficient Coefficient of Determination T-Statistic .91 A linear relationship does exists between repair hours and overhead costs. .828 82.8% of the changes in overhead costs can be explained by changes in repair-hours. 10.7 & 7.9 Both have t-statistics that are greater than 2, so the cost is not totally fixed. Estimate 3C’s overhead with 520 repair hours.
  • 7.
    Multiple Regression Multiple Regression: Whenmore than one predictor (x) is in the model. Is repair-hours the only activity that drives overhead costs at 3C? Predictors: X1: Repair-hours X2: Parts Cost Equation: TC = VC(X1) + VC(X2) + FC
  • 8.
    Multiple Regression, Continued.. . 3C Cost Information Month OH Costs Repair-Hours (X1) Parts (X2) 1 $9,891 248 $1,065 2 $9,244 248 $1,452 3 $13,200 480 $3,500 4 $10,555 284 $1,568 5 $9,054 200 $1,544 6 $10,662 380 $1,222 7 $12,883 568 $2,986 8 $10,345 344 $1,841 9 $11,217 448 $1,654 10 $13,269 544 $2,100 11 $10,830 340 $1,245 12 $12,607 412 $2,700 13 $10,871 384 $2,200 14 $12,816 404 $3,110 15 $8,464 212 $ 752
  • 9.
    Multiple Regression Output Interpretresults and estimate total costs with 520 repair hours and $3500 parts costs
  • 10.
    Statistical Cost EstimationUsing Regression Analysis Statistical procedure to determine the relationship between variables. High-Low Method Regression Uses two data points. Uses all the data points. 3C Overhead
  • 11.
    Implementation Problems LO6 Identify potentialproblems with regression data. 1. Curvilinear costs 2. Outliers 3. Spurious relations Curvilinear costs 4. Assumptions Identify relevant range Analyze relevant range Relevant Range
  • 12.
    ICE Month Customer Accts Paychecks Proc AcctSvc Costs 1 325 1029 63800 2 310 993 68900 3 302 1268 64000 4 213 1028 61300 5 222 984 61600 6 214 712 50800 7 131 762 51020 8 123 739 54300 9 115 708 50500 10 296 1232 64800 11 213 978 58000 12 222 929 57500 13 217 1059 62200 14 132 942 54900 15 300 1299 71530 16 315 1283 64800 3650 15945 959950 Totals Required: Based on customer accounts, paychecks processed HiLo Analysis Regression Multiple Regression