This document presents a matrix methodology for allocating the costs of reactive power flows in transmission networks. The methodology traces reactive power flows through the network using Kirchhoff's current law and proportional sharing principles. It then allocates the costs of reactive power to generators and loads using the MVAr-mile method. The methodology is demonstrated on sample 6-bus and IEEE 14-bus test systems. Results show the allocated reactive power flows to different loads and the costs allocated to loads for recovery of total reactive power costs in the transmission network.
![International Journal of Advances in Applied Sciences (IJAAS)
Vol. 7, No. 3, September 2018, pp. 226~232
ISSN: 2252-8814, DOI: 10.11591/ijaas.v7.i3.pp226-232 226
Journal homepage: http://iaescore.com/online/index.php/IJAAS
Cost Allocation of Reactive Power Using Matrix Methodology in
Transmission Network
Gaurav Gupta, Manisha Dubey, Anoop Ayra
Department of Electrical Engineering, Maulana Azad National Institute of Technology, Bhopal, India
Article Info ABSTRACT
Article history:
Received Nov 23, 2017
Revised Mar 20, 2018
Accepted May 15, 2018
In the deregulated market environment as generation, transmission and
distribution are separate entities; reactive power flow in transmission lines is
a question of great importance. Due to inductive load characteristic, reactive
power is inherently flowing in transmission line. Hence under restructured
market this reactive power allocation is necessary. In this work authors
presents a power flow tracing based allocation method for reactive power to
loads. MVAr-mile method is used for allocation of reactive power cost. A
sample 6 bus and IEEE 14 bus system is used for showing the feasibility of
developed method.
Keywords:
Kirchhoff matrix
Reactive power allocation
Tracing of reactive power flow
pricing of electricity
Copyright © 2018 Institute of Advanced Engineering and Science.
All rights reserved.
Corresponding Author:
Gaurav Gupta,
Department of Electrical Engineering,
Maulana Azad National Institute of Technology,
Bhopal, Madhya Pradesh, India.
Email: gauravmits@gmail.com
1. INTRODUCTION
A fair transmission pricing methodology should recover all the cost of the transmission system and
provide profit to the transmission utility. So many methodologies have developed in past years for
transmission cost allocation in transmission system.
The active power production capability of generator will reduced due to more reactive power.
Hence, provision of pricing of reactive power becomes an important issue to be addressed in electricity
market as similar to real power pricing [1]. The voltage of the system must be controlled as an component of
reactive power supports so, the reliability can achieved but more pricing options required due to unrecovered
obtained cost with inclusion of capital cost under scheme proposed in [2]. Reactive power transaction
depends on indefinite sources such as susceptance of line, capacitor banks rating, generator capacity,
installed FACT devices capacity and so on while real power flows depends on source and direction, Reactive
power flow is continuously changing due to variable system operating condition. Further transmission of
reactive power does not carry over longer distances because it needed to fulfill local requirements. So while
locating reactive sinks, sources of reactive power identification became a big challenge. The scheme based
on proportional sharing principal [3-4] offer an effectual computational tool but that concept neither
discoverable nor verifiable for loss allocation. Power factor based reactive power costing methods are in
traditional use but these methods are inappropriate for the restructured power systems, because they
separately charged the cost of reactive power support. In addition, the tariff in current scenario only consider
local charges and consumption of reactive power calculated with respect to those variables which do not
judge the complete customer’s usage [3-6]. Relative electrical distance (RED) idea for transmission charge
allocation based on nodal pricing method influences the operation condition and system variable has been
discussed in [7]. The majority of the above referred solutions [3-7] show that transmission usage charge also](https://image.slidesharecdn.com/04-201022222528/75/Cost-Allocation-of-Reactive-Power-Using-Matrix-Methodology-in-Transmission-Network-1-2048.jpg)
![IJAAS ISSN: 2252-8814
Cost Allocation of Reactive Power Using Matrix Methodology in Transmission Network (Gaurav Gupta)
227
having cost of losses in transmission line as in form of their integral part so it does not required separate
calculation. The non-acceptability of these methods is due to the long computational time and nonlinearity
towards convergence. The Z-bus matrix and modified Y-bus matrix methods treated as circuit-based
allocation methods, all the computation in these methods are based on admittance matrix to solved power
flow [8], [9].The cost allocation towards line losses based on complex power injection has been addressed
in [10]. The virtual flow methodology for assessment of flow of reactive power in transmission network due
to different sources and particular load involvement with consideration of counter and loop flows without any
difficulty has been addressed in [11]. Flow of electrical power based on tracing approach shows their
importance due to its explanatory and comprehensibility in transmission network process. A method based on
tracing of electrical power has been reported in [12], [13] which, having assumption that outflow and inflow
on nodes are proportionally shared. This permits one to outline power flow in meshed structure. A tracing
based reactive power flow is reported by Bialek with upward and downward looking principle. The upward
looking principle look at the balancing of incoming flows towards the nodes and the downward looking
principle look at the balancing of outgoing flows from the nodes , then compute the power spread among
different loads [15].Power flow tracing methods dominate marginal participation method as there is full
recovery of cost by tracing flow [16]. It also depends on the Kirchhoff current laws and easy to implements
on larger power systems. Moreover it has very less volatility as compared to marginal participation methods.
It also provides uniformity and fairness in charge allocation due to depends on actual usage of system [17].
The locational marginal pricing for congestion cost with FACT controller by real power rescheduling for
pool based transaction has been discussed in [18]. Determination of generator contribution can be used for
congestion management as proposed in [19].
In this paper a reactive power flow allocation method has been proposed. After allocation of reactive
power, the total cost to be recovered from individual participant towards transaction of reactive power is also
allocated to different participant. For allocation power flow tracing technique is used while for cost allocation
MVAr-Mile method is used. Results are shown for 6 bus system and IEEE 14 bus system.
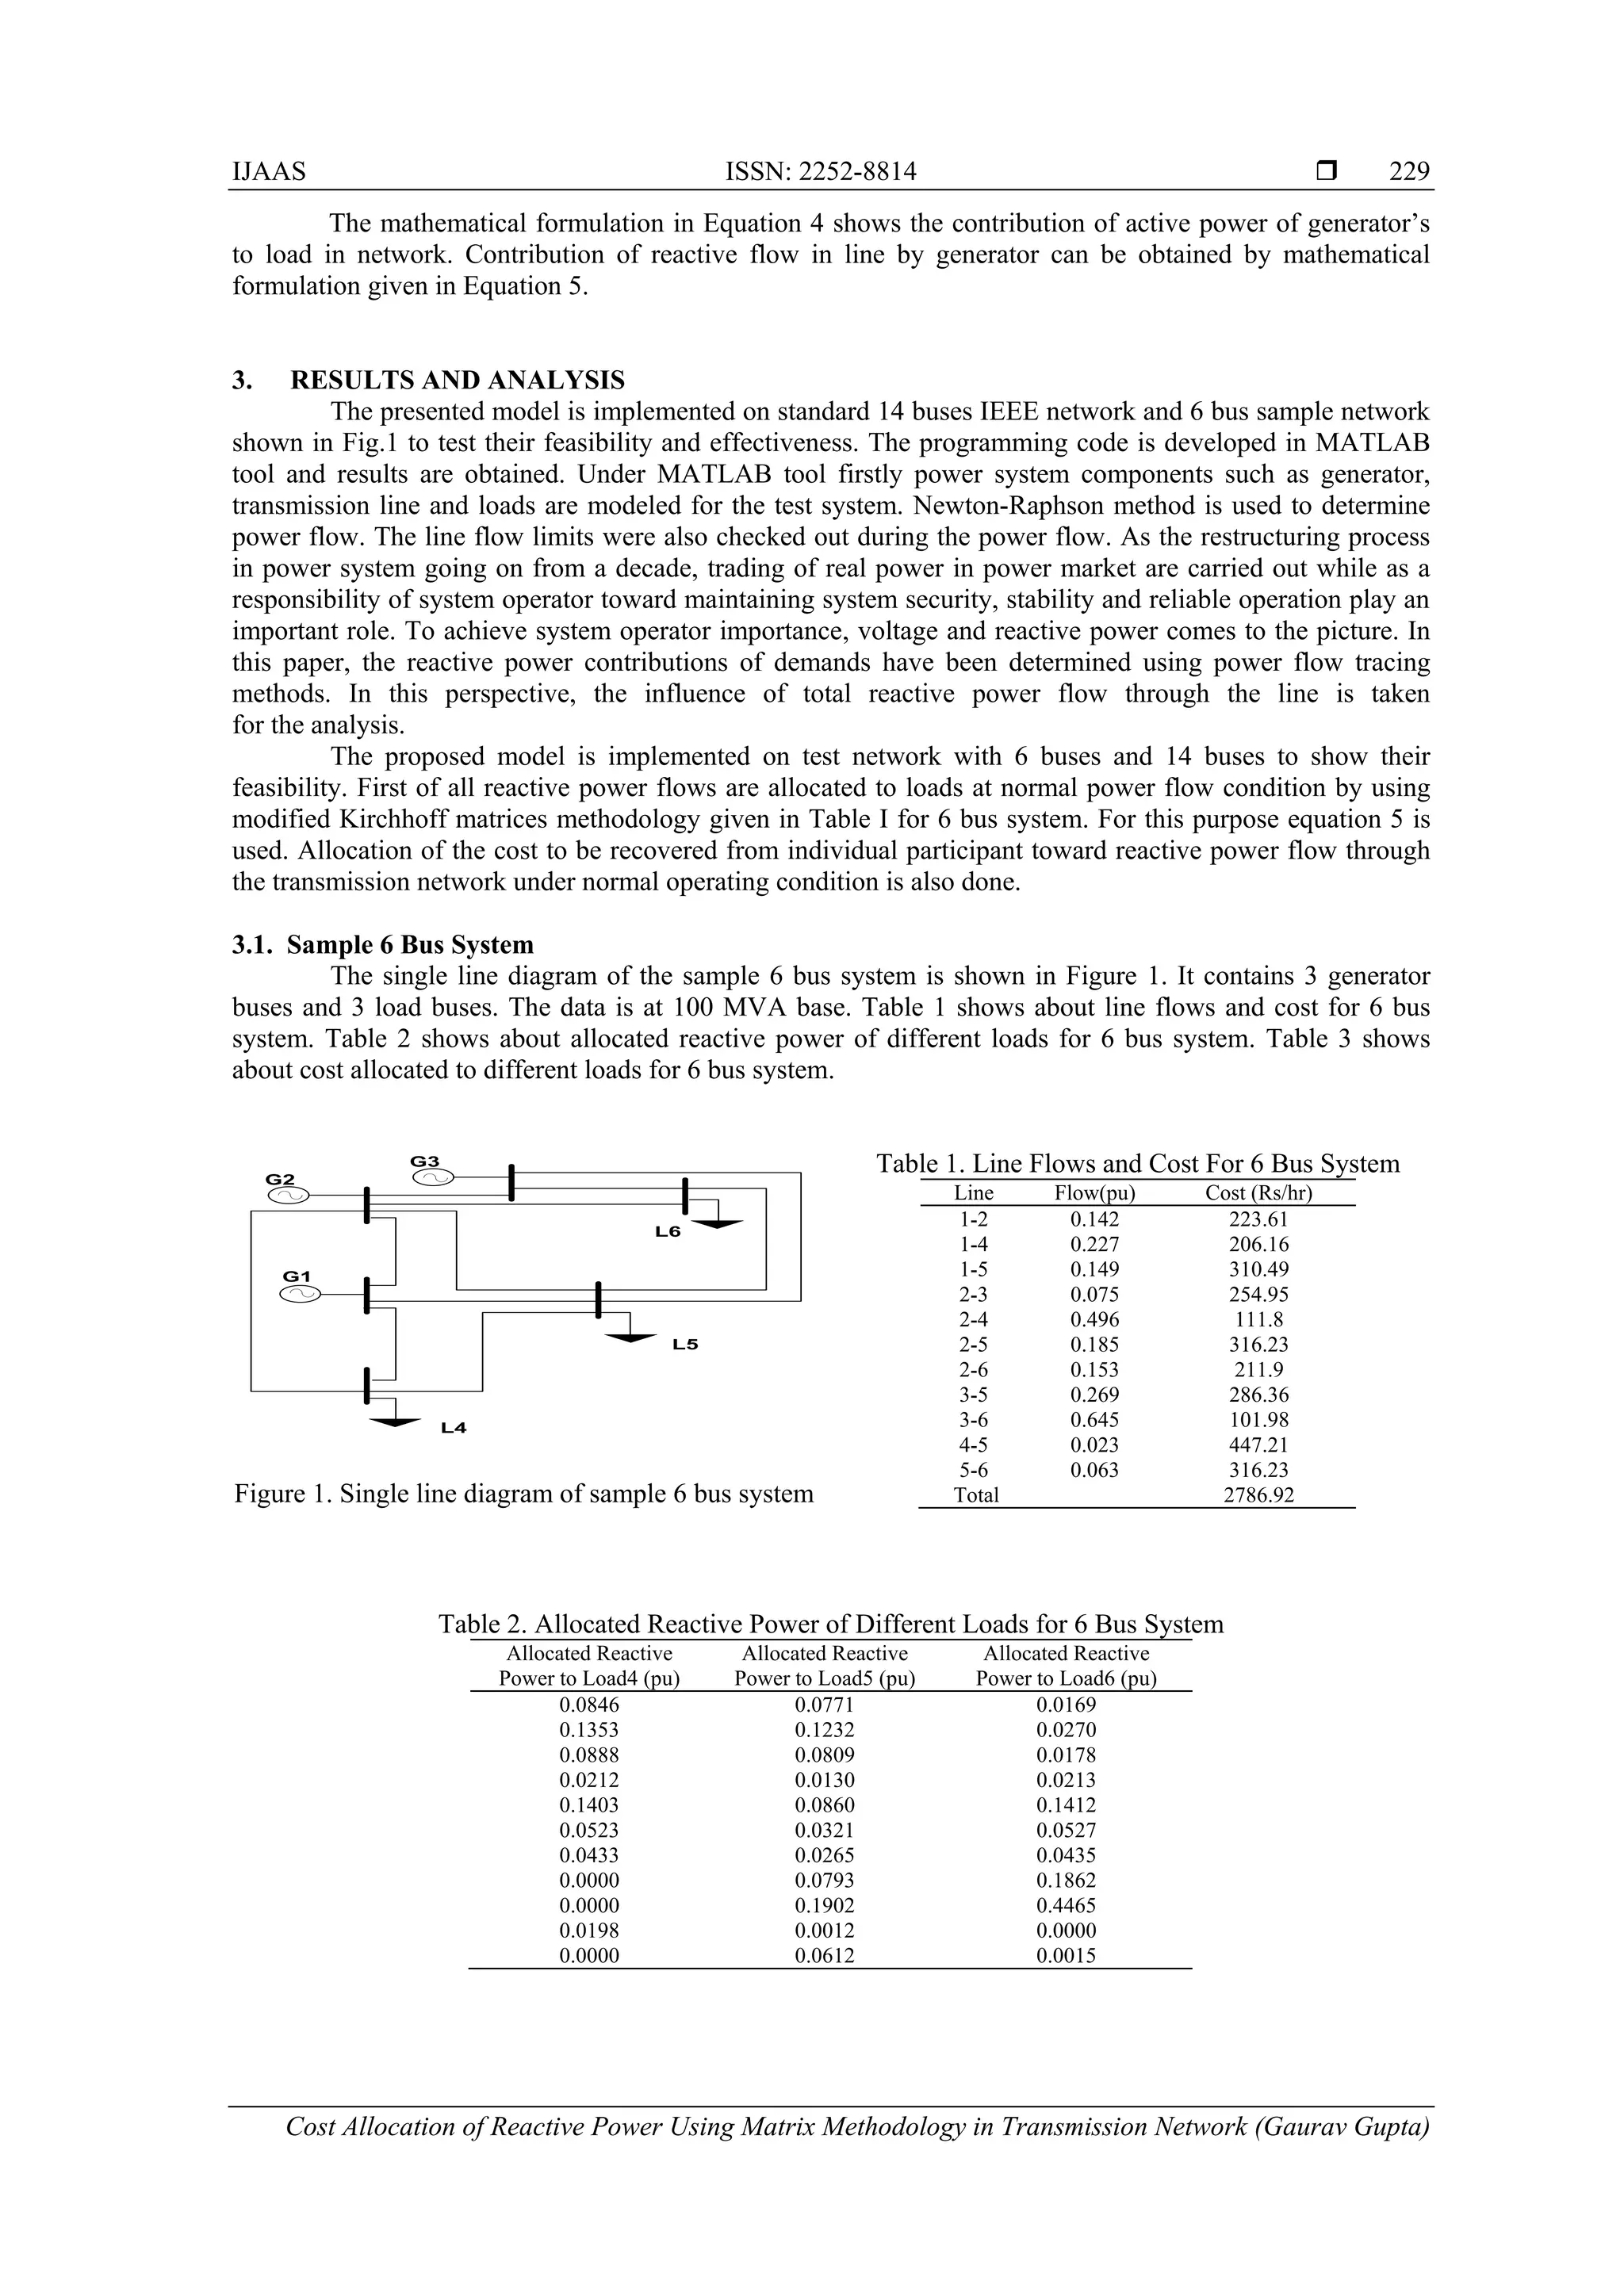
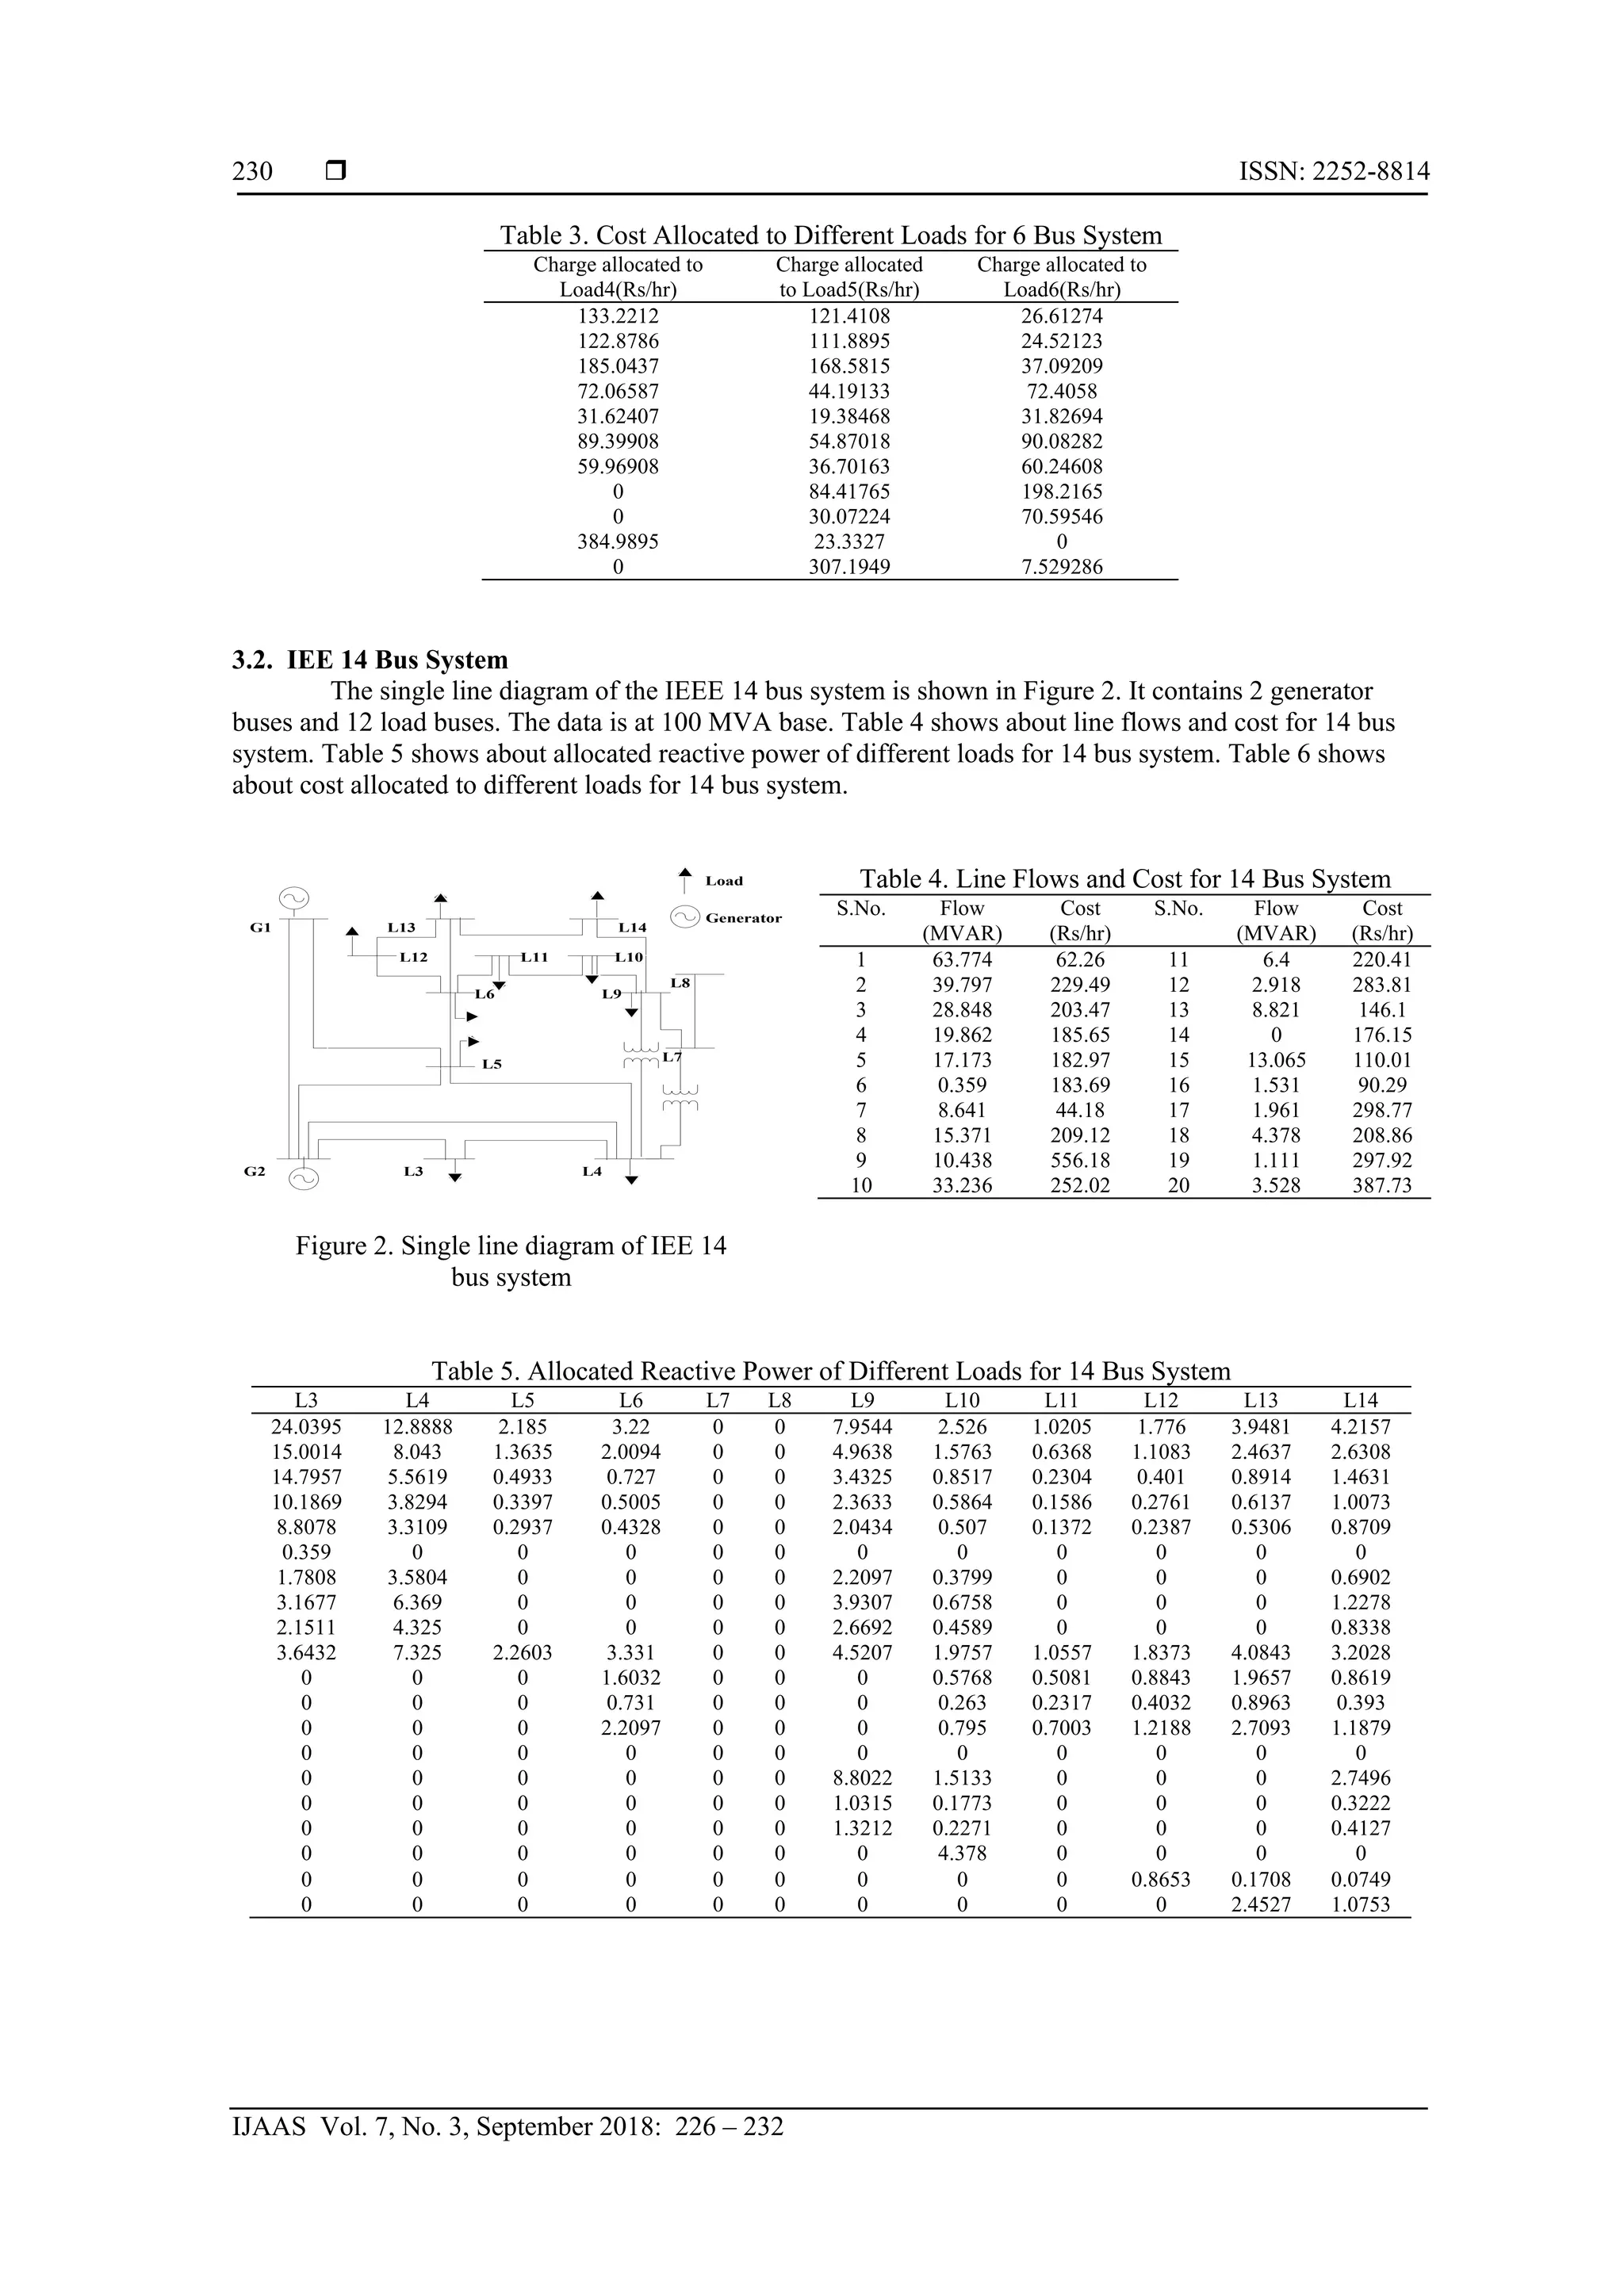
2. DEVELOPED METHODOLOGY
2.1. Model for Reactive Power Flow Allocation
The electrical power system network consists with different component so their behaviors towards
tracing of power flow become topological, so power flow by tracing theory is based on true flows in
transmission system with consideration of proportional sharing principle. It handles the common issue
regarding distribution of VAR (reactive power) flows in a meshed system [12-14]. To determine electricity at
the nodes, the nodal power flow based on tracing which generally use implementation of the KCL
(Kirchhoff’s current law).
To determine the correlation in conjunction with incoming and outgoing flows the proportional
sharing and nodal method is adopt. Hence this principle is similar for the validation of true power and
reactive power flows. The model proposed and implemented in this paper considered network is as
lossless [15], [16].
Let ln = 1. . . . . . . . e shows entire transmission line in the power system structured, Gn = 1. . . . . . . . g is
entire quantity of generating units and D = 1. . . . . . d is the entire quantity of users in the structure. Again
PGG = diag (PG1, PG2, … . , PGg ) represents generation in diagonal matrix. Thus from [16]
U = Km
−1
PL (1)
UT
PGG = (PG)T
or PG = PGGU (2)
By combining equation (1) and (2)
PG = PGGKm
−1
PL (3)
Obtained matrix PGGKm
−1
is called generation production matrix. The generation production matrix is
indicated by GPM = �tij�, i. e., Where,
GPM = PGGKm
−1
(4)
Ri→j = tijRLj (5)
Here tijRLj represent the reactive flow contribution of generator situated at bus 𝑖 to the load at bus j.](https://image.slidesharecdn.com/04-201022222528/75/Cost-Allocation-of-Reactive-Power-Using-Matrix-Methodology-in-Transmission-Network-2-2048.jpg)
![ ISSN: 2252-8814
IJAAS Vol. 7, No. 3, September 2018: 226 – 232
228
Reactive power allocated to generator placed at bus 𝑖 share the line s − b can be calculated by,
RPi→s−b = tisrfs−b (6)
To obtaining the contribution of reactive power by loads similar procedure is repeat.
Where the diagonal matrix PLL = diag (PL1, PL2, … . . , PLd) and EFM = PLL(Km
−1
)T
is the extraction factor
matrix of loads to generators [16].
2.2. Cost Allocation Model for Reactive Flows
For allocation of reactive power cost following algorithm is developed. For this purpose MVAr-mile
method is used. In this model, reactive power charge is allocated with respect to the reactive power base
capacity of the transmission line.
If the cost of the line is denoted as TCs−b (in Rs/hr) then Reactive power cost allocated to users is given by:
For generator 𝐺𝑖 full transmission usage cost allocation is given by, FTRCs−b
Gi
FTRCs−b
Gi
=
RPi→s−b
rf base s−b
× TCs−b (7)
Total transmission Reactive power cost by TRCf
Gi allocated to generator 𝐺𝑖 is given by:
TRCf
Gi = ∑ FTRCln
Gie
ln=1 (8)
Similarly for Load Lh full transmission usage cost allocation is given by, FTUCs−b
Lh
FTRCs−b
Lh
=
RPj→s−b
rf base s−b
× TCs−b (9)
Total transmission Usage cost TRCf
Lh allocated to Load Lh
TRCf
Lh = ∑ FTRCln
Lhe
ln=1 (10)
2.3. Partial Recovery Model
Partial recovery model provide cost recovery with respect to rated reactive power capacity of
transmission line.
If the cost of the line is denoted as TCs−b (in Rs/hr) then reactive power cost allocated to users is
given by:
For generator Gi, partial transmission usage cost allocation is given by PTRCs−b
Gi
PTRCs−b
Gi
=
RPi→s−b
rfrcap s−b
× TCs−b (11)
Total transmission reactive power cost by partial recovery model TRCp
Gi allocated to generator Gi
TRCp
Gi = ∑ PTRCln
Gie
ln=1 (12)
Similarly for load Lh, partial transmission reactive power cost allocation is given byPTRCs−b
Lh
PTRCs−b
Lh
=
RPj→s−b
rfrcap s−b
× TCs−b (13)
Total transmission reactive power cost TRCp
Lh allocated to load Lh
TRCp
Lh = ∑ PTRCln
Lhe
ln=1 (14)](https://image.slidesharecdn.com/04-201022222528/75/Cost-Allocation-of-Reactive-Power-Using-Matrix-Methodology-in-Transmission-Network-3-2048.jpg)
![IJAAS ISSN: 2252-8814
Cost Allocation of Reactive Power Using Matrix Methodology in Transmission Network (Gaurav Gupta)
231
Table 6. Cost Allocated to Different Loads for 14 Bus System
L3 L4 L5 L6 L7 L8 L9 L10 L11 L12 L13 L14
23.468 12.582 2.133 3.143 0 0 7.765 2.466 0.996 1.733 3.854 4.115
86.505 46.380 7.862 11.587 0 0 28.623 9.089 3.672 6.391 14.206 15.170
104.356 39.229 3.479 5.127 0 0 24.210 6.007 1.625 2.828 6.287 10.319
95.216 35.793 3.175 4.678 0 0 22.089 5.481 1.482 2.580 5.736 9.415
93.842
35.27603
639
3.12923
1293
4.611274
442
0 0
21.7714
3761
5.40183
9516
1.4617
99569
2.54323
2924
5.65328
6089
9.27901
7819
183.69 0 0 0 0 0 0 0 0 0 0 0
9.104 18.305 0 0 0 0 11.297 1.942 0 0 0 3.528
43.096 86.649 0 0 0 0 53.476 9.194 0 0 0 16.704
114.619 230.453 0 0 0 0 142.226 24.452 0 0 0 44.4283
27.625 55.543 17.139 25.258 0 0 34.279 14.981 8.005 13.931 30.970 24.286
0 0 0 55.212 0 0 0 19.864 17.498 30.454 67.696 29.683
0 0 0 71.098 0 0 0 25.579 22.535 39.215 87.175 38.223
0 0 0 36.598 0 0 0 13.167 11.598 20.186 44.873 19.674
0 0 0 0 0 0 0 0 0 0 0 0
0 0 0 0 0 0 74.116 12.742 0 0 0 23.152
0 0 0 0 0 0 60.832 10.456 0 0 0 19.001
0 0 0 0 0 0 201.292 34.600 0 0 0
62.8772
9679
0 0 0 0 0 0 0 208.86 0 0 0 0
0 0 0 0 0 0 0 0 0 232.034 45.800 20.084
0 0 0 0 0 0 0 0 0 0 269.553 118.176
In Opportunity cost method the total cost of reactive power including capacitor cost is 7.31 $/hr or
467.84 Rs/hr and in case of Triangle method total cost of reactive power including capacitor cost is 267 $/hr
or 16020 Rs/hr reported in [20] while the total cost allocated obtained from proposed model as shown in
Table VI for IEEE 14 bus system is 69.21$/hr or 4152.94 Rs/ hr which is more acceptable to attract the
investor in deregulated power market as compared to Opportunity cost method and Triangle method.
4. CONCLUSION
The main objective of the model proposed in this paper is to allocate reactive power for each load
based upon the proportion of reactive power flow through the transmission line as per demand by the load.
The reactive power flow tracing is done by constructing reactive power flow matrix.
The main reason behind the reactive power flow is the inductive loading at the load end; hence by
using MVAr-Mile method the cost of this reactive power flowing is allocated to loads. Power system
network is very large so this need to have additional information regarding reactive power injected by
different sources as well as shunt admittance of the transmission line, the tracing of power flow scheme
becomes as effective tool to achieve that. For reliable and stable operation of power system the reactive
power economics play a vital role. By allocating the reactive power flow cost by proposed model, total
embedded cost associated with the transmission line can be recovered and the size of reactive power sources
installations such as capacitor bank, SVC and FACTS devices can be easily done.
REFERENCES
[1] Abdorreza Rabiee, Haidor Alishayanfer, Nibamjady Iee, Power And Enginering Magazine pp.18-32
January/February 2009.
[2] Peter W. Sauer. What is Reactive power? Power systems Engineering Research Center, Department of Electrical
and Computer Engineering , university of Illinois at Urbana- Champaign, September 16,2003.
[3] Harinder Pal Singh, Yadwinder Singh Brar, D. P. Kothari, “Combined Active and Reactive Power Dispatch Using
Particle Swarm Optimization”, Proceedings of Informing Science & IT Education Conference (InSITE) 2014.
[4] Wood, A.J., and Wollenberg, B.F., “ Power generation, operation, and control ”, (Wiley, New York, 1996, 2nd
Edn.).
[5] Ferdinand Gubina, David Grgic, Ivo Bani, “ Method for Determining the Generators Share in a Consumer Load ”,
IEEE Transactions on Power Systems, vol. 15, no. 4, November 2000.
[6] Y. Dai, X.D. Liu, Y.X. Ni, F.S. Wen, Z.X. Han, C.M. Shen, Felix F. Wu, “ A cost allocation method for reactive
power service based on power flow tracing ” , Electric Power Systems Research, vol.64 , pp.59-65, 2003.
[7] D. Thukaram C. Vyjayanthi, “Relative electrical distance concept for evaluation of network reactive power and loss
contributions in a deregulated system:, IET Gener. Transm. Distrib., vol. 3, no.11, pp. 1000–1019, 2009.
[8] Seyed Mohammad Hossein Nabavi, Somayeh Hajforoosh, Sajad Hajforosh, Nazanin Alsadat Hosseinipoor, “ Using
Tracing Method for Calculation and Allocation of Reactive Power Cost ”, International Journal of Computer
Applications , vol. 13, no. 2, pp.14-17, 2011.](https://image.slidesharecdn.com/04-201022222528/75/Cost-Allocation-of-Reactive-Power-Using-Matrix-Methodology-in-Transmission-Network-6-2048.jpg)
![ ISSN: 2252-8814
IJAAS Vol. 7, No. 3, September 2018: 226 – 232
232
[9] Hussain Shareef, Mohd. Wazir Mustafa, Saifulnizam Abd Khalid, Azhar Khairuddin, Akhtar Kalam, Amanullah
Maung Than Oo, “Real and Reactive Power Transfer Allocation Utilizing Modified Nodal Equations” International
Journal of Emerging Electric Power Systems, vol. 9, no. 6, article 4, 2008
[10] Hermagasantos Zein, Erwin Dermawan “Cost Allocation of Transmission Losses in Electric Market Mechanism”
TELKOMNIKA, vol.10, no.2, , pp. 211-218, June 2012.
[11] Hogan, W , “ Markets in Real Electric Networks Require Reactive Prices ”, The Energy Journal, vol.14, no.3
pp.171-200, 1993.
[12] J. W. Lamont and J. Fu, “ Cost analysis of reactive power support ”, IEEE Transactions on Power Systems, vol.
14, no. 3, pp. 890–898, Aug. 1999.
[13] Baughman, M. L. and Siddiqi , S. N. , "Real Time Pricing of Reactive Power: Theory and Case Study Results",
IEEE Trans. on Power Systems,vol. 6, no.1, pp. 23-29, 1991.
[14] Schweppe, F. C., M. C. Caramanis, R. D. Tabors, and R. E. Bohn , Spot Pricing of Electricity, Kluwer Academic
Publishers, Boston. 1998
[15] Bialek J.W., Kattuman P.A.,“ Proportional sharing assumption in tracing methodology”, IEE Proceedings
Generation transmission Distribution, vol.151, no.4, pp.526-532, July 2004.
[16] Kaigui Xie, Jiaqi Zhou, Wenyuan Li “ Analytical model and algorithm for tracing active power flow based on
extended incidence matrix ”, Electric Power Systems Research, vol.79, pp. 399–405, 2009
[17] Enshaee A., Enshaee P., “ New reactive power flow tracing and loss allocation algorithm for grids using matrix
calculation ” Electric Power and Energy System, vol.87,pp.89-98,2017
[18] S.K. Gupta, R.Bansal, Partibha Sharma, Mukesh Saini “Power Trading and Congestion Management through Real
Power Rescheduling Using Unified Power Flow Controller”, Indonesian Journal of Electrical Engineering and
Informatics, vol. 2, no. 4, pp. 151-160, December 2014.
[19] Sawan Sen, Priyanka Roy, Abhijit Chakrabarti, Samarjit Sengupta “ Generator Contribution Based Congestion
Management using Multiobjective Genetic Algorithm ”, TELKOMNIKA, vol.9, no.1, pp. 1-8, April 2011
[20] Abbas Ketabi , Ahmad Alibabaee , R. Feuillet “ Application of the ant colony search algorithm to reactive power
pricing in an open electricity market ”, Electrical Power and Energy Systems, vol.32, pp.622-628, 2010.](https://image.slidesharecdn.com/04-201022222528/75/Cost-Allocation-of-Reactive-Power-Using-Matrix-Methodology-in-Transmission-Network-7-2048.jpg)