Downloaded 23 times
![Proceedings of Indian Geotechnical Conference
December 15-17,2011, Kochi (Paper No. A-350)
CORRELATION BETWEEN CBR AND INDEX PROPERTIES OF SOIL
T.Datta, Assistant Prof., C.E.Dept.,Meghnad Saha Institute of Technology,Kolkata,E-mail: meettufan@yahoo.co.in
B.C.Chottopadhyay, Prof., C.E.Dept, Meghnad Saha Institute of Technology, Kolkata, E-mail : ccbikash@yahoo.com
ABSTRACT: Value of CBR is often required for geotechnical solutions of engineering road structures. For area
development projects using fillings requires placement of such fillings in proper order for high strength and low
compressibility. Huge quantity of filling material is used for construction of sub grade and CBR value for all such fills is
very important parameter and need to be assessed. But due to high cost and time requirement for such testing it generally
becomes difficult to map the variation in their value along the alignment. Correlations of CBR from different index
properties have been made by different researchers. However the validity and applicability of such correlation need to be
established for their acceptances in general practice. The predicted and tested values of CBR of various soils have been
used to check the applicability and limitations of available methods and are presented in this paper.
INTRODUCTION
Large scale road constructions are taking place over the
length and breadth of India due to adoption of highly
intensified activities in road construction like Pradhan
Mantri Gram Sadak Yojana (PMGSY) and Golden
Quadrilateral Project etc. Almost the entire road network
consists of flexible pavements. For the design of flexible
pavement, CBR value is one of the important parameters.
Flexible pavement design in India was standardized in 1970
by the IRC which gives design curves from which the
thickness of different pavement layers for a given traffic
load and CBR value can be found. For the design of
flexible pavement, throughout the whole road, soil samples
at a certain distance are taken for the determination of CBR
value of soil sub grade. On the basis of these result, the
whole road is designed. However values obtained from tests
on soil samples collected from limited numbers of location
cannot be the representative value of the whole road.
Because throughout the road, such soils may have large
variations in their engineering properties due to variety of
reasons. So it is always difficult for transportation engineers
to obtain representative CBR values for use in design of
flexible pavement. This can be avoided only if large
numbers of soil samples are taken at a very short interval
throughout the road and consequently the number of CBR
tests will be large. CBR value can be measured directly in
the laboratory in accordance with IS 2720 part 16 on soil
samples acquired from site. Laboratory test takes at least
four days to measure the CBR value for each soil sample.
Though the procedure for evaluation of CBR is simple but
it is time consuming and costly because of the laborious
laboratory work involved. This would result in serious
delay in the progress of the project since in most situations
the materials for earthwork construction come from highly
variable sources. Any delay in the construction inevitably
leads to escalation of project cost. So it is not really
possible to take large numbers of samples. Not only for
design but after construction at the time of checking quality
also it may become very problematic. Since in the present
scenario quality control becomes very important, so during
and after construction to check the quality of the prepared
sub grade by comparing the in-situ value of CBR of
constructed sub grade and design value of CBR , a huge
time is necessary. But practically it is impossible to put
enormous time into this aspect. So for proper design, time
and cost point of view it is very much essential to correlate
CBR of soils with easily determinable parameters. Some
correlations have been presented in this field in recent
period but reliability of these methods needs substantial
verifications. In this paper attempt has been made to check
the efficacy of the suggested correlations with tested values
to suggest a proper method and correlation in practice.
AVAILABLE CORRELATIONS:
Attempts have been made by several research workers to
develop suitable correlation between CBR value of
compacted soils at Optimum Moisture Content (OMC) and
result of some simple field tests [Venkatraman et. el (1995),
Kumar et. el. (2000) , Karunaprema and Edirisinghe
(2002)] or different simple soil characteristics . In this
section some of the available correlation between CBR
value and simple soil properties are described.
(a) Correlations based on Liquid Limit and Gradation
Vinod and Cletus (2008) correlated the value of CBR with
Liquid Limit(LL) and gradation characteristics of soils.
Based on result of experimental study on lateritic soils they
suggested a correlation
CBR = - 0.889 (WLM) + 45.616 .........................(1)
Where WLM is modified Liquid Limit and is given by
WLM = LL (1 - C/100) ................................(2)
Where LL is Liquid Limit on soil passing 425 micron sieve
(in percent) and C is fraction of soil coarser than 425
micron (percent)
131](https://image.slidesharecdn.com/correlationbetweencbrandindexpropertysofsoil-150812071707-lva1-app6892/75/Correlation-between-cbr-and-index-propertys-of-soil-1-2048.jpg)
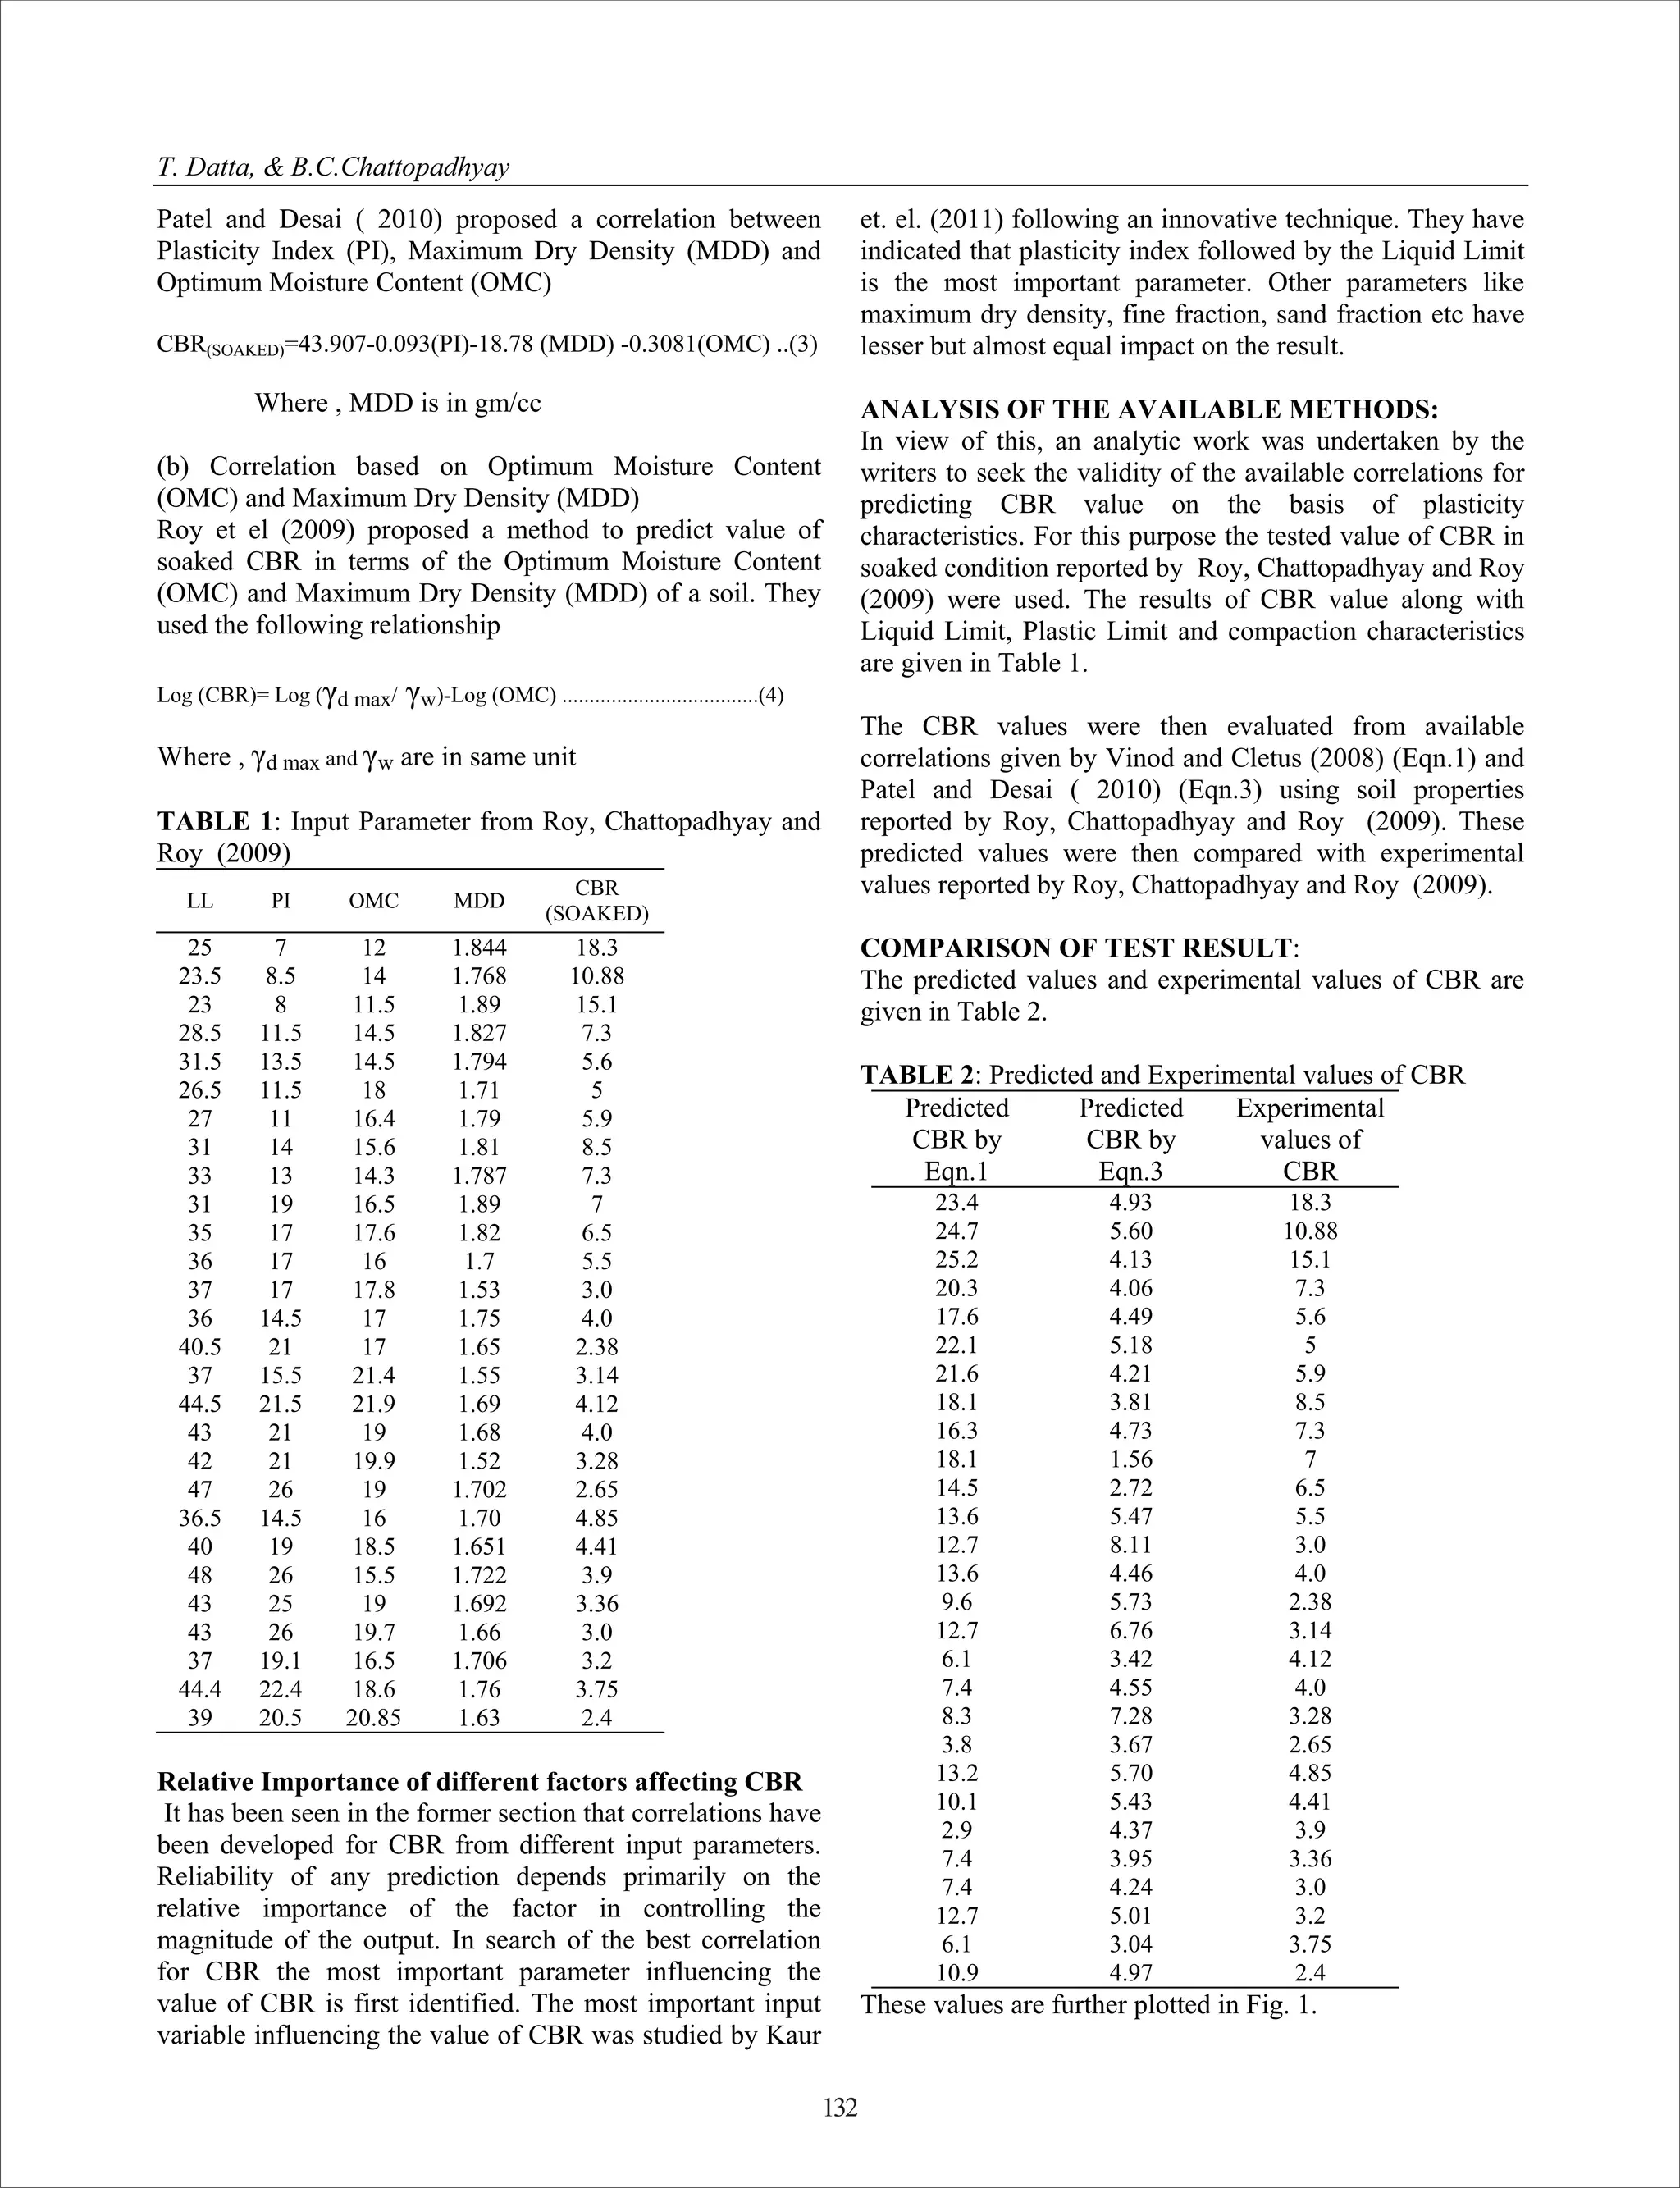

This document discusses correlations between the California Bearing Ratio (CBR) and index properties of soil. It examines several existing correlations between CBR and properties like liquid limit, plastic limit, and maximum dry density. The authors analyze data from previous studies to compare predicted CBR values from two correlations to experimentally measured CBR values. They find that one correlation works better for clayey soils but overestimates CBR for highly plastic clays, while the other correlation predicts lower CBR values than measured across soil types. The authors conclude that the correlations show some agreement with tests for low plasticity clays but need improvement to reliably predict CBR from simple soil properties.


