Download to read offline
![International Research Journal of Engineering and Technology (IRJET) e-ISSN: 2395-0056
Volume: 06 Issue: 04 | Apr 2019 www.irjet.net p-ISSN: 2395-0072
© 2019, IRJET | Impact Factor value: 7.211 | ISO 9001:2008 Certified Journal | Page 4030
2. METHODOLOGY
The main objective of this project is to developa correlation
between CBRs values and the basic index properties of the
soil. To achieve the objectives of the research study, soil
samples of varying geotechnical characteristics were
collected from different parts of Ernakulam. Total 5 number
of samples were collected from different project sites.
SIEVE ANALYSIS
↓
ATTERBERG’S LIMIT TEST
↓
STANDARD PROCTOR TEST
↓
CBR (soaked) TEST
2.1 PROCEDURE ADOPTED
Based on the test results from the soil tests different
relationships will be established between CBR soakedvalue,
OMC, MDD, Liquid limit and plastic limit
All the soil samples will be tested as per ASTM standards
[xix-xxii]. The samples of soilsaretestedforestablishmentof
correlations.
Table -1: Criteria Of Pellinen
Criteria
R2
Excellent >0.9
Good
0.7-0.86
Fair
0.4-0.67
Poor
0.2-0.39
Very Poor
<0.2
The strength of these relationships will be checked basedon
the (R2 value) criteria proposed by pellinen. (table 1.1). The
low R2 value indicates high scatters inthedata andvery poor
strength in he relationship and vice versa.
A multiple regression analysis will be then trying to find an
equation satisfying the test results and the goodness of fit
statistics will be checked accordingtotheconceptual criteria
proposed by pellinen. Multiple Linear regression estimates
the coefficients of the equation. To check the validity of
developed correlations (separately for fine and coarse),
experimental values of CBRs is plotted against predicted
values of CBRs (using developed equations). Percentage
error from 45degree line (equality line) will be calculated.
Validity of the correlations from literature is also checked
and compared with the models developed in the present
study.
3. TEST RESULTS
All the 5 soil samples were tested as per ASTM standards.
Sieve analysis of the soil samples showed that soil samples
can be classified as fine grained and coarse grained soil
samples. Among these soil samples percentageofgravel was
ranging from 15-38%, sand 7-17% and fines 0.45-5%.
Atterberg’s limit test results of the soil samples showed that
liquid limit is in a range of 24-32%, the plastic limit is in the
range of 16-28%, and plasticity index is in the range of 1.9-
9.9%. soil samples were classifiedasperUSCS.Sampleswere
classified as well graded sand, poorly graded gravel sand,
gap graded silt sand, gap graded clayeygravel withsandand
low plasticity lean clay soil. From standard proctor test
results it was observed thattheoptimummoisturecontentis
in the range of 16-22% and maximum dry density in a range
of 1.62-2.55. Soaked CBR value was found ranging between
4-7.5%.
4. ANALYSIS PROCEDURE
4.1 DEVELOPMENT OF PREDICTION MODELS
To fulfill the objectives of the study, the results out of
laboratory experiments carried out were studied and were
analyzed statistically. To build up a relation between CBR
value and Index properties, regression models are used
through Microsoft Excel software. In this study regression
models were developed for estimating CBR value interms of
index properties. In the regression analysis the exact nature
and form of mathematical equation is obtained and the
regression coefficient is used for prediction.](https://image.slidesharecdn.com/irjet-v6i41231-190731063338/75/IRJET-Prediction-of-Cbr-Value-from-Index-Properties-Of-Soil-2-2048.jpg)
![International Research Journal of Engineering and Technology (IRJET) e-ISSN: 2395-0056
Volume: 06 Issue: 04 | Apr 2019 www.irjet.net p-ISSN: 2395-0072
© 2019, IRJET | Impact Factor value: 7.211 | ISO 9001:2008 Certified Journal | Page 4032
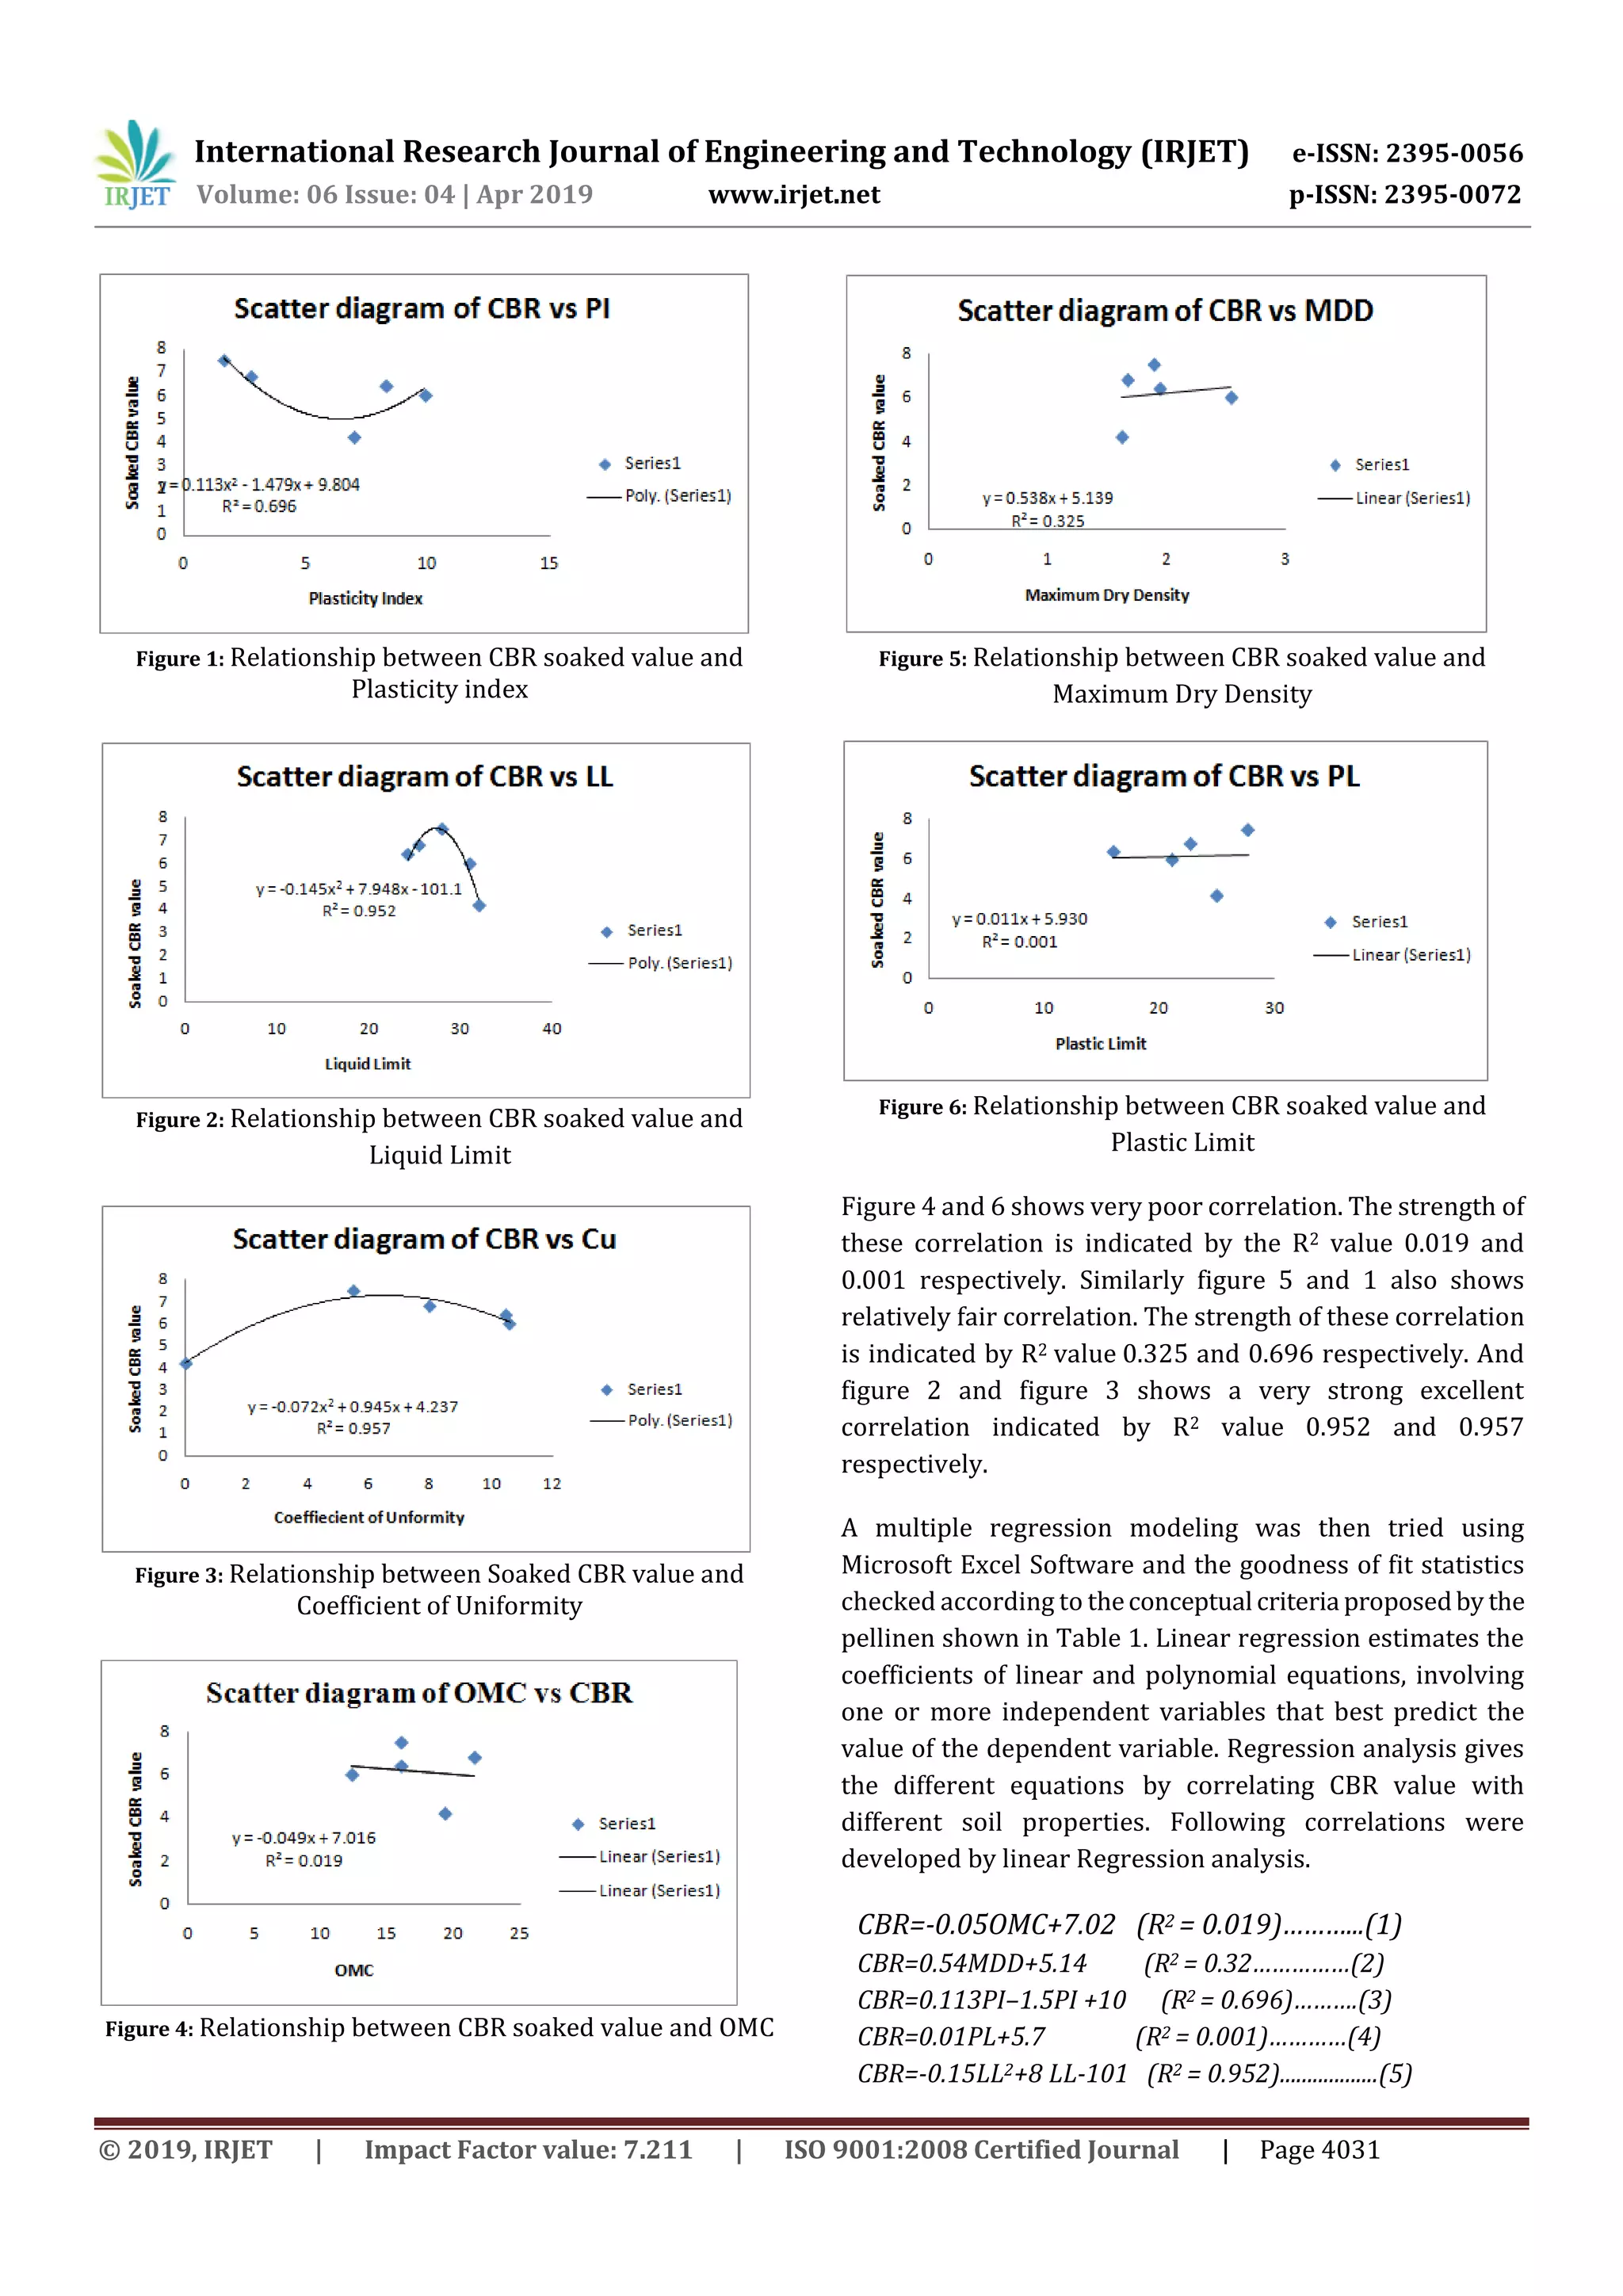
CBR=-0.07Cu2+0.95Cu+4.2 (R2= 0.957)……….......(6)
CBR=2.6MDD–0.4PI+3.3 (R2=0.69)………….(7)
Since the regression coefficient is very low and the strength
of the correlation is very poor (eq1 & 4) it is easytoconclude
that the variation in the index properties namely OMC and
PL have no much influence on CBR Value. And hence the
equation (1) and (4) is omitted.
In multiple regression analysis, hence the index properties
considered are only MDD, PI, LL, and Cu. And the equation
obtained is,
CBR=4MDD–0.3PI–0.4L–0.15Cu+11 (R2 =1)…...(8)
Where CBR is the Soaked California Bearing Ratio value (%)
MDD is Maximum dry density (g/cc), PI is Plasticity Index
(%), PL is Plastic Limit (%), LL is the Liquid Limit (%), Cu is
the Coefficient of Uniformity
5. VALIDITY OF DEVELOPED MODELS
Validity of developed models are checked by plotting
Experimental values of CBR against Predicted value of these
CBR by developed equations. Percentage error from the
equality line can be calculated by given formula,
Percentage error = ……………(9)
Where, A1 = Actual value, P1 = Predicted value, n = Number of
values
Predictive model R2
Percentage Error
-0.07Cu2
+0.95Cu+4.2 0.957 ±2.2%
-0.15LL2
+8LL-101 0.952 ±6%
4MDD–0.3PI–0.4LI–
0.15Cu+11
1 ±3%
2.6MDD-0.4PI+3.3 0.69 ±2%
VALIDITY CHECKING
Validity of correlation from the literature review is also
checked for the same set of samples and compared with the
models developed in the present study. Based on the
percentage error found, it is easy to arrive at a predictive
model for determining the soaked CBR value using index
properties.
Figure 7: Validity Checking of equation 8
Because of the involvement of more than one variable in the
predictive models the accuratepredictionofthevaluesof the
soaked CBR becomes generally difficult. However, the
predictive model presented in the present study are simple
and can be effectively used for the prediction of the soaked
CBR values with reasonable accuracy.
CONCLUSION
A number of soil samples were collectedfromdifferentparts
of Ernakulam District, Kerala to develop predictive models
for locally available soils. These models are proposed after
checking their strength based on R2 value and validity on
real scale data. Simplified predictive curves are also
presented to determine the soaked CBR value for soils from
linear/polynomial multiple regression models proposed in
the present study. Soaked California bearing ratio is a
function of maximum dry density, liquid limit, coefficient of
uniformity and plasticity index.
From the greatest R2 Value and least percentage error, it is
clear that a strong correlation exist in the equation (8),
hence the valid prediction model is,
CBR=4MDD–0.3PI–0.4LL–0.15Cu +11
Models presented in the present study can be used to an
extend, for the preliminary prediction of soaked CBR value
for locally available soils of Ernakulam.However, such
models can’t be the replacement of actual tests.
REFERENCES
[1] W.P.M. Black. “A Method of estimating the CBR of
cohesive soils from plasticity Data”, Geotechnique.Vol.12,
271 – 271, 1962.
[2] K. B. Agarwal , K. D. Ghanekar. “Prediction of CBR values
from plasticity characteristics of soil”.](https://image.slidesharecdn.com/irjet-v6i41231-190731063338/75/IRJET-Prediction-of-Cbr-Value-from-Index-Properties-Of-Soil-4-2048.jpg)
![International Research Journal of Engineering and Technology (IRJET) e-ISSN: 2395-0056
Volume: 06 Issue: 04 | Apr 2019 www.irjet.net p-ISSN: 2395-0072
© 2019, IRJET | Impact Factor value: 7.211 | ISO 9001:2008 Certified Journal | Page 4033
[3] B. Yildirim, O. Gunaydin. “Estimation of CBR by soft
computing systems”. Expert systems with Applications,
Elsevier, 38, 6381 – 6391, 2011
[4] S. A. Nugroho, and R. N. Sri.”Canadian Journal on
Environmental”, Construction and Engineering Vol. 3, No.1,
January 2012.
[5] Dr. K.R. Arora, “Soil mechanics and Foundation
Engineering”, Standard Publishers Distributors.
[6] IS 2720 Part 4 (1975) Grain Analysis
[7] IS 2720 Part 5 (1970) Determination of Liquid Limit and
Plastic Limit.
[8] IS 2720 Part 6 (1974) Determination of Dry Density and
Optimum Moisture Content.
[9] IS 2720 Part 16 (1979) Determination of California
Bearing Ratio.
[10] Prediction of CBR from index properties, Available at
https://www.researchgate.net.](https://image.slidesharecdn.com/irjet-v6i41231-190731063338/75/IRJET-Prediction-of-Cbr-Value-from-Index-Properties-Of-Soil-5-2048.jpg)

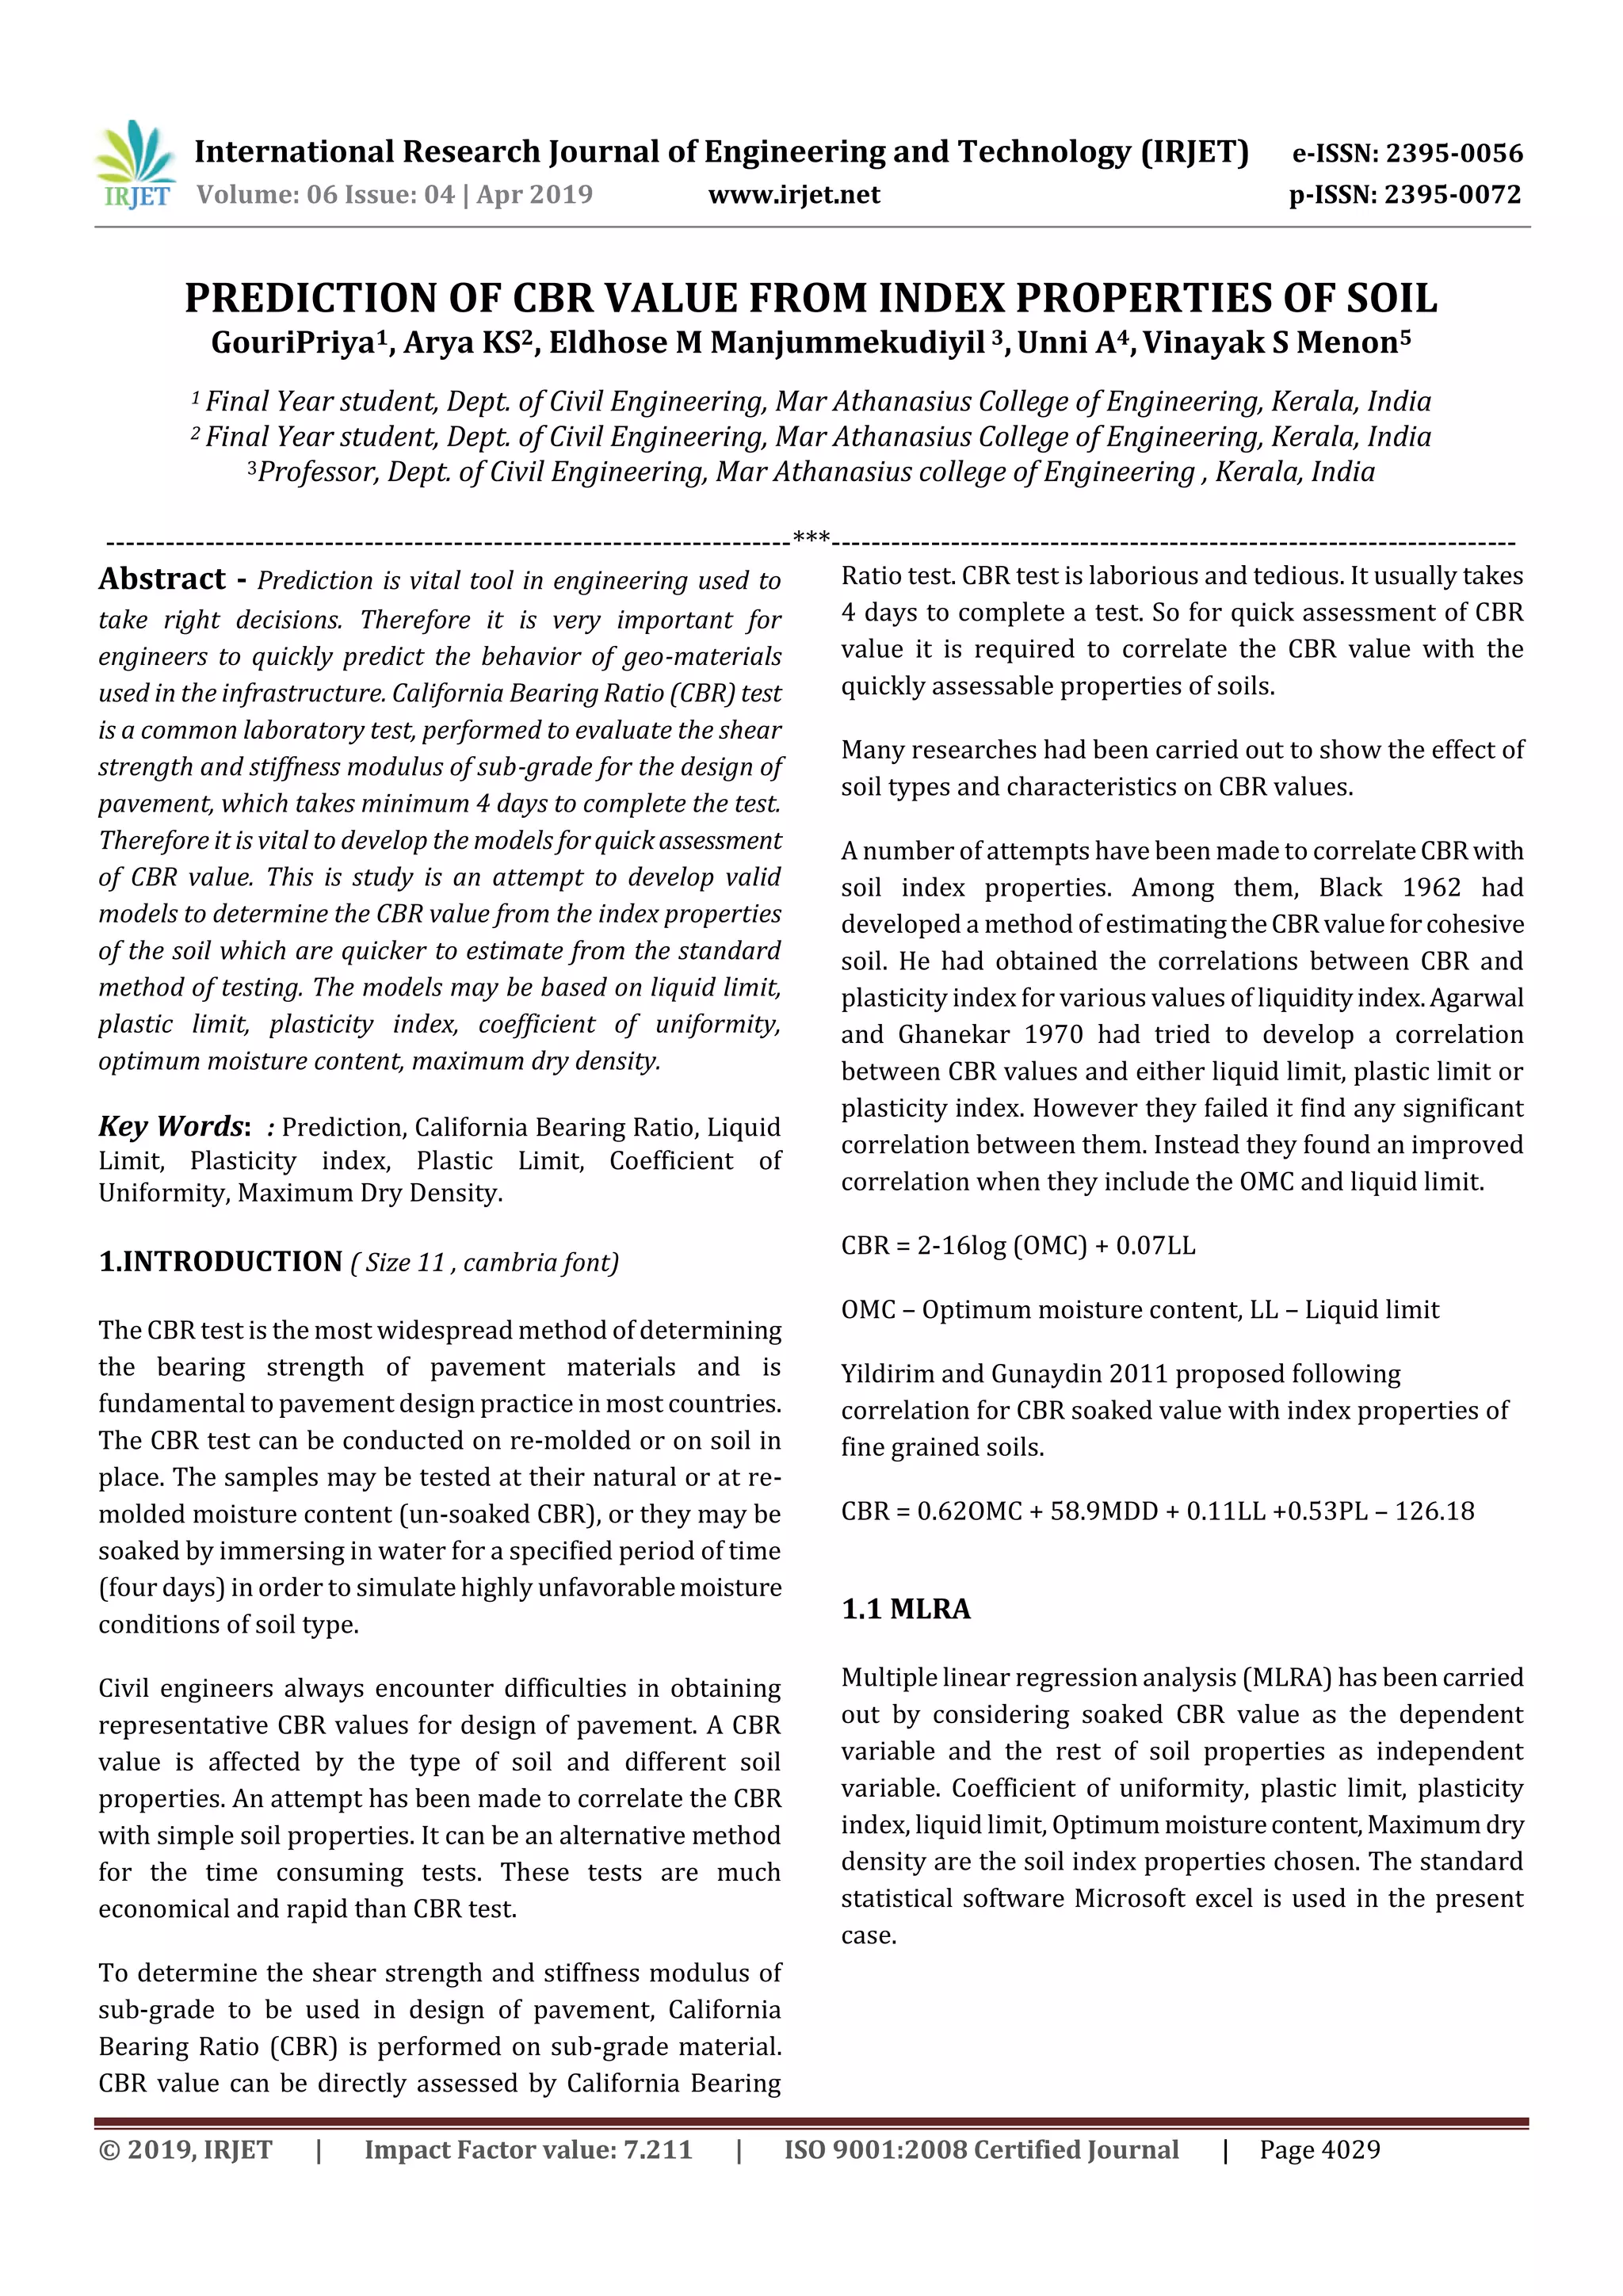
This document presents a study that aims to develop models for predicting the California Bearing Ratio (CBR) value of soil from index properties that are quicker to determine than the standard CBR test. The CBR test takes 4 days to complete but engineers need a quicker assessment of soil strength. The researchers collected soil samples and conducted tests like sieve analysis, Atterberg limits, standard Proctor, and CBR to determine properties like liquid limit, plastic limit, optimum moisture content, and maximum dry density. Correlations between CBR and individual properties showed varying strengths. Multiple linear regression analysis was then used to develop prediction models incorporating several properties. The models will help engineers assess soil strength more rapidly.


