An Association rulewill be strong if
Support(X->Y) >= Minimum Support and Confidence (X->Y) >= Minimum Confidence.
Correlation Analysis
It is used to study the closeness of the relationship between two or more variables i.e., the degree
to which the variables are associated with each other.
Methods of Correlation Analysis
1. Lift
2. X2
(Chi Square)
3. All Confidence
4. Cosine
Correlation Analysis using Lift
The Lift between the occurrence of A and B can be measured by computing
Lift (A, B) =
𝑃(𝐴𝑈𝐵)
𝑃(𝐴)∗𝑃(𝐵)
• If Lift < 1, then the occurrence of A is negatively correlated with the occurrence of B,
meaning that the occurrence of one likely leads to the absence of the other one.
• If Lift > 1, then the occurrence of A is positively correlated with the occurrence of B,
meaning that the occurrence of one implies to the occurrence of the other one.
• If Lift = = 1, then A and B are independent and there is no correlation between them.
Correlation Analysis using Χ2
Χ2
= ∑
[𝑂𝑏𝑠𝑒𝑟𝑣𝑒𝑑−𝐸𝑥𝑝𝑒𝑐𝑡𝑒𝑑]2
𝐸𝑥𝑝𝑒𝑐𝑡𝑒𝑑
Expected (i,j) =
𝑆𝑢𝑝(𝑖)∗𝑆𝑢𝑝(𝑗)
𝑁
• If Χ2
< 1, then the occurrence of A is negatively correlated with the occurrence of B,
meaning that the occurrence of one likely leads to the absence of the other one.
• If Χ2
> 1, then the occurrence of A is positively correlated with the occurrence of B,
meaning that the occurrence of one implies to the occurrence of the other one.
• If Χ2
= = 0, then A and B are independent and there is no correlation between them.
Correlation Analysis using All-Confidence
All-Confidence=
𝑆𝑢𝑝𝑝𝑜𝑟𝑡(𝐴𝑈𝐵)
𝑀𝑎𝑥−𝑆𝑢𝑝𝑝𝑜𝑟𝑡(𝐴)
• If All-Confidence < 0.5, then the occurrence of A is negatively correlated with the
occurrence of B, meaning that the occurrence of one likely leads to the absence of the other
one.
2.
• If All-Confidence> 0.5, then the occurrence of A is positively correlated with the
occurrence of B, meaning that the occurrence of one implies to the occurrence of the other
one.
• If All-Confidence = = 0.5, then A and B are independent and there is no correlation between
them.
Correlation Analysis using Cosine
Cosine=
𝑃(𝐴𝑈𝐵)
√𝑃(𝐴)∗𝑃(𝐵)
• If Cosine < 0.5, then the occurrence of A is negatively correlated with the occurrence of B,
meaning that the occurrence of one likely leads to the absence of the other one.
• If Cosine > 0.5, then the occurrence of A is positively correlated with the occurrence of B,
meaning that the occurrence of one implies to the occurrence of the other one.
• If Cosine = = 0.5, then A and B are independent and there is no correlation between them.
Problem:
Mr. Jamal Hossain, manager of All Electronics interested to find out the correlation between his
two most sold item namely computer game and video. Mr. Jamal analyses his database and find
out the following statistics about the two items.
Computer Game 𝐶𝑜𝑚𝑝𝑢𝑡𝑒𝑟 𝐺𝑎𝑚𝑒 ∑ 𝑅𝑜𝑤
Video 4000 3500 7500
𝑉𝑖𝑑𝑒𝑜 2000 500 2500
∑ 𝐶𝑜𝑙 6000 4000 10000 = N
i. Suppose that the association rule buys (X, “Computer Game”) -> buys (Y, “Video”) is
mined. Given a minimum support threshold and minimum confidence threshold of 30%and
60% respectively, is this rule strong?
ii. Analyze correlation between these items using Lift, Chi Square, All-Confidence and
Cosine measure.
Solution:
i. We know that,
Support (X->Y) =
𝑆𝑢𝑝𝑝𝑜𝑟𝑡 (𝑋𝑢𝑌)
𝑁
*100
Confidence (X->Y) =
𝑆𝑢𝑝𝑝𝑜𝑟𝑡 (𝑋𝑢𝑌)
𝑆𝑢𝑝𝑝𝑜𝑟𝑡 (𝑋)
*100
Therefore,
Support (G->V) =
𝑆𝑢𝑝𝑝𝑜𝑟𝑡 (𝐺𝑢𝑉)
𝑁
*100
= (4000/10000)*100 = 40% > Minimum Support 30%
![An Association rule will be strong if
Support(X->Y) >= Minimum Support and Confidence (X->Y) >= Minimum Confidence.
Correlation Analysis
It is used to study the closeness of the relationship between two or more variables i.e., the degree
to which the variables are associated with each other.
Methods of Correlation Analysis
1. Lift
2. X2
(Chi Square)
3. All Confidence
4. Cosine
Correlation Analysis using Lift
The Lift between the occurrence of A and B can be measured by computing
Lift (A, B) =
𝑃(𝐴𝑈𝐵)
𝑃(𝐴)∗𝑃(𝐵)
• If Lift < 1, then the occurrence of A is negatively correlated with the occurrence of B,
meaning that the occurrence of one likely leads to the absence of the other one.
• If Lift > 1, then the occurrence of A is positively correlated with the occurrence of B,
meaning that the occurrence of one implies to the occurrence of the other one.
• If Lift = = 1, then A and B are independent and there is no correlation between them.
Correlation Analysis using Χ2
Χ2
= ∑
[𝑂𝑏𝑠𝑒𝑟𝑣𝑒𝑑−𝐸𝑥𝑝𝑒𝑐𝑡𝑒𝑑]2
𝐸𝑥𝑝𝑒𝑐𝑡𝑒𝑑
Expected (i,j) =
𝑆𝑢𝑝(𝑖)∗𝑆𝑢𝑝(𝑗)
𝑁
• If Χ2
< 1, then the occurrence of A is negatively correlated with the occurrence of B,
meaning that the occurrence of one likely leads to the absence of the other one.
• If Χ2
> 1, then the occurrence of A is positively correlated with the occurrence of B,
meaning that the occurrence of one implies to the occurrence of the other one.
• If Χ2
= = 0, then A and B are independent and there is no correlation between them.
Correlation Analysis using All-Confidence
All-Confidence=
𝑆𝑢𝑝𝑝𝑜𝑟𝑡(𝐴𝑈𝐵)
𝑀𝑎𝑥−𝑆𝑢𝑝𝑝𝑜𝑟𝑡(𝐴)
• If All-Confidence < 0.5, then the occurrence of A is negatively correlated with the
occurrence of B, meaning that the occurrence of one likely leads to the absence of the other
one.](https://image.slidesharecdn.com/lecture-09-250428181127-0dfa6b78/85/Correlation-Analysis-in-Machine-Learning-pdf-1-320.jpg)
![An Association rule will be strong if
Support(X->Y) >= Minimum Support and Confidence (X->Y) >= Minimum Confidence.
Correlation Analysis
It is used to study the closeness of the relationship between two or more variables i.e., the degree
to which the variables are associated with each other.
Methods of Correlation Analysis
1. Lift
2. X2
(Chi Square)
3. All Confidence
4. Cosine
Correlation Analysis using Lift
The Lift between the occurrence of A and B can be measured by computing
Lift (A, B) =
𝑃(𝐴𝑈𝐵)
𝑃(𝐴)∗𝑃(𝐵)
• If Lift < 1, then the occurrence of A is negatively correlated with the occurrence of B,
meaning that the occurrence of one likely leads to the absence of the other one.
• If Lift > 1, then the occurrence of A is positively correlated with the occurrence of B,
meaning that the occurrence of one implies to the occurrence of the other one.
• If Lift = = 1, then A and B are independent and there is no correlation between them.
Correlation Analysis using Χ2
Χ2
= ∑
[𝑂𝑏𝑠𝑒𝑟𝑣𝑒𝑑−𝐸𝑥𝑝𝑒𝑐𝑡𝑒𝑑]2
𝐸𝑥𝑝𝑒𝑐𝑡𝑒𝑑
Expected (i,j) =
𝑆𝑢𝑝(𝑖)∗𝑆𝑢𝑝(𝑗)
𝑁
• If Χ2
< 1, then the occurrence of A is negatively correlated with the occurrence of B,
meaning that the occurrence of one likely leads to the absence of the other one.
• If Χ2
> 1, then the occurrence of A is positively correlated with the occurrence of B,
meaning that the occurrence of one implies to the occurrence of the other one.
• If Χ2
= = 0, then A and B are independent and there is no correlation between them.
Correlation Analysis using All-Confidence
All-Confidence=
𝑆𝑢𝑝𝑝𝑜𝑟𝑡(𝐴𝑈𝐵)
𝑀𝑎𝑥−𝑆𝑢𝑝𝑝𝑜𝑟𝑡(𝐴)
• If All-Confidence < 0.5, then the occurrence of A is negatively correlated with the
occurrence of B, meaning that the occurrence of one likely leads to the absence of the other
one.](https://image.slidesharecdn.com/lecture-09-250428181127-0dfa6b78/75/Correlation-Analysis-in-Machine-Learning-pdf-1-2048.jpg)
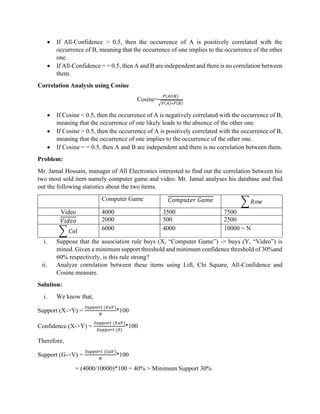
![Confidence (G->V) =
𝑆𝑢𝑝𝑝𝑜𝑟𝑡 (𝐺𝑢𝑉)
𝑆𝑢𝑝𝑝𝑜𝑟𝑡 (𝐺)
*100
= (4000/6000)*100 = 66% > Minimum Confidence 60%
So, we called it is a strong association rule.
ii. Correlation Analysis using Lift
Lift (G, V) =
𝑃(𝐺𝑈𝑉)
𝑃(𝐺)∗𝑃(𝑉)
=
𝑆𝑢𝑝𝑝𝑜𝑟𝑡(𝐺𝑢𝑉)
𝑁
𝑆𝑢𝑝𝑝𝑜𝑟𝑡(𝐺)
𝑁
∗
𝑆𝑢𝑝𝑝𝑜𝑟𝑡(𝑉)
𝑁
=
4000
10000
6000
10000
∗
7500
10000
=
0.4
0.6∗0.75
= 0.89 < 1 (Negatively
Correlated)
Correlation Analysis using Χ2
Contingency Table
Computer Game 𝐶𝑜𝑚𝑝𝑢𝑡𝑒𝑟 𝐺𝑎𝑚𝑒 ∑ 𝑅𝑜𝑤
Video 4000 (4500) 3500 (3000) 7500
𝑉𝑖𝑑𝑒𝑜 2000 (1500) 500 (1000) 2500
∑ 𝐶𝑜𝑙 6000 4000 10000 = N
Expected (G, V) =
𝑆𝑢𝑝(𝐺)∗𝑆𝑢𝑝(𝑉)
𝑁
= (6000*7500)/10000 = 4500
Expected (𝐺, 𝑉) =
𝑆𝑢𝑝𝑝𝑜𝑟𝑡(𝐺)∗𝑆𝑢𝑝𝑝𝑜𝑟𝑡 (𝑉)
𝑁
= (4000*7500)/10000 = 3000
Expected (G, 𝑉) =
𝑆𝑢𝑝𝑝𝑜𝑟𝑡(𝐺)∗𝑆𝑢𝑝𝑝𝑜𝑟𝑡 (𝑉)
𝑁
= (6000*2500)/10000 = 1500
Expected (𝐺, 𝑉) =
𝑆𝑢𝑝𝑝𝑜𝑟𝑡(𝐺)∗𝑆𝑢𝑝𝑝𝑜𝑟𝑡 (𝑉)
𝑁
= (4000*2500)/10000 = 1000
Therefore,
Χ2
= ∑
[𝑂𝑏𝑠𝑒𝑟𝑣𝑒𝑑−𝐸𝑥𝑝𝑒𝑐𝑡𝑒𝑑]2
𝐸𝑥𝑝𝑒𝑐𝑡𝑒𝑑
=
[4000−4500]2
4500
+
[3500−3000]2
3000
+
[2000−1500]2
1500
+
[500−1000]2
1000
= 555.6 > 1 (Positively Correlated)
Correlation Analysis using All-Confidence
All-Confidence=
𝑆𝑢𝑝𝑝𝑜𝑟𝑡(𝐺𝑈𝑉)
𝑀𝑎𝑥−𝑆𝑢𝑝𝑝𝑜𝑟𝑡(𝑉)
= 4000/7500 = 0.53 > 0.5 (Positively Correlated)
Correlation Analysis using Cosine
Cosine=
𝑃(𝐺𝑈𝑉)
√𝑃(𝐺)∗𝑃(𝑉)](https://image.slidesharecdn.com/lecture-09-250428181127-0dfa6b78/85/Correlation-Analysis-in-Machine-Learning-pdf-3-320.jpg)