Correlation
•Download as DOCX, PDF•
1 like•131 views
This document discusses correlation and correlation analysis. It defines correlation as the degree of relationship between two or more variables, ranging from -1 (perfect negative correlation) to +1 (perfect positive correlation). There are three types of correlation: positive, negative, and no relationship. Correlation analysis is used to determine the strength, order, and degree of interchange between variables. It can be applied in fields like data analytics, marketing research, and business analysis. The document provides an example of calculating bivariate correlation between variables in SPSS and interpreting the results.
Report
Share
Report
Share

Recommended
Recommended
Correlation Analysis
Statistical techniques for measuring the closeness of the relationship between variables.It measures the degree to which changes in one variable are associated with changes in another.It can only indicate the degree of association or covariance between variables. Covariance is a measure of the extent to which two variables are related.
Correlation and regression
Correlation and regression.
It shows different aspects of Correlation and regression.
A small comparison of these two is also listed in this presentation.
Correlation
HOW IS IT USEFUL IN FIELD OF FORENSIC SCIENCE AND IN THIS I HAVE SHOWN THE TYPES OF CORRELATION, SIGNIFICANCE , METHODS AND KARL PEARSON'S METHOD OF CORRELATION
Correlation and partial correlation
Correlation and partial correlation-using SPSS and M.S. Excel with example
Correlation analysis
Lecture given in course Applied Statistics in Engineering
OAH305 in Mälardalen University Sweden
Assumptions of Linear Regression - Machine Learning
Description of the assumptions made by Linear Regression.
Linear Correlation
Types, indications of correlations, types of variables, linear correlation, strength, direction and significance
Correlation & Linear Regression
Topic: Correlation & Linear regression
Subject: QTIA
Software: SPSS
Dr Faisal Afzal Siddiqui
More Related Content
What's hot
Correlation Analysis
Statistical techniques for measuring the closeness of the relationship between variables.It measures the degree to which changes in one variable are associated with changes in another.It can only indicate the degree of association or covariance between variables. Covariance is a measure of the extent to which two variables are related.
Correlation and regression
Correlation and regression.
It shows different aspects of Correlation and regression.
A small comparison of these two is also listed in this presentation.
Correlation
HOW IS IT USEFUL IN FIELD OF FORENSIC SCIENCE AND IN THIS I HAVE SHOWN THE TYPES OF CORRELATION, SIGNIFICANCE , METHODS AND KARL PEARSON'S METHOD OF CORRELATION
Correlation and partial correlation
Correlation and partial correlation-using SPSS and M.S. Excel with example
Correlation analysis
Lecture given in course Applied Statistics in Engineering
OAH305 in Mälardalen University Sweden
Assumptions of Linear Regression - Machine Learning
Description of the assumptions made by Linear Regression.
Linear Correlation
Types, indications of correlations, types of variables, linear correlation, strength, direction and significance
Correlation & Linear Regression
Topic: Correlation & Linear regression
Subject: QTIA
Software: SPSS
Dr Faisal Afzal Siddiqui
What's hot (19)
Assumptions of Linear Regression - Machine Learning
Assumptions of Linear Regression - Machine Learning
Viewers also liked
La rinconada4mar17m ldealfonsorodriguezvera[1]
Presentamos el "Morning Line" del handicapper Alfonso Rodríguez Vera para el programa de carreras del sábado 4 de marzo de 2017 en el hipódromo nacional La Rinconada, Caracas, Venezuela.
A Marcha da Irmandade do Colégio Ártico
Compositor - V. Zavyalov / S. Tagan
Estilo - Marcha
Formação - Banda de Música
Viewers also liked (12)
Similar to Correlation
CORRELATION ANALYSIS NOTES.pdf
STATISTICS FOR DECISION MAKING - CORRELATION ANALYSIS, MEANING, TYPES, METHODS OF CALCULATION OF CORRELATION
For this assignment, use the aschooltest.sav dataset.The d
For this assignment, use the aschooltest.sav dataset.
The dataset consists of Reading, Writing, Math, Science, and Social Studies test scores for 200 students. Demographic data include gender, race, SES, school type, and program type.
Instructions:
Work with the aschooltest.sav datafile and respond to the following questions in a few sentences. Please submit your SPSS output either in your assignment or separately.
1. Identify an Independent and Dependent Variable (of your choice) and develop a hypothesis about what you expect to find. (
note: the IV is a grouping variable, which means it needs to have more than 2 categories and the DV is continuous)
2. Run Assumption tests for Normality and initial Homogeneity of Variance. What are your results?
3. Run the one-way ANOVA with the Levene test & Tukey post hoc test.
a. What are the results of the Levene test? What does this mean?
b. What are the results of the one-way ANOVA (use notation)? What does it mean?
c. Are post hoc tests necessary? If so, what are the results of those analyses?
4. How do your analyses address your hypotheses?
Is concentration of single parent families associated with reading scores?
Using the AECF state data, the regression below measures the effect of the state's percentage of single parent families on the percentage of 4th graders with below basic reading scores.
%belowbasicread = β0 + β1x%SPF + u
Stata Output
1) Please write out the regression equation using the coefficients in the table
2) Please provide an interpretation of the coefficient for SPF
3) How does the model fit?
4) What is the NULL hypothesis for a T test about a regression coefficient?
5) What is the ALTERNATE hypothesis for a T test about a regression coefficient?
6) Look at the p value for the coefficient SPF.
a) Report the p value
b) How many stars would it get if we used our standard convention?
* p ≤ .1 ** p ≤ .05 *** p ≤ .01
image1.png
Two-Variable (Bivariate) Regression
In the last unit, we covered scatterplots and correlation. Social scientists use these as descriptive tools for getting an idea about how our variables of interest are related. But these tools only get us so far. Regression analysis is the next step. Regression is by far the most used tool in social science research.
Simple regression analysis can tell us several things:
1. Regression can estimate the relationship between x and y in their
original units of measurement. To see why this is so useful, consider the example of infant mortality and median family income. Let’s say that a policymaker is interested in knowing how much of a change in median family income is needed to significantly reduce the infant mortality rate. Correlation cannot answer this question, but regression can.
2. Regression can tell us how well the independent variable (x) explains the dependent variable (y). The measure is called the
R square.
Simple Tw ...
Data analysis test for association BY Prof Sachin Udepurkar
Test of Association - Bivariate Analysis.
To interpret relationship between variables
BUS 308 – Week 4 Lecture 2 Interpreting Relationships .docx
BUS 308 – Week 4 Lecture 2
Interpreting Relationships
Expected Outcomes
After reading this lecture, the student should be able to:
1. Interpret the strength of a correlation
2. Interpret a Correlation Table
3. Interpret a Linear Regression Equation
4. Interpret a Multiple Regression Equation
Overview
As in many detective stories, we will often find that when one thing changes, we see that
something else has changed as well. Moving to correlation and regression opens up new insights
into our data sets, but still lets us use what we have learned about Excel tools in setting up and
generating our results.
The correlation between events is mirrored in data analysis examinations with correlation
analysis. This week’s focus changes from detecting and evaluating differences to looking at
relationships. As students often comment, finding significant differences in gender-based
measures does not explain why these differences exist. Correlation, while not always explaining
why things happen gives data detectives great clues on what to examine more closely and helps
move us towards understanding why outcomes exist and what impacts them. If we see
correlations in the real world, we often will spend time examining what might underlie them;
finding out if they are spurious or causal.
Regression lets us use relationships between and among our variables to predict or
explain outcomes based upon inputs, factors we think might be related. In our quest to
understand what impacts the compa-ratio and salary outcomes we see, we have often been
frustrated due to being basically limited to examining only two variables at a time, when we felt
that we needed to include many other factors. Regression, particularly multiple regression, is the
tool that allows us to do this.
Linear Correlation
When two things seem to move in a somewhat predictable way, we say they are
correlated. This correlation could be direct or positive, both move in the same direction, or it
could be inverse or negative, where when one increases the other decreases. The Law of Supply
in economics is a common example of an inverse (or negative) correlation, where the more
supply we have of something, the less we typically can charge for it; the Law of Demand is an
example of a direct (or positive) correlation as the more demand exists for something, the more
we can charge for it. Height and weight in young children is another common example of a
direct correlation, as one increases so does the other measure.
Probably the most commonly used correlation is the Pearson Correlation Coefficient,
symbolized by r. It measures the strength of the association – the extent to which measures
change together – between interval or ratio level measures as well as the direction of the
relationship (inverse or direct). Several measures in our company data set could use the Pearson
Correlation to show relationships; salary and midpoint, salary and yea.
BUS 308 – Week 4 Lecture 2 Interpreting Relationships .docx
BUS 308 – Week 4 Lecture 2
Interpreting Relationships
Expected Outcomes
After reading this lecture, the student should be able to:
1. Interpret the strength of a correlation
2. Interpret a Correlation Table
3. Interpret a Linear Regression Equation
4. Interpret a Multiple Regression Equation
Overview
As in many detective stories, we will often find that when one thing changes, we see that
something else has changed as well. Moving to correlation and regression opens up new insights
into our data sets, but still lets us use what we have learned about Excel tools in setting up and
generating our results.
The correlation between events is mirrored in data analysis examinations with correlation
analysis. This week’s focus changes from detecting and evaluating differences to looking at
relationships. As students often comment, finding significant differences in gender-based
measures does not explain why these differences exist. Correlation, while not always explaining
why things happen gives data detectives great clues on what to examine more closely and helps
move us towards understanding why outcomes exist and what impacts them. If we see
correlations in the real world, we often will spend time examining what might underlie them;
finding out if they are spurious or causal.
Regression lets us use relationships between and among our variables to predict or
explain outcomes based upon inputs, factors we think might be related. In our quest to
understand what impacts the compa-ratio and salary outcomes we see, we have often been
frustrated due to being basically limited to examining only two variables at a time, when we felt
that we needed to include many other factors. Regression, particularly multiple regression, is the
tool that allows us to do this.
Linear Correlation
When two things seem to move in a somewhat predictable way, we say they are
correlated. This correlation could be direct or positive, both move in the same direction, or it
could be inverse or negative, where when one increases the other decreases. The Law of Supply
in economics is a common example of an inverse (or negative) correlation, where the more
supply we have of something, the less we typically can charge for it; the Law of Demand is an
example of a direct (or positive) correlation as the more demand exists for something, the more
we can charge for it. Height and weight in young children is another common example of a
direct correlation, as one increases so does the other measure.
Probably the most commonly used correlation is the Pearson Correlation Coefficient,
symbolized by r. It measures the strength of the association – the extent to which measures
change together – between interval or ratio level measures as well as the direction of the
relationship (inverse or direct). Several measures in our company data set could use the Pearson
Correlation to show relationships; salary and midpoint, salary and yea ...
36033 Topic Happiness Data setNumber of Pages 2 (Double Spac.docx
36033 Topic: Happiness Data set
Number of Pages: 2 (Double Spaced)
Number of sources: 1
Writing Style: APA
Type of document: Essay
Academic Level:Master
Category: Psychology
Language Style: English (U.S.)
Order Instructions: Attached
I will upload the instructions
Reference/Article
Module 18: Correlational Research
Magnitude, Scatterplots, and Types of Relationships
Magnitude
Scatterplots
Positive Relationships
Negative Relationships
No Relationship
Curvilinear Relationships
Misinterpreting Correlations
The Assumptions of Causality and Directionality
The Third-Variable Problem
Restrictive Range
Curvilinear Relationships
Prediction and Correlation
Review of Key Terms
Module Exercises
Critical Thinking Check Answers
Module 19: Correlation Coefficients
The Pearson Product-Moment Correlation Coefficient: What It Is and What It Does
Calculating the Pearson Product-Moment Correlation
Interpreting the Pearson Product-Moment Correlation
Alternative Correlation Coefficients
Review of Key Terms
Module Exercises
Critical Thinking Check Answers
Module 20: Advanced Correlational Techniques: Regression Analysis
Regression Lines
Calculating the Slope and y-intercept
Prediction and Regression
Multiple Regression Analysis
Review of Key Terms
Module Exercises
Critical Thinking Check Answers
Chapter 9 Summary and Review
Chapter 9 Statistical Software Resources
In this chapter, we discuss correlational research methods and correlational statistics. As a research method, correlational designs allow us to describe the relationship between two measured variables. A correlation coefficient aids us by assigning a numerical value to the observed relationship. We begin with a discussion of how to conduct correlational research, the magnitude and the direction of correlations, and graphical representations of correlations. We then turn to special considerations when interpreting correlations, how to use correlations for predictive purposes, and how to calculate correlation coefficients. Lastly, we will discuss an advanced correlational technique, regression analysis.
MODULE 18
Correlational Research
Learning Objectives
•Describe the difference between strong, moderate, and weak correlation coefficients.
•Draw and interpret scatterplots.
•Explain negative, positive, curvilinear, and no relationship between variables.
•Explain how assuming causality and directionality, the third-variable problem, restrictive ranges, and curvilinear relationships can be problematic when interpreting correlation coefficients.
•Explain how correlations allow us to make predictions.
When conducting correlational studies, researchers determine whether two naturally occurring variables (for example, height and weight, or smoking and cancer) are related to each other. Such studies assess whether the variables are “co-related” in some way—do people who are taller tend to weigh more, or do those who smoke tend to have a higher incidence of cancer? As we saw in Chapter 1, the cor.
36030 Topic Discussion1Number of Pages 2 (Double Spaced).docx
36030 Topic: Discussion1
Number of Pages: 2 (Double Spaced)
Number of sources: 1
Writing Style: APA
Type of document: Essay
Academic Level:Master
Category: Psychology
Language Style: English (U.S.)
Order Instructions: Attached
I will upload the instruction
Reference/Article
Module 18: Correlational Research
Magnitude, Scatterplots, and Types of Relationships
Magnitude
Scatterplots
Positive Relationships
Negative Relationships
No Relationship
Curvilinear Relationships
Misinterpreting Correlations
The Assumptions of Causality and Directionality
The Third-Variable Problem
Restrictive Range
Curvilinear Relationships
Prediction and Correlation
Review of Key Terms
Module Exercises
Critical Thinking Check Answers
Module 19: Correlation Coefficients
The Pearson Product-Moment Correlation Coefficient: What It Is and What It Does
Calculating the Pearson Product-Moment Correlation
Interpreting the Pearson Product-Moment Correlation
Alternative Correlation Coefficients
Review of Key Terms
Module Exercises
Critical Thinking Check Answers
Module 20: Advanced Correlational Techniques: Regression Analysis
Regression Lines
Calculating the Slope and y-intercept
Prediction and Regression
Multiple Regression Analysis
Review of Key Terms
Module Exercises
Critical Thinking Check Answers
Chapter 9 Summary and Review
Chapter 9 Statistical Software Resources
In this chapter, we discuss correlational research methods and correlational statistics. As a research method, correlational designs allow us to describe the relationship between two measured variables. A correlation coefficient aids us by assigning a numerical value to the observed relationship. We begin with a discussion of how to conduct correlational research, the magnitude and the direction of correlations, and graphical representations of correlations. We then turn to special considerations when interpreting correlations, how to use correlations for predictive purposes, and how to calculate correlation coefficients. Lastly, we will discuss an advanced correlational technique, regression analysis.
MODULE 18
Correlational Research
Learning Objectives
•Describe the difference between strong, moderate, and weak correlation coefficients.
•Draw and interpret scatterplots.
•Explain negative, positive, curvilinear, and no relationship between variables.
•Explain how assuming causality and directionality, the third-variable problem, restrictive ranges, and curvilinear relationships can be problematic when interpreting correlation coefficients.
•Explain how correlations allow us to make predictions.
When conducting correlational studies, researchers determine whether two naturally occurring variables (for example, height and weight, or smoking and cancer) are related to each other. Such studies assess whether the variables are “co-related” in some way—do people who are taller tend to weigh more, or do those who smoke tend to have a higher incidence of cancer? As we saw in Chapter 1, the correlationa.
Multivariate Analysis Degree of association between two variable
- Test of Ho...
multivariate analysis power point presentation
Week 4 Lecture 10 We have been examining the question of equal p.docx
Week 4 Lecture 10
We have been examining the question of equal pay for equal work for several weeks now; but have been somewhat frustrated with the equal work part. We suspect that salary varies with grade level, so that equal work is not done if we compare salaries across grades. We found that we could control the effect of grades with either of two techniques. The first is by choosing a variable that does not include grade level variation such as compa-ratios (the salary divided by midpoint). The second by statistically removing the impact of grade level using the ANOVA Two-factor without replication. Both of these gave us different outcomes on the question of male and female pay equality than examining salary only.
However, we still have not gotten a “clean” measure of equal work as there are still other factors that may impact work done such as performance levels (measured by the performance appraisal rating), seniority, education, etc. And, there could be gender bias (and, for real world companies, ethnic bias as well. We will not cover this, but it can be dealt with the same way as we will examine gender). We need to find a way to eliminate the impact of these variables on our pay measure as well.
This week we will look at two techniques that are very good at examining and explaining the influence of variables on outcomes. These are correlation and regression techniques. Linear Correlation
Correlation is a measure of how variables/things relate – that is, if one variable changes does another variable change in a predictable pattern as well? One very well-known example is the correlation (or relationship) between length/height of children and weight. As children become longer/taller their weight also increases (Tanner & Youssef-Morgan, 2013). Using this relationship, we can make predictions (using the technique of regression discussed in Lecture 11 for this week) about how heavy a child should be for any given height.
For variables that are at least interval in nature, two types of correlation exist for a bivariable (two variables only) relationship– linear and curvilinear. As they sound, linear correlations show the extent to which the data variables move in a straight line. Curvilinear correlations – which we will not cover – show the extent that variables move in curved lines.
Scatter Diagrams
An effective way to see if the data do relate in predictable ways involves generating a scatter diagram (AKA scatter chart) – a visual display of how the data points – (variable 1 value, corresponding variable 2 value) relate together (Lind, Marchel, & Wathen, 2008).
Example1. One relationship we might expect to show a positive (both values increasing) relationship would be salary and performance rating, either for the entire salary range or at least within grades. The following scatter diagram (made with the Excel Insert Graph functions) show the relationship with Performance Rating on the bottom and Salary on the on the .
Two-Variable (Bivariate) RegressionIn the last unit, we covered
Two-Variable (Bivariate) Regression
In the last unit, we covered scatterplots and correlation. Social scientists use these as descriptive tools for getting an idea about how our variables of interest are related. But these tools only get us so far. Regression analysis is the next step. Regression is by far the most used tool in social science research.
Simple regression analysis can tell us several things:
1. Regression can estimate the relationship between x and y in their
original units of measurement. To see why this is so useful, consider the example of infant mortality and median family income. Let’s say that a policymaker is interested in knowing how much of a change in median family income is needed to significantly reduce the infant mortality rate. Correlation cannot answer this question, but regression can.
2. Regression can tell us how well the independent variable (x) explains the dependent variable (y). The measure is called the
R square.
Simple Two-Variable (Bivariate) Regression
Regression uses the equation of a line to estimate the relationship between x and y. You may remember back in algebra learning about the equation of a line. Some learned it as Y =s X + K or Y = mX + B. In statistics, we use a different form:
Equation 1: Y = B0 + B1X + u
Let’s define each term in the equation:
· Y is the dependent variable. It is placed on the Y (vertical) axis. In the example below, the dependent variable (Y) is the infant mortality rate.
· B0 is the Y intercept. B0 is also referred to as “the constant.” B0 is the point where the regression line crosses the Y axis. Importantly, B0 is equal to the
predicted value of Ywhen X=0. In most cases, B0 is does not get much attention for two reasons. First, the researcher is usually interested in the relationship between x and y. not the relationship between x and y at the single value of x=0. Second, often independent variables do not take on the value zero. Consider the AECF sample data. There are no states with low-birth-weight percentages equal to zero, so we would be extrapolating beyond what the data tell us.
· B1 is usually the main point of interest for researchers. It is the slope of the line relating x to y. Researchers usually refer to B1 as a slope coefficient, regression coefficient or simply a coefficient.
B1 measures the change in Y for a one-unit change in x. We represent change by the symbol ∆.
B1 =
· u is the error term. The error term is the distance between the regression line and the dots on the scatterplot. Think about it, regression estimates a single line through the cloud of data. Naturally, the line does not hit all the data points. The degree to which the line “misses” the data point is the error. u can also be thought of as
all the other factors that affect the infant mortality rate besides X. Importantly, we
assume that u is totally random given X.
The ...
Assessment 2 ContextIn many data analyses, it is desirable.docx
Assessment 2 Context
In many data analyses, it is desirable to compute a coefficient of association. Coefficients of association are quantitative measures of the amount of relationship between two variables. Ultimately, most techniques can be reduced to a coefficient of association and expressed as the amount of relationship between the variables in the analysis. There are many types of coefficients of association. They express the mathematical association in different ways, usually based on assumptions about the data. The most common coefficient of association you will encounter is the Pearson product-moment correlation coefficient (symbolized as the italicized r), and it is the only coefficient of association that can safely be referred to as simply the "correlation coefficient". It is common enough so that if no other information is provided, it is reasonable to assume that is what is meant.
Correlation coefficients are numbers that give information about the strength of relationship between two variables, such as two different test scores from a sample of participants. The coefficient ranges from -1 through +1. Coefficients between 0 and +1 indicate a positive relationship between the two scores, such as high scores on one test tending to come from people with high scores on the second. The other possible relationship, which is every bit as useful, is a negative correlation between -1 and 0. A negative correlation possesses no less predictive power between the two scores. The difference is that high scores on one measure are associated with low scores on the other.
An example of the kinds of measures that might correlate negatively is absences and grades. People with higher absences will be expected to have lower grades. When a correlation is said to be significant, it can be shown that the correlation is significantly different form zero in the population. A correlation of zero means no relationship between variables. A correlation other than zero means the variables are related. As the coefficient gets further from zero (toward +1 or -1), the relationship becomes stronger.Interpreting Correlation: Magnitude and Sign
Interpreting a Pearson's correlation coefficient (rXY) requires an understanding of two concepts:
· Magnitude.
· Sign (+/-).
The magnitude refers to the strength of the linear relationship between Variable X and Variable
The rXY ranges in values from -1.00 to +1.00. To determine magnitude, ignore the sign of the correlation, and the absolute value of rXY indicates the extent to which Variable X and Variable Y are linearly related. For correlations close to 0, there is no linear relationship. As the correlation approaches either -1.00 or +1.00, the magnitude of the correlation increases. Therefore, for example, the magnitude of r = -.65 is greater than the magnitude of r = +.25 (|.65| > |.25|).
In contrast to magnitude, the sign of a non-zero correlation is either negative or positive.
These labels are not interpreted ...
Assessment 2 ContextIn many data analyses, it is desirable.docx
Assessment 2 Context
In many data analyses, it is desirable to compute a coefficient of association. Coefficients of association are quantitative measures of the amount of relationship between two variables. Ultimately, most techniques can be reduced to a coefficient of association and expressed as the amount of relationship between the variables in the analysis. There are many types of coefficients of association. They express the mathematical association in different ways, usually based on assumptions about the data. The most common coefficient of association you will encounter is the Pearson product-moment correlation coefficient (symbolized as the italicized r), and it is the only coefficient of association that can safely be referred to as simply the "correlation coefficient". It is common enough so that if no other information is provided, it is reasonable to assume that is what is meant.
Correlation coefficients are numbers that give information about the strength of relationship between two variables, such as two different test scores from a sample of participants. The coefficient ranges from -1 through +1. Coefficients between 0 and +1 indicate a positive relationship between the two scores, such as high scores on one test tending to come from people with high scores on the second. The other possible relationship, which is every bit as useful, is a negative correlation between -1 and 0. A negative correlation possesses no less predictive power between the two scores. The difference is that high scores on one measure are associated with low scores on the other.
An example of the kinds of measures that might correlate negatively is absences and grades. People with higher absences will be expected to have lower grades. When a correlation is said to be significant, it can be shown that the correlation is significantly different form zero in the population. A correlation of zero means no relationship between variables. A correlation other than zero means the variables are related. As the coefficient gets further from zero (toward +1 or -1), the relationship becomes stronger.Interpreting Correlation: Magnitude and Sign
Interpreting a Pearson's correlation coefficient (rXY) requires an understanding of two concepts:
· Magnitude.
· Sign (+/-).
The magnitude refers to the strength of the linear relationship between Variable X and Variable
The rXY ranges in values from -1.00 to +1.00. To determine magnitude, ignore the sign of the correlation, and the absolute value of rXY indicates the extent to which Variable X and Variable Y are linearly related. For correlations close to 0, there is no linear relationship. As the correlation approaches either -1.00 or +1.00, the magnitude of the correlation increases. Therefore, for example, the magnitude of r = -.65 is greater than the magnitude of r = +.25 (|.65| > |.25|).
In contrast to magnitude, the sign of a non-zero correlation is either negative or positive.
These labels are not interpreted .
01 psychological statistics 1
Study notes on Psychological Statistics for the Third Semester students of B.Sc Counselling Psychology of University of Calicut
Similar to Correlation (20)
For this assignment, use the aschooltest.sav dataset.The d
For this assignment, use the aschooltest.sav dataset.The d
Data analysis test for association BY Prof Sachin Udepurkar
Data analysis test for association BY Prof Sachin Udepurkar
BUS 308 – Week 4 Lecture 2 Interpreting Relationships .docx
BUS 308 – Week 4 Lecture 2 Interpreting Relationships .docx
BUS 308 – Week 4 Lecture 2 Interpreting Relationships .docx
BUS 308 – Week 4 Lecture 2 Interpreting Relationships .docx
36033 Topic Happiness Data setNumber of Pages 2 (Double Spac.docx
36033 Topic Happiness Data setNumber of Pages 2 (Double Spac.docx
36030 Topic Discussion1Number of Pages 2 (Double Spaced).docx
36030 Topic Discussion1Number of Pages 2 (Double Spaced).docx
Multivariate Analysis Degree of association between two variable
- Test of Ho...
Multivariate Analysis Degree of association between two variable
- Test of Ho...
Week 4 Lecture 10 We have been examining the question of equal p.docx
Week 4 Lecture 10 We have been examining the question of equal p.docx
Two-Variable (Bivariate) RegressionIn the last unit, we covered
Two-Variable (Bivariate) RegressionIn the last unit, we covered
Dr. A Sumathi - LINEARITY CONCEPT OF SIGNIFICANCE.pdf
Dr. A Sumathi - LINEARITY CONCEPT OF SIGNIFICANCE.pdf
Assessment 2 ContextIn many data analyses, it is desirable.docx
Assessment 2 ContextIn many data analyses, it is desirable.docx
Assessment 2 ContextIn many data analyses, it is desirable.docx
Assessment 2 ContextIn many data analyses, it is desirable.docx
Recently uploaded
一比一原版(QU毕业证)皇后大学毕业证成绩单
QU毕业证【微信95270640】办理皇后大学毕业证原版一模一样、QU毕业证制作【Q微信95270640】《皇后大学毕业证购买流程》《QU成绩单制作》皇后大学毕业证书QU毕业证文凭皇后大学
本科毕业证书,学历学位认证如何办理【留学国外学位学历认证、毕业证、成绩单、大学Offer、雅思托福代考、语言证书、学生卡、高仿教育部认证等一切高仿或者真实可查认证服务】代办国外(海外)英国、加拿大、美国、新西兰、澳大利亚、新西兰等国外各大学毕业证、文凭学历证书、成绩单、学历学位认证真实可查。
1:1完美还原海外各大学毕业材料上的工艺:水印阴影底纹钢印LOGO烫金烫银LOGO烫金烫银复合重叠。文字图案浮雕激光镭射紫外荧光温感复印防伪。
可办理以下真实皇后大学存档留学生信息存档认证:
1皇后大学真实留信网认证(网上可查永久存档无风险百分百成功入库);
2真实教育部认证(留服)等一切高仿或者真实可查认证服务(暂时不可办理);
3购买英美真实学籍(不用正常就读直接出学历);
4英美一年硕士保毕业证项目(保录取学校挂名不用正常就读保毕业)
留学本科/硕士毕业证书成绩单制作流程:
1客户提供办理信息:姓名生日专业学位毕业时间等(如信息不确定可以咨询顾问:我们有专业老师帮你查询皇后大学皇后大学硕士毕业证成绩单);
2开始安排制作皇后大学毕业证成绩单电子图;
3皇后大学毕业证成绩单电子版做好以后发送给您确认;
4皇后大学毕业证成绩单电子版您确认信息无误之后安排制作成品;
5皇后大学成品做好拍照或者视频给您确认;
6快递给客户(国内顺丰国外DHLUPS等快读邮寄)
— — — — — — — — — — — 《文凭顾问Q/微:95270640》很感动很无奈房东的儿子小伍笨手笨脚的不会说普通话满口粤语态度十分傲慢一副盛气凌人的样子山娃试图接近他跟他交友与城里人交友但他俩就好像是两个世界里的人根本拢不到一块儿不知不觉山娃倒跟周围出租屋里的几个小伙伴成了好朋友因为他们也是从乡下进城过暑假的小学生快乐的日子总是过得飞快山娃尚未完全认清那几位小朋友时他们却一个接一个地回家了山娃这时才恍然发现二个月的暑假已转到了尽头他的城市生活也将划上一个不很圆义
一比一原版(UofS毕业证书)萨省大学毕业证如何办理
原版定制【微信:41543339】【(UofS毕业证书)萨省大学毕业证】【微信:41543339】成绩单、外壳、offer、留信学历认证(永久存档真实可查)采用学校原版纸张、特殊工艺完全按照原版一比一制作(包括:隐形水印,阴影底纹,钢印LOGO烫金烫银,LOGO烫金烫银复合重叠,文字图案浮雕,激光镭射,紫外荧光,温感,复印防伪)行业标杆!精益求精,诚心合作,真诚制作!多年品质 ,按需精细制作,24小时接单,全套进口原装设备,十五年致力于帮助留学生解决难题,业务范围有加拿大、英国、澳洲、韩国、美国、新加坡,新西兰等学历材料,包您满意。
【我们承诺采用的是学校原版纸张(纸质、底色、纹路),我们拥有全套进口原装设备,特殊工艺都是采用不同机器制作,仿真度基本可以达到100%,所有工艺效果都可提前给客户展示,不满意可以根据客户要求进行调整,直到满意为止!】
【业务选择办理准则】
一、工作未确定,回国需先给父母、亲戚朋友看下文凭的情况,办理一份就读学校的毕业证【微信41543339】文凭即可
二、回国进私企、外企、自己做生意的情况,这些单位是不查询毕业证真伪的,而且国内没有渠道去查询国外文凭的真假,也不需要提供真实教育部认证。鉴于此,办理一份毕业证【微信41543339】即可
三、进国企,银行,事业单位,考公务员等等,这些单位是必需要提供真实教育部认证的,办理教育部认证所需资料众多且烦琐,所有材料您都必须提供原件,我们凭借丰富的经验,快捷的绿色通道帮您快速整合材料,让您少走弯路。
留信网认证的作用:
1:该专业认证可证明留学生真实身份
2:同时对留学生所学专业登记给予评定
3:国家专业人才认证中心颁发入库证书
4:这个认证书并且可以归档倒地方
5:凡事获得留信网入网的信息将会逐步更新到个人身份内,将在公安局网内查询个人身份证信息后,同步读取人才网入库信息
6:个人职称评审加20分
7:个人信誉贷款加10分
8:在国家人才网主办的国家网络招聘大会中纳入资料,供国家高端企业选择人才
留信网服务项目:
1、留学生专业人才库服务(留信分析)
2、国(境)学习人员提供就业推荐信服务
3、留学人员区块链存储服务
→ 【关于价格问题(保证一手价格)】
我们所定的价格是非常合理的,而且我们现在做得单子大多数都是代理和回头客户介绍的所以一般现在有新的单子 我给客户的都是第一手的代理价格,因为我想坦诚对待大家 不想跟大家在价格方面浪费时间
对于老客户或者被老客户介绍过来的朋友,我们都会适当给一些优惠。
选择实体注册公司办理,更放心,更安全!我们的承诺:客户在留信官方认证查询网站查询到认证通过结果后付款,不成功不收费!
社内勉強会資料_LLM Agents .
単純な応答だけでなく、複雑な課題に対応できる柔軟性を持つLLM Agents。主要コンポーネントのPlanning、Memory、Tool Useについて解説しています。
一比一原版(UniSA毕业证书)南澳大学毕业证如何办理
原版定制【微信:41543339】【(UniSA毕业证书)南澳大学毕业证】【微信:41543339】成绩单、外壳、offer、留信学历认证(永久存档真实可查)采用学校原版纸张、特殊工艺完全按照原版一比一制作(包括:隐形水印,阴影底纹,钢印LOGO烫金烫银,LOGO烫金烫银复合重叠,文字图案浮雕,激光镭射,紫外荧光,温感,复印防伪)行业标杆!精益求精,诚心合作,真诚制作!多年品质 ,按需精细制作,24小时接单,全套进口原装设备,十五年致力于帮助留学生解决难题,业务范围有加拿大、英国、澳洲、韩国、美国、新加坡,新西兰等学历材料,包您满意。
【我们承诺采用的是学校原版纸张(纸质、底色、纹路),我们拥有全套进口原装设备,特殊工艺都是采用不同机器制作,仿真度基本可以达到100%,所有工艺效果都可提前给客户展示,不满意可以根据客户要求进行调整,直到满意为止!】
【业务选择办理准则】
一、工作未确定,回国需先给父母、亲戚朋友看下文凭的情况,办理一份就读学校的毕业证【微信41543339】文凭即可
二、回国进私企、外企、自己做生意的情况,这些单位是不查询毕业证真伪的,而且国内没有渠道去查询国外文凭的真假,也不需要提供真实教育部认证。鉴于此,办理一份毕业证【微信41543339】即可
三、进国企,银行,事业单位,考公务员等等,这些单位是必需要提供真实教育部认证的,办理教育部认证所需资料众多且烦琐,所有材料您都必须提供原件,我们凭借丰富的经验,快捷的绿色通道帮您快速整合材料,让您少走弯路。
留信网认证的作用:
1:该专业认证可证明留学生真实身份
2:同时对留学生所学专业登记给予评定
3:国家专业人才认证中心颁发入库证书
4:这个认证书并且可以归档倒地方
5:凡事获得留信网入网的信息将会逐步更新到个人身份内,将在公安局网内查询个人身份证信息后,同步读取人才网入库信息
6:个人职称评审加20分
7:个人信誉贷款加10分
8:在国家人才网主办的国家网络招聘大会中纳入资料,供国家高端企业选择人才
留信网服务项目:
1、留学生专业人才库服务(留信分析)
2、国(境)学习人员提供就业推荐信服务
3、留学人员区块链存储服务
→ 【关于价格问题(保证一手价格)】
我们所定的价格是非常合理的,而且我们现在做得单子大多数都是代理和回头客户介绍的所以一般现在有新的单子 我给客户的都是第一手的代理价格,因为我想坦诚对待大家 不想跟大家在价格方面浪费时间
对于老客户或者被老客户介绍过来的朋友,我们都会适当给一些优惠。
选择实体注册公司办理,更放心,更安全!我们的承诺:客户在留信官方认证查询网站查询到认证通过结果后付款,不成功不收费!
SOCRadar Germany 2024 Threat Landscape Report
As Europe's leading economic powerhouse and the fourth-largest hashtag#economy globally, Germany stands at the forefront of innovation and industrial might. Renowned for its precision engineering and high-tech sectors, Germany's economic structure is heavily supported by a robust service industry, accounting for approximately 68% of its GDP. This economic clout and strategic geopolitical stance position Germany as a focal point in the global cyber threat landscape.
In the face of escalating global tensions, particularly those emanating from geopolitical disputes with nations like hashtag#Russia and hashtag#China, hashtag#Germany has witnessed a significant uptick in targeted cyber operations. Our analysis indicates a marked increase in hashtag#cyberattack sophistication aimed at critical infrastructure and key industrial sectors. These attacks range from ransomware campaigns to hashtag#AdvancedPersistentThreats (hashtag#APTs), threatening national security and business integrity.
🔑 Key findings include:
🔍 Increased frequency and complexity of cyber threats.
🔍 Escalation of state-sponsored and criminally motivated cyber operations.
🔍 Active dark web exchanges of malicious tools and tactics.
Our comprehensive report delves into these challenges, using a blend of open-source and proprietary data collection techniques. By monitoring activity on critical networks and analyzing attack patterns, our team provides a detailed overview of the threats facing German entities.
This report aims to equip stakeholders across public and private sectors with the knowledge to enhance their defensive strategies, reduce exposure to cyber risks, and reinforce Germany's resilience against cyber threats.
一比一原版(CBU毕业证)不列颠海角大学毕业证成绩单
CBU毕业证【微信95270640】《如何办理不列颠海角大学毕业证认证》【办证Q微信95270640】《不列颠海角大学文凭毕业证制作》《CBU学历学位证书哪里买》办理不列颠海角大学学位证书扫描件、办理不列颠海角大学雅思证书!
国际留学归国服务中心《如何办不列颠海角大学毕业证认证》《CBU学位证书扫描件哪里买》实体公司,注册经营,行业标杆,精益求精!
1:1完美还原海外各大学毕业材料上的工艺:水印阴影底纹钢印LOGO烫金烫银LOGO烫金烫银复合重叠。文字图案浮雕激光镭射紫外荧光温感复印防伪。
可办理以下真实不列颠海角大学存档留学生信息存档认证:
1不列颠海角大学真实留信网认证(网上可查永久存档无风险百分百成功入库);
2真实教育部认证(留服)等一切高仿或者真实可查认证服务(暂时不可办理);
3购买英美真实学籍(不用正常就读直接出学历);
4英美一年硕士保毕业证项目(保录取学校挂名不用正常就读保毕业)
留学本科/硕士毕业证书成绩单制作流程:
1客户提供办理信息:姓名生日专业学位毕业时间等(如信息不确定可以咨询顾问:我们有专业老师帮你查询不列颠海角大学不列颠海角大学本科学位证成绩单);
2开始安排制作不列颠海角大学毕业证成绩单电子图;
3不列颠海角大学毕业证成绩单电子版做好以后发送给您确认;
4不列颠海角大学毕业证成绩单电子版您确认信息无误之后安排制作成品;
5不列颠海角大学成品做好拍照或者视频给您确认;
6快递给客户(国内顺丰国外DHLUPS等快读邮寄)
— — — — — — — — — — — 《文凭顾问Q/微:95270640》这么大这么美的地方赚大钱高楼大厦鳞次栉比大街小巷人潮涌动山娃一路张望一路惊叹他发现城里的桥居然层层叠叠扭来扭去桥下没水却有着水一般的车水马龙山娃惊诧于城里的公交车那么大那么美不用买票乖乖地掷下二枚硬币空调享受还能坐着看电视呢屡经辗转山娃终于跟着父亲到家了山娃没想到父亲城里的家会如此寒碜更没料到父亲的城里竟有如此简陋的鬼地方父亲的家在高楼最底屋最下面很矮很黑是很不显眼的地下室父亲的家安在别人脚底下孰
一比一原版(UMich毕业证)密歇根大学|安娜堡分校毕业证成绩单
UMich毕业证【微信95270640】办理UMich毕业证【Q微信95270640】密歇根大学|安娜堡分校毕业证书原版↑制作密歇根大学|安娜堡分校学历认证文凭办理密歇根大学|安娜堡分校留信网认证,留学回国办理毕业证成绩单文凭学历认证【Q微信95270640】专业为海外学子办理毕业证成绩单、文凭制作,学历仿制,回国人员证明、做文凭,研究生、本科、硕士学历认证、留信认证、结业证、学位证书样本、美国教育部认证百分百真实存档可查】
【本科硕士】密歇根大学|安娜堡分校密歇根大学|安娜堡分校硕士毕业证成绩单(GPA修改);学历认证(教育部认证);大学Offer录取通知书留信认证使馆认证;雅思语言证书等高仿类证书。
办理流程:
1客户提供办理密歇根大学|安娜堡分校密歇根大学|安娜堡分校硕士毕业证成绩单信息:姓名生日专业学位毕业时间等(如信息不确定可以咨询顾问:我们有专业老师帮你查询);
2开始安排制作毕业证成绩单电子图;
3毕业证成绩单电子版做好以后发送给您确认;
4毕业证成绩单电子版您确认信息无误之后安排制作成品;
5成品做好拍照或者视频给您确认;
6快递给客户(国内顺丰国外DHLUPS等快读邮寄)
真实网上可查的证明材料
1教育部学历学位认证留服官网真实存档可查永久存档。
2留学回国人员证明(使馆认证)使馆网站真实存档可查。
我们对海外大学及学院的毕业证成绩单所使用的材料尺寸大小防伪结构(包括:密歇根大学|安娜堡分校密歇根大学|安娜堡分校硕士毕业证成绩单隐形水印阴影底纹钢印LOGO烫金烫银LOGO烫金烫银复合重叠。文字图案浮雕激光镭射紫外荧光温感复印防伪)都有原版本文凭对照。质量得到了广大海外客户群体的认可同时和海外学校留学中介做到与时俱进及时掌握各大院校的(毕业证成绩单资格证结业证录取通知书在读证明等相关材料)的版本更新信息能够在第一时间掌握最新的海外学历文凭的样版尺寸大小纸张材质防伪技术等等并在第一时间收集到原版实物以求达到客户的需求。
本公司还可以按照客户原版印刷制作且能够达到客户理想的要求。有需要办理证件的客户请联系我们在线客服中心微信:95270640 或咨询在线在我脑海中回旋很幸运我有这样的机会能将埋在心底深深的感激之情得以表达从婴儿的“哇哇坠地到哺育我长大您们花去了多少的心血与汗水编织了多少个日日夜夜从上小学到初中乃至大学燃烧着自己默默奉献着光和热全天下的父母都是仁慈的无私的伟大的所以无论何时何地都不要忘记您们是这样的无私将一份沉甸甸的爱和希望传递到我们的眼里和心中而我应做的就是感恩父母回报社会共创和谐父母对我们的恩情深厚而无私孝敬父母是我们做人元
一比一原版(BU毕业证)波士顿大学毕业证成绩单
BU毕业证【微信95270640】购买(波士顿大学毕业证成绩单硕士学历)Q微信95270640代办BU学历认证留信网伪造波士顿大学学位证书精仿波士顿大学本科/硕士文凭证书补办波士顿大学 diplomaoffer,Transcript购买波士顿大学毕业证成绩单购买BU假毕业证学位证书购买伪造波士顿大学文凭证书学位证书,专业办理雅思、托福成绩单,学生ID卡,在读证明,海外各大学offer录取通知书,毕业证书,成绩单,文凭等材料:1:1完美还原毕业证、offer录取通知书、学生卡等各种在读或毕业材料的防伪工艺(包括 烫金、烫银、钢印、底纹、凹凸版、水印、防伪光标、热敏防伪、文字图案浮雕,激光镭射,紫外荧光,温感光标)学校原版上有的工艺我们一样不会少,不论是老版本还是最新版本,都能保证最高程度还原,力争完美以求让所有同学都能享受到完美的品质服务。
专业为留学生办理波士顿大学波士顿大学毕业证offer【100%存档可查】留学全套申请材料办理。本公司承诺所有毕业证成绩单成品全部按照学校原版工艺对照一比一制作和学校一样的羊皮纸张保证您证书的质量!
如果你回国在学历认证方面有以下难题请联系我们我们将竭诚为你解决认证瓶颈
1所有材料真实但资料不全无法提供完全齐整的原件。【如:成绩单丶毕业证丶回国证明等材料中有遗失的。】
2获得真实的国外最终学历学位但国外本科学历就读经历存在问题或缺陷。【如:国外本科是教育部不承认的或者是联合办学项目教育部没有备案的或者外本科没有正常毕业的。】
3学分转移联合办学等情况复杂不知道怎么整理材料的。时间紧迫自己不清楚递交流程的。
如果你是以上情况之一请联系我们我们将在第一时间内给你免费咨询相关信息。我们将帮助你整理认证所需的各种材料.帮你解决国外学历认证难题。
国外波士顿大学波士顿大学毕业证offer办理方法:
1客户提供办理信息:姓名生日专业学位毕业时间等(如信息不确定可以咨询顾问:我们有专业老师帮你查询波士顿大学波士顿大学毕业证offer);
2开始安排制作波士顿大学毕业证成绩单电子图;
3波士顿大学毕业证成绩单电子版做好以后发送给您确认;
4波士顿大学毕业证成绩单电子版您确认信息无误之后安排制作成品;
5波士顿大学成品做好拍照或者视频给您确认;
6快递给客户(国内顺丰国外DHLUPS等快读邮寄)。二条巴掌般大的裤衩衩走出泳池山娃感觉透身粘粘乎乎散发着药水味有点痒山娃顿时留恋起家乡的小河潺潺活水清凉无比日子就这样孤寂而快乐地过着寂寞之余山娃最神往最开心就是晚上无论多晚多累父亲总要携山娃出去兜风逛夜市流光溢彩人潮涌动的都市夜生活总让山娃目不暇接惊叹不已父亲老问山娃想买什么想吃什么山娃知道父亲赚钱很辛苦除了书籍和文具山娃啥也不要能牵着父亲的手满城闲逛他已心满意足了父亲连挑了三套童装叫山娃试穿山伸
一比一原版(UPenn毕业证)宾夕法尼亚大学毕业证成绩单
UPenn毕业证【微信95270640】办理宾夕法尼亚大学毕业证原版一模一样、UPenn毕业证制作【Q微信95270640】《宾夕法尼亚大学毕业证购买流程》《UPenn成绩单制作》宾夕法尼亚大学毕业证书UPenn毕业证文凭宾夕法尼亚大学
本科毕业证书,学历学位认证如何办理【留学国外学位学历认证、毕业证、成绩单、大学Offer、雅思托福代考、语言证书、学生卡、高仿教育部认证等一切高仿或者真实可查认证服务】代办国外(海外)英国、加拿大、美国、新西兰、澳大利亚、新西兰等国外各大学毕业证、文凭学历证书、成绩单、学历学位认证真实可查。
办国外宾夕法尼亚大学宾夕法尼亚大学硕士学位证成绩单教育部学历学位认证留信认证大使馆认证留学回国人员证明修改成绩单信封申请学校offer录取通知书在读证明offer letter。
快速办理高仿国外毕业证成绩单:
1宾夕法尼亚大学毕业证+成绩单+留学回国人员证明+教育部学历认证(全套留学回国必备证明材料给父母及亲朋好友一份完美交代);
2雅思成绩单托福成绩单OFFER在读证明等留学相关材料(申请学校转学甚至是申请工签都可以用到)。
3.毕业证 #成绩单等全套材料从防伪到印刷从水印到钢印烫金高精仿度跟学校原版100%相同。
专业服务请勿犹豫联系我!联系人微信号:95270640诚招代理:本公司诚聘当地代理人员如果你有业余时间有兴趣就请联系我们。
国外宾夕法尼亚大学宾夕法尼亚大学硕士学位证成绩单办理过程:
1客户提供办理信息:姓名生日专业学位毕业时间等(如信息不确定可以咨询顾问:我们有专业老师帮你查询);
2开始安排制作毕业证成绩单电子图;
3毕业证成绩单电子版做好以后发送给您确认;
4毕业证成绩单电子版您确认信息无误之后安排制作成品;
5成品做好拍照或者视频给您确认;
6快递给客户(国内顺丰国外DHLUPS等快读邮寄)。我们在哪里父母对我们的爱和思念为我们的生命增加了光彩给予我们自由追求的力量生活的力量我们也不忘感恩正因为这股感恩的线牵着我们使我们在一年的结束时刻义无反顾的踏上了回家的旅途人们常说父母恩最难回报愿我能以当年爸爸妈妈对待小时候的我们那样耐心温柔地对待我将渐渐老去的父母体谅他们以反哺之心奉敬父母以感恩之心孝顺父母哪怕只为父母换洗衣服为父母喂饭送汤按摩酸痛的腰背握着父母的手扶着他们一步一步地慢慢散步.娃
Opendatabay - Open Data Marketplace.pptx
Opendatabay.com unlocks the power of data for everyone. Open Data Marketplace fosters a collaborative hub for data enthusiasts to explore, share, and contribute to a vast collection of datasets.
First ever open hub for data enthusiasts to collaborate and innovate. A platform to explore, share, and contribute to a vast collection of datasets. Through robust quality control and innovative technologies like blockchain verification, opendatabay ensures the authenticity and reliability of datasets, empowering users to make data-driven decisions with confidence. Leverage cutting-edge AI technologies to enhance the data exploration, analysis, and discovery experience.
From intelligent search and recommendations to automated data productisation and quotation, Opendatabay AI-driven features streamline the data workflow. Finding the data you need shouldn't be a complex. Opendatabay simplifies the data acquisition process with an intuitive interface and robust search tools. Effortlessly explore, discover, and access the data you need, allowing you to focus on extracting valuable insights. Opendatabay breaks new ground with a dedicated, AI-generated, synthetic datasets.
Leverage these privacy-preserving datasets for training and testing AI models without compromising sensitive information. Opendatabay prioritizes transparency by providing detailed metadata, provenance information, and usage guidelines for each dataset, ensuring users have a comprehensive understanding of the data they're working with. By leveraging a powerful combination of distributed ledger technology and rigorous third-party audits Opendatabay ensures the authenticity and reliability of every dataset. Security is at the core of Opendatabay. Marketplace implements stringent security measures, including encryption, access controls, and regular vulnerability assessments, to safeguard your data and protect your privacy.
一比一原版(YU毕业证)约克大学毕业证成绩单
YU毕业证【微信95270640】(约克大学毕业证高仿学位证书((+《Q微信95270640》)))购买YU毕业证修改YU成绩单购买约克大学毕业证办YU文凭办高仿毕业证约克大学毕业证购买修改成绩单挂科退学如何进行学历认证留学退学办毕业证书/ 出国留学无法毕业买毕业证留学被劝退买毕业证(非正常毕业教育部认证咨询) York University
办理国外约克大学毕业证书 #成绩单改成绩 #教育部学历学位认证 #毕业证认证 #留服认证 #使馆认证(留学回国人员证明) #(证)等
真实教育部认证教育部存档中国教育部留学服务中心认证(即教育部留服认证)网站100%可查.
真实使馆认证(即留学人员回国证明)使馆存档可通过大使馆查询确认.
留信网认证国家专业人才认证中心颁发入库证书留信网永久存档可查.
约克大学约克大学毕业证学历书毕业证 #成绩单等全套材料从防伪到印刷从水印到钢印烫金跟学校原版100%相同.
国际留学归国服务中心:实体公司注册经营行业标杆精益求精!
国外毕业证学位证成绩单办理流程:
1客户提供办理约克大学约克大学毕业证学历书信息:姓名生日专业学位毕业时间等(如信息不确定可以咨询顾问:我们有专业老师帮你查询);
2开始安排制作约克大学毕业证成绩单电子图;
3约克大学毕业证成绩单电子版做好以后发送给您确认;
4约克大学毕业证成绩单电子版您确认信息无误之后安排制作成品;
5约克大学成品做好拍照或者视频给您确认;
6快递给客户(国内顺丰国外DHLUPS等快递邮寄约克大学约克大学毕业证学历书)。心温柔地对待我将渐渐老去的父母体谅他们以反哺之心奉敬父母以感恩之心孝顺父母哪怕只为父母换洗衣服为父母喂饭送汤按摩酸痛的腰背握着父母的手扶着他们一步一步地慢慢散步.让我们的父母幸福快乐地度过一生挽着清风芒耀似金的骄阳如将之绽放的花蕾一般静静的从远方的山峦间缓缓升起这一片寂静的城市默默的等待着它的第一缕光芒将之唤醒那飘散在它前方的几层薄云像是新娘的婚纱一般为它的光芒添上了几分淡淡的浮晕在悄无声息间这怕
一比一原版(UofM毕业证)明尼苏达大学毕业证成绩单
UofM毕业证【微信95270640】办文凭{明尼苏达大学毕业证}Q微Q微信95270640UofM毕业证书成绩单/学历认证UofM Diploma未毕业、挂科怎么办?+QQ微信:Q微信95270640-大学Offer(申请大学)、成绩单(申请考研)、语言证书、在读证明、使馆公证、办真实留信网认证、真实大使馆认证、学历认证
办国外明尼苏达大学明尼苏达大学毕业证假文凭教育部学历学位认证留信认证大使馆认证留学回国人员证明修改成绩单信封申请学校offer录取通知书在读证明offer letter。
快速办理高仿国外毕业证成绩单:
1明尼苏达大学毕业证+成绩单+留学回国人员证明+教育部学历认证(全套留学回国必备证明材料给父母及亲朋好友一份完美交代);
2雅思成绩单托福成绩单OFFER在读证明等留学相关材料(申请学校转学甚至是申请工签都可以用到)。
3.毕业证 #成绩单等全套材料从防伪到印刷从水印到钢印烫金高精仿度跟学校原版100%相同。
专业服务请勿犹豫联系我!联系人微信号:95270640诚招代理:本公司诚聘当地代理人员如果你有业余时间有兴趣就请联系我们。
国外明尼苏达大学明尼苏达大学毕业证假文凭办理过程:
1客户提供办理信息:姓名生日专业学位毕业时间等(如信息不确定可以咨询顾问:我们有专业老师帮你查询);
2开始安排制作毕业证成绩单电子图;
3毕业证成绩单电子版做好以后发送给您确认;
4毕业证成绩单电子版您确认信息无误之后安排制作成品;
5成品做好拍照或者视频给您确认;
6快递给客户(国内顺丰国外DHLUPS等快读邮寄)。有一次山娃坐在门口写作业写着写着竟伏在桌上睡着了迷迷糊糊中山娃似乎听到了父亲的脚步声当他晃晃悠悠站起来时才诧然发现一位衣衫破旧的妇女挎着一只硕大的蛇皮袋手里拎着长铁钩正站在门口朝黑色的屋内张望不好坏人小偷山娃一怔却也灵机一动立马仰起头双手拢在嘴边朝楼上大喊:“爸爸爸——有人找——那人一听朝山娃尴尬地笑笑悻悻地走了山娃立马“嘭的一声将铁门锁死心却咚咚地乱跳当山娃跟父亲说起这事时父亲很吃惊抚摸着山娃母
Adjusting primitives for graph : SHORT REPORT / NOTES
Graph algorithms, like PageRank Compressed Sparse Row (CSR) is an adjacency-list based graph representation that is
Multiply with different modes (map)
1. Performance of sequential execution based vs OpenMP based vector multiply.
2. Comparing various launch configs for CUDA based vector multiply.
Sum with different storage types (reduce)
1. Performance of vector element sum using float vs bfloat16 as the storage type.
Sum with different modes (reduce)
1. Performance of sequential execution based vs OpenMP based vector element sum.
2. Performance of memcpy vs in-place based CUDA based vector element sum.
3. Comparing various launch configs for CUDA based vector element sum (memcpy).
4. Comparing various launch configs for CUDA based vector element sum (in-place).
Sum with in-place strategies of CUDA mode (reduce)
1. Comparing various launch configs for CUDA based vector element sum (in-place).
一比一原版(ArtEZ毕业证)ArtEZ艺术学院毕业证成绩单
ArtEZ毕业证【微信95270640】☀《ArtEZ艺术学院毕业证购买》Q微信95270640《ArtEZ毕业证模板办理》文凭、本科、硕士、研究生学历都可以做,《文凭ArtEZ毕业证书原版制作ArtEZ成绩单》《仿制ArtEZ毕业证成绩单ArtEZ艺术学院学位证书pdf电子图》毕业证
[留学文凭学历认证(留信认证使馆认证)ArtEZ艺术学院毕业证成绩单毕业证证书大学Offer请假条成绩单语言证书国际回国人员证明高仿教育部认证申请学校等一切高仿或者真实可查认证服务。
多年留学服务公司,拥有海外样板无数能完美1:1还原海外各国大学degreeDiplomaTranscripts等毕业材料。海外大学毕业材料都有哪些工艺呢?工艺难度主要由:烫金.钢印.底纹.水印.防伪光标.热敏防伪等等组成。而且我们每天都在更新海外文凭的样板以求所有同学都能享受到完美的品质服务。
国外毕业证学位证成绩单办理方法:
1客户提供办理ArtEZ艺术学院ArtEZ艺术学院毕业证假文凭信息:姓名生日专业学位毕业时间等(如信息不确定可以咨询顾问:我们有专业老师帮你查询);
2开始安排制作毕业证成绩单电子图;
3毕业证成绩单电子版做好以后发送给您确认;
4毕业证成绩单电子版您确认信息无误之后安排制作成品;
5成品做好拍照或者视频给您确认;
6快递给客户(国内顺丰国外DHLUPS等快读邮寄)
— — — — 我们是挂科和未毕业同学们的福音我们是实体公司精益求精的工艺! — — — -
一真实留信认证的作用(私企外企荣誉的见证):
1:该专业认证可证明留学生真实留学身份同时对留学生所学专业等级给予评定。
2:国家专业人才认证中心颁发入库证书这个入网证书并且可以归档到地方。
3:凡是获得留信网入网的信息将会逐步更新到个人身份内将在公安部网内查询个人身份证信息后同步读取人才网入库信息。
4:个人职称评审加20分个人信誉贷款加10分。
5:在国家人才网主办的全国网络招聘大会中纳入资料供国家500强等高端企业选择人才。却怎么也笑不出来山娃很迷惑父亲的家除了一扇小铁门连窗户也没有墓穴一般阴森森有些骇人父亲的城也便成了山娃的城父亲的家也便成了山娃的家父亲让山娃呆在屋里做作业看电视最多只能在门口透透气不能跟陌生人搭腔更不能乱跑一怕迷路二怕拐子拐人山娃很惊惧去年村里的田鸡就因为跟父亲进城一不小心被人拐跑了至今不见踪影害得田鸡娘天天哭得死去活来疯了一般那情那景无不令人摧肝裂肺山娃很听话天天呆在小屋里除了看书写作业就是睡带
Levelwise PageRank with Loop-Based Dead End Handling Strategy : SHORT REPORT ...
Abstract — Levelwise PageRank is an alternative method of PageRank computation which decomposes the input graph into a directed acyclic block-graph of strongly connected components, and processes them in topological order, one level at a time. This enables calculation for ranks in a distributed fashion without per-iteration communication, unlike the standard method where all vertices are processed in each iteration. It however comes with a precondition of the absence of dead ends in the input graph. Here, the native non-distributed performance of Levelwise PageRank was compared against Monolithic PageRank on a CPU as well as a GPU. To ensure a fair comparison, Monolithic PageRank was also performed on a graph where vertices were split by components. Results indicate that Levelwise PageRank is about as fast as Monolithic PageRank on the CPU, but quite a bit slower on the GPU. Slowdown on the GPU is likely caused by a large submission of small workloads, and expected to be non-issue when the computation is performed on massive graphs.
一比一原版(RUG毕业证)格罗宁根大学毕业证成绩单
RUG毕业证【微信95270640】办文凭{格罗宁根大学毕业证}Q微Q微信95270640RUG毕业证书成绩单/学历认证RUG Diploma未毕业、挂科怎么办?+QQ微信:Q微信95270640-大学Offer(申请大学)、成绩单(申请考研)、语言证书、在读证明、使馆公证、办真实留信网认证、真实大使馆认证、学历认证
办理国外格罗宁根大学毕业证书 #成绩单改成绩 #教育部学历学位认证 #毕业证认证 #留服认证 #使馆认证(留学回国人员证明) #(证)等
真实教育部认证教育部存档中国教育部留学服务中心认证(即教育部留服认证)网站100%可查.
真实使馆认证(即留学人员回国证明)使馆存档可通过大使馆查询确认.
留信网认证国家专业人才认证中心颁发入库证书留信网永久存档可查.
格罗宁根大学格罗宁根大学毕业证学历书毕业证 #成绩单等全套材料从防伪到印刷从水印到钢印烫金跟学校原版100%相同.
国际留学归国服务中心:实体公司注册经营行业标杆精益求精!
国外毕业证学位证成绩单办理流程:
1客户提供办理格罗宁根大学格罗宁根大学毕业证学历书信息:姓名生日专业学位毕业时间等(如信息不确定可以咨询顾问:我们有专业老师帮你查询);
2开始安排制作格罗宁根大学毕业证成绩单电子图;
3格罗宁根大学毕业证成绩单电子版做好以后发送给您确认;
4格罗宁根大学毕业证成绩单电子版您确认信息无误之后安排制作成品;
5格罗宁根大学成品做好拍照或者视频给您确认;
6快递给客户(国内顺丰国外DHLUPS等快递邮寄格罗宁根大学格罗宁根大学毕业证学历书)。也得开灯开风扇山娃不想浪费电总将小方桌搁在门口看书写作业有一次山娃坐在门口写作业写着写着竟伏在桌上睡着了迷迷糊糊中山娃似乎听到了父亲的脚步声当他晃晃悠悠站起来时才诧然发现一位衣衫破旧的妇女挎着一只硕大的蛇皮袋手里拎着长铁钩正站在门口朝黑色的屋内张望不好坏人小偷山娃一怔却也灵机一动立马仰起头双手拢在嘴边朝楼上大喊:“爸爸爸——有人找——那人一听朝山娃尴尬地笑笑悻悻地走了山娃立马“嘭的一声将铁门锁死受
Recently uploaded (20)
Machine learning and optimization techniques for electrical drives.pptx
Machine learning and optimization techniques for electrical drives.pptx
Adjusting primitives for graph : SHORT REPORT / NOTES
Adjusting primitives for graph : SHORT REPORT / NOTES
Levelwise PageRank with Loop-Based Dead End Handling Strategy : SHORT REPORT ...
Levelwise PageRank with Loop-Based Dead End Handling Strategy : SHORT REPORT ...
Correlation
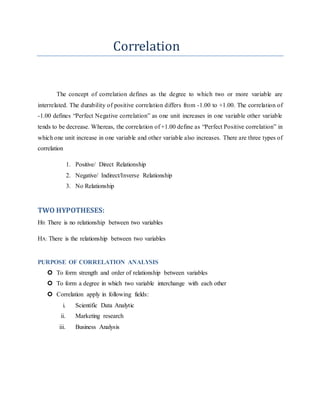
- 1. Correlation The concept of correlation defines as the degree to which two or more variable are interrelated. The durability of positive correlation differs from -1.00 to +1.00. The correlation of -1.00 defines “Perfect Negative correlation” as one unit increases in one variable other variable tends to be decrease. Whereas, the correlation of +1.00 define as “Perfect Positive correlation” in which one unit increase in one variable and other variable also increases. There are three types of correlation 1. Positive/ Direct Relationship 2. Negative/ Indirect/Inverse Relationship 3. No Relationship TWO HYPOTHESES: H0: There is no relationship between two variables HA: There is the relationship between two variables PURPOSE OF CORRELATION ANALYSIS To form strength and order of relationship between variables To form a degree in which two variable interchange with each other Correlation apply in following fields: i. Scientific Data Analytic ii. Marketing research iii. Business Analysis
- 2. Test Statistic: Correlation To calculate Average of each variable in SPSS we have to open the dialog box in Transform Select Compute Variable Fig: 1.1
- 3. In the Compute Variable window, Calculate Average of each variable BE, PQ, BL, BA and Bas as shown in fig: 1.2 Fig: 1.2 After calculating Average of each variable, the SPSS output generate all variable been executed as you can see in fig 1.3 Fig: 1.3
- 4. To calculate Bivariate we have to open dialog box Analyze Correlate Bivariate
- 5. Bivariate Correlations box will open Select Average variable and Shift two variable BE and PQ in to Variable Box In Test Significance Box Select Two- tailed because we do not have any presumption whether it is positive or negative among two variable BE and PQ Under Correlation Coefficients Box “Pearson” is mark off by default We also leave default check on “Flag significant correlation”
- 6. INTERPRETATION: The above table shows the result of “Correlation Analysis”. In this table BE and PQ have positive relationship with the value of .410% which mean that there is strong relationship among BE and PQ. The total numbers of respondent acknowledge both items are 200. Based on significance we reject null hypothesis and accept alternative hypothesis because our P-value is lesser than “N” represents number of cases which is used in Correlation Test as; we do not have any missing data in our data. Our Correlation analysis is based on 200 numbers of cases. Based on Significance Value, Our hypothesis is H0: BE and PQ has no relationship HA: BE and PQ has the relationship Test Statistic: Correlation Bivariate/ Pearson Pre-determined Value 5%