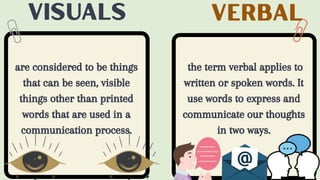
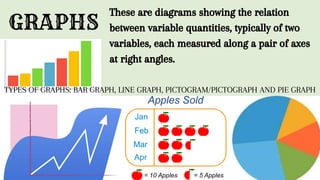
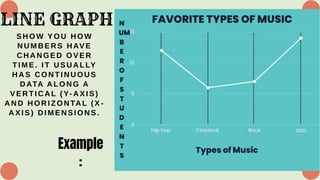
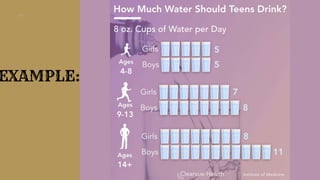
The document discusses different types of graphs found in expository texts and how to interpret them. It defines verbal and visual elements and explains that expository texts use visual elements like graphs to further explain information. The document then describes different types of graphs - bar graphs show independent numbers, line graphs show changes over time, pictograms/pictographs use pictures to represent data, and pie graphs show percentages of a whole. Examples of each graph type are also provided.