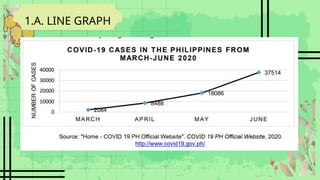
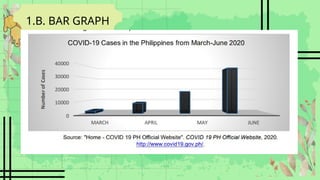
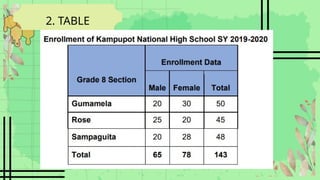
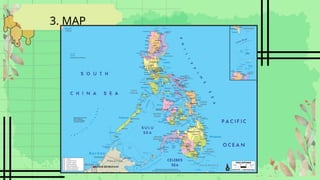
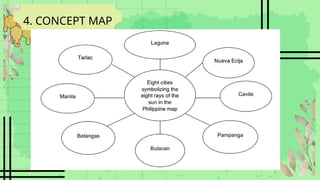
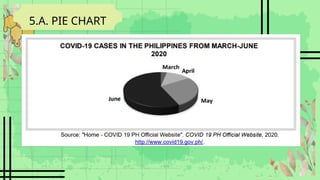
VISUAL-VERBAL
ILLUSTRATIONS
VISUAL-VERBAL
ILLUSTRATIONS
• The ways of presenting information in a
simple and attractive manner to catch
the readers’ interest.
• These illustrations help explain concepts
easily using graphs, maps, tables,
infographics, charts and the like.
TYPES OF VISUAL-
VERBAL ILLUSTRATIONS
1. GRAPH
• is a diagram that shows the
relationships of information
presented. The following are the
different kinds of graphs.
1.A. LINE GRAPH
• is a kind of graph that presents
information trend using data
dots connected by straight line
segments.
1.A. LINE GRAPH
1.B. BAR GRAPH
• is a kind of graph that
characterizes categorical data
with rectangular bars of equal
width.
1.B. BAR GRAPH
2. TABLE
• is an organized arrangement
of data usually in rows and
columns.
2. TABLE
3. MAP
• is a diagram or visual
representation that shows the
relative position of the parts of
something. It could be a
3. MAP
4. CONCEPT MAP
• displays the organization and
relationship of concepts and
ideas.
4. CONCEPT MAP
5. CHART
• is an illustration that presents
information in a tabular or
circular form
5.A. PIE CHART
• is circular in form that
presents how a whole is sliced
into parts.
5.A. PIE CHART
5.B. FLOW CHART
• is an illustration that shows
step-by-step process.
5.B. FLOW CHART
6. INFOGRAPHIC
• is a combination of visual
images and text presentation
of specific information.
6. INFOGRAPHIC
TASK
• In a long bond paper, design an
INFOGRAPHIC about “The History of
the Philippine Independence”.
• Print your design.
• Deadline is on Monday, October 7,
2024.

Visual and verbal illustrations - grade 8 q2