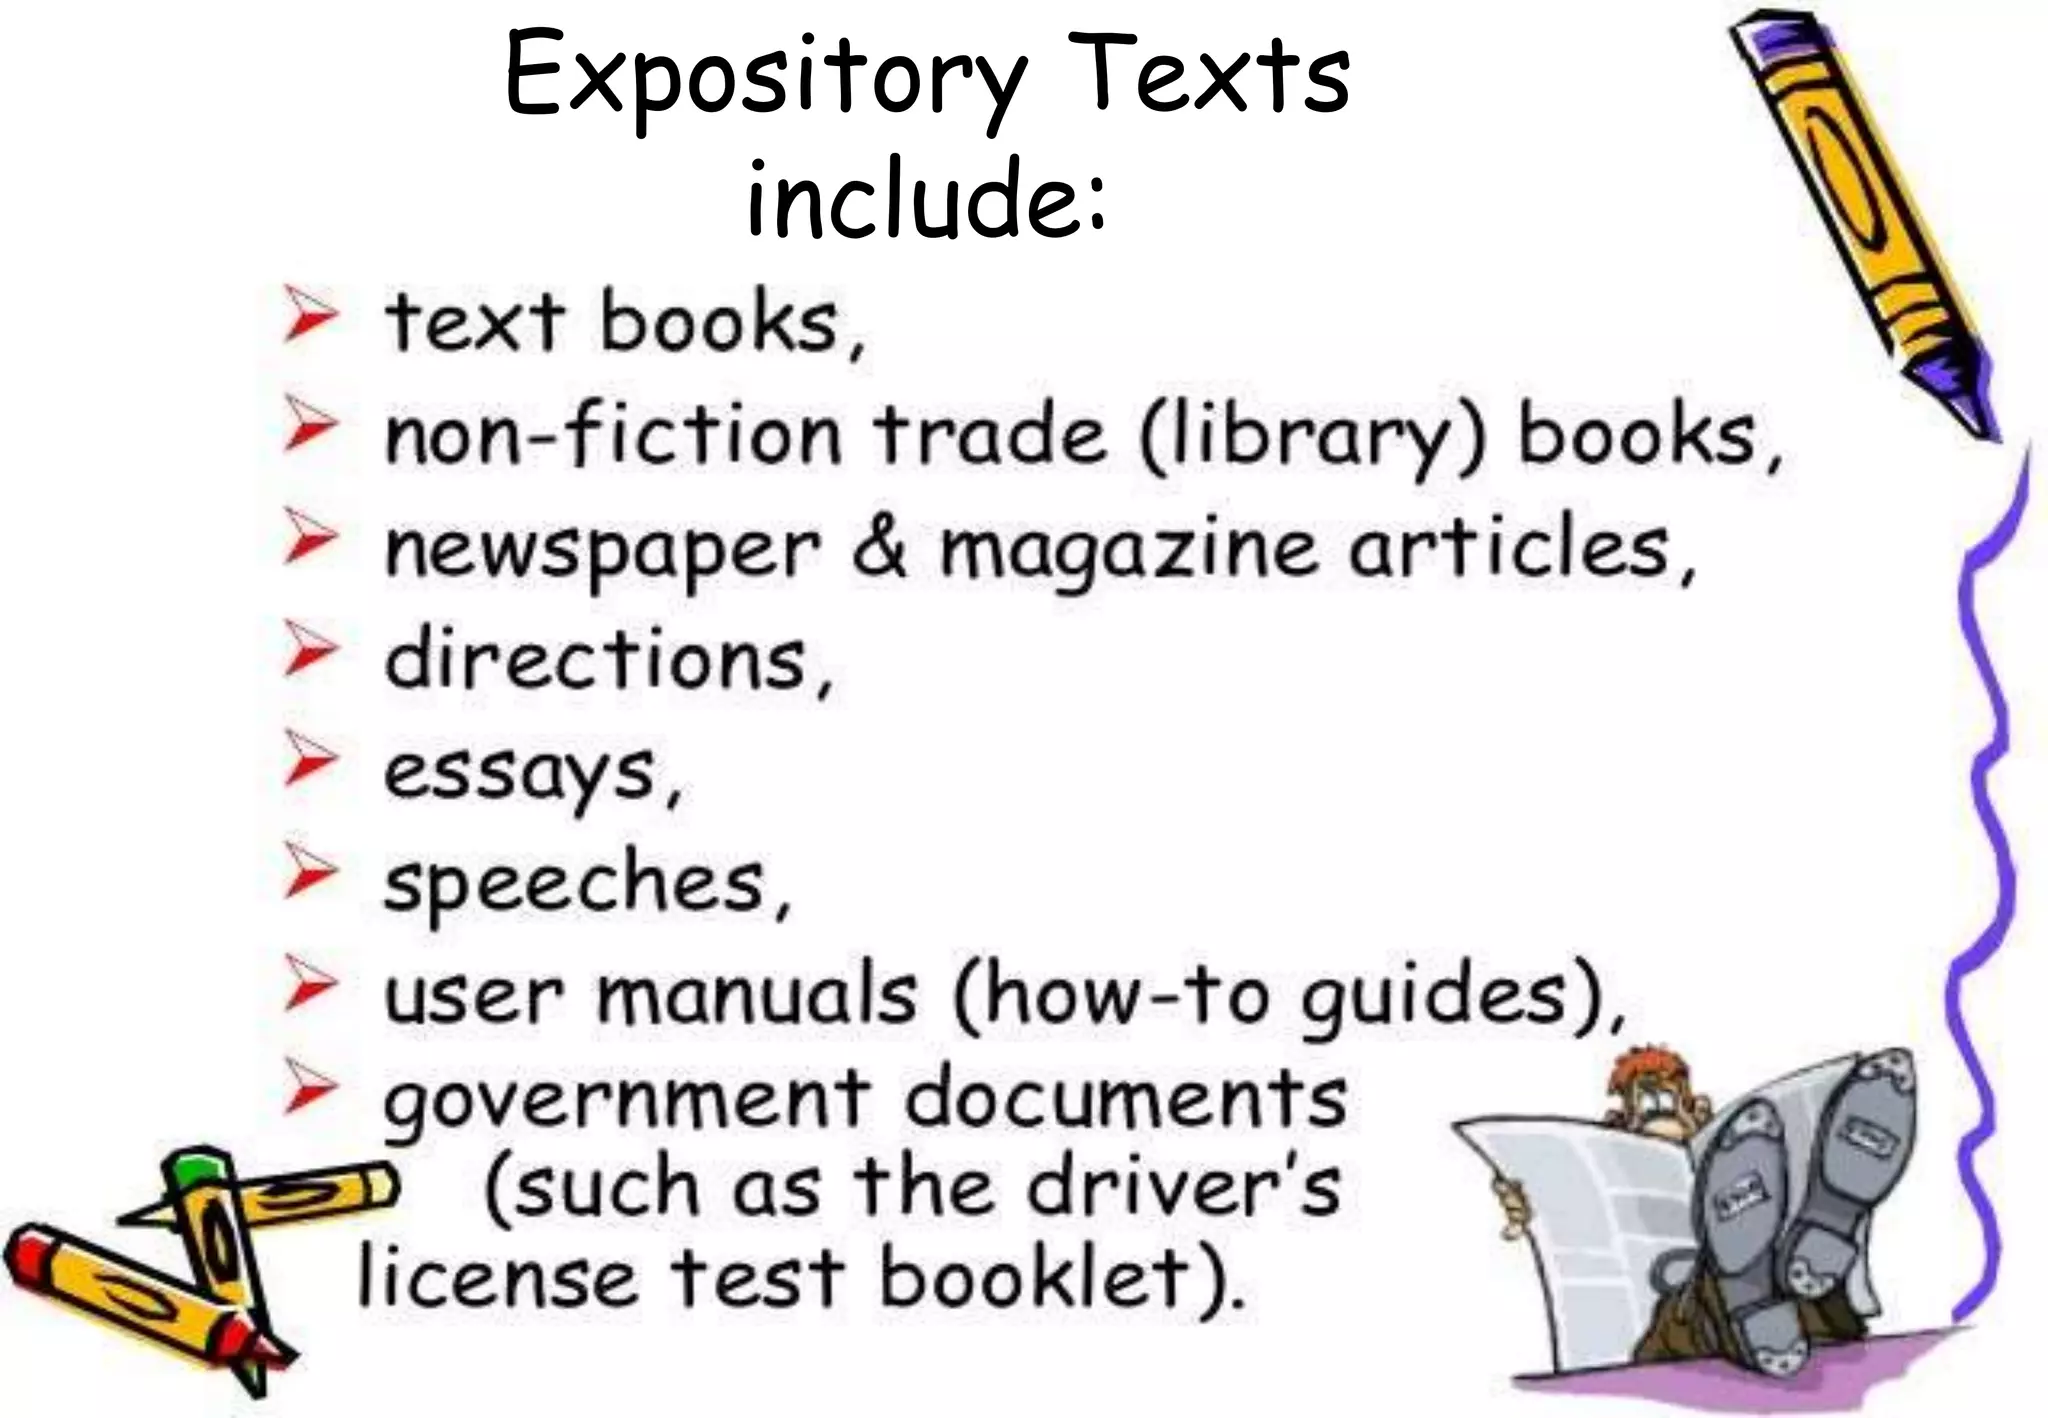
The document outlines the essential learning competency for explaining visual-verbal relationships in expository texts, focusing on various visual aids such as graphs, charts, tables, and maps. It emphasizes the importance of these illustrations in making complex ideas more accessible and engaging. The document includes instructional activities for students to create visual-verbal illustrations and explains their relevance in interpreting data.
ENGLISH 08- QUARTER2
Most Essential Learning
Competency:
Explaining visual-verbal
relationships illustrated in
tables, graphs, and information
maps found in expository texts
(EN8SS-IIe-1.2)
2.
VISUAL by definition
Adjective
1.of or relating to seeing or sight “visual
perception”
Synonyms: optical, optic, ocular, eye
Noun
1. a picture, piece of film, or display used to
illustrate or accompany something
Synonyms: graphic, visual aid, image,
illustration, diagram, display
3.
VERBAL by definition
a.of, relating to, or consisting of
words “verbal instructions”
b. of, relating to, or involving words
rather than meaning or substance
c. words either spoken or written
Before we proceedwith what
visual-verbal illustrations are, let’s
find out your prior knowledge
about them…
Are you ready?
7.
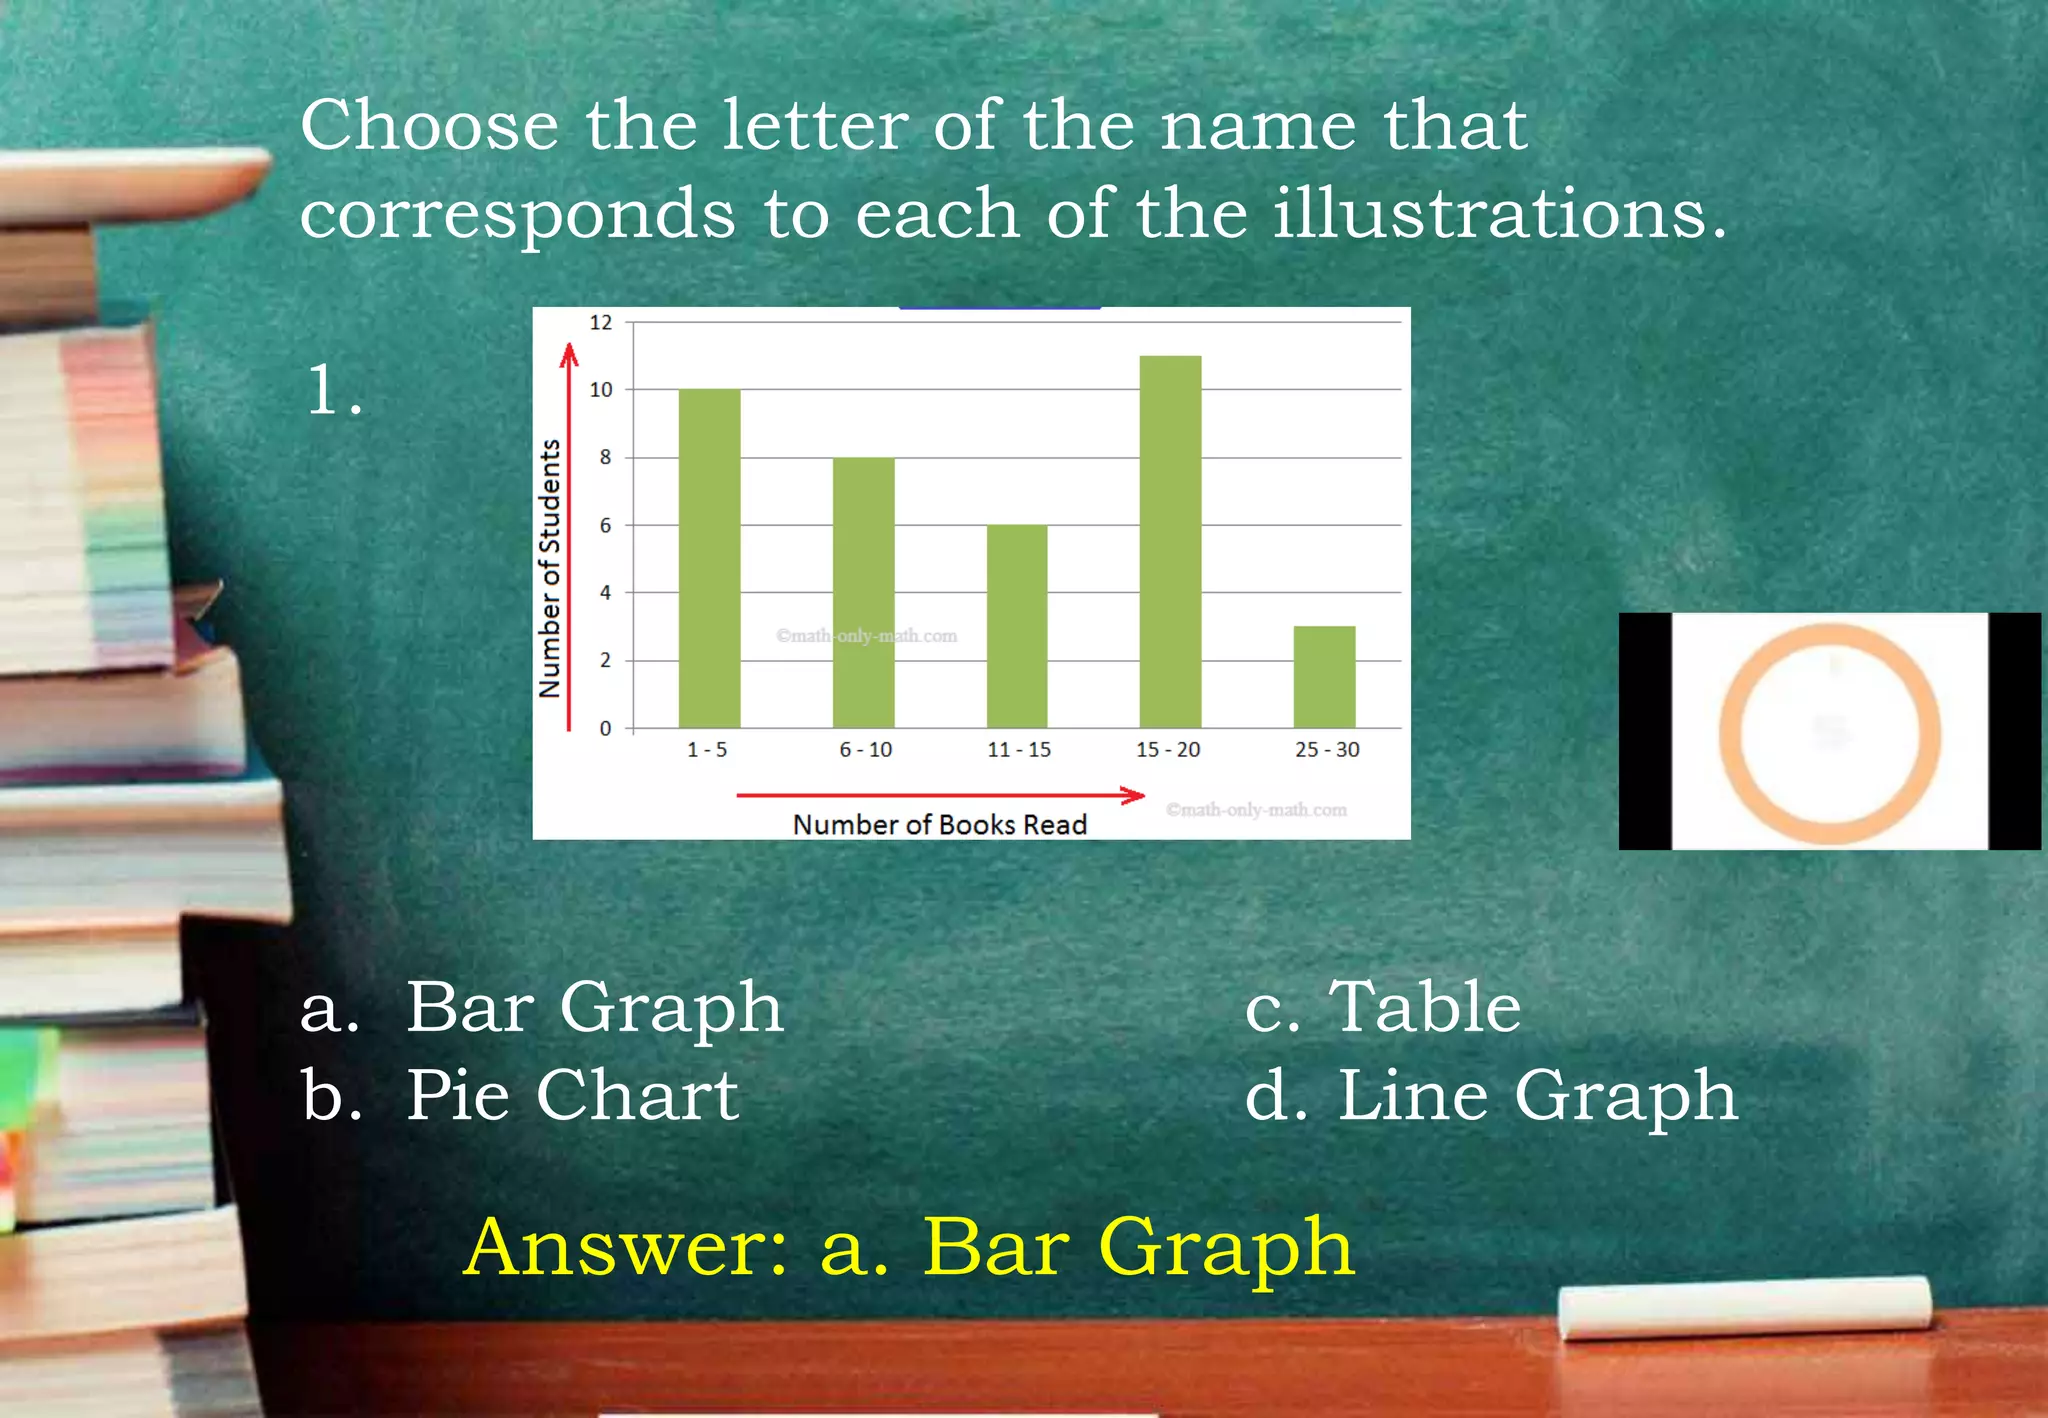
Choose the letterof the name that
corresponds to each of the illustrations.
1.
a. Bar Graph c. Table
b. Pie Chart d. Line Graph
Answer: a. Bar Graph
8.
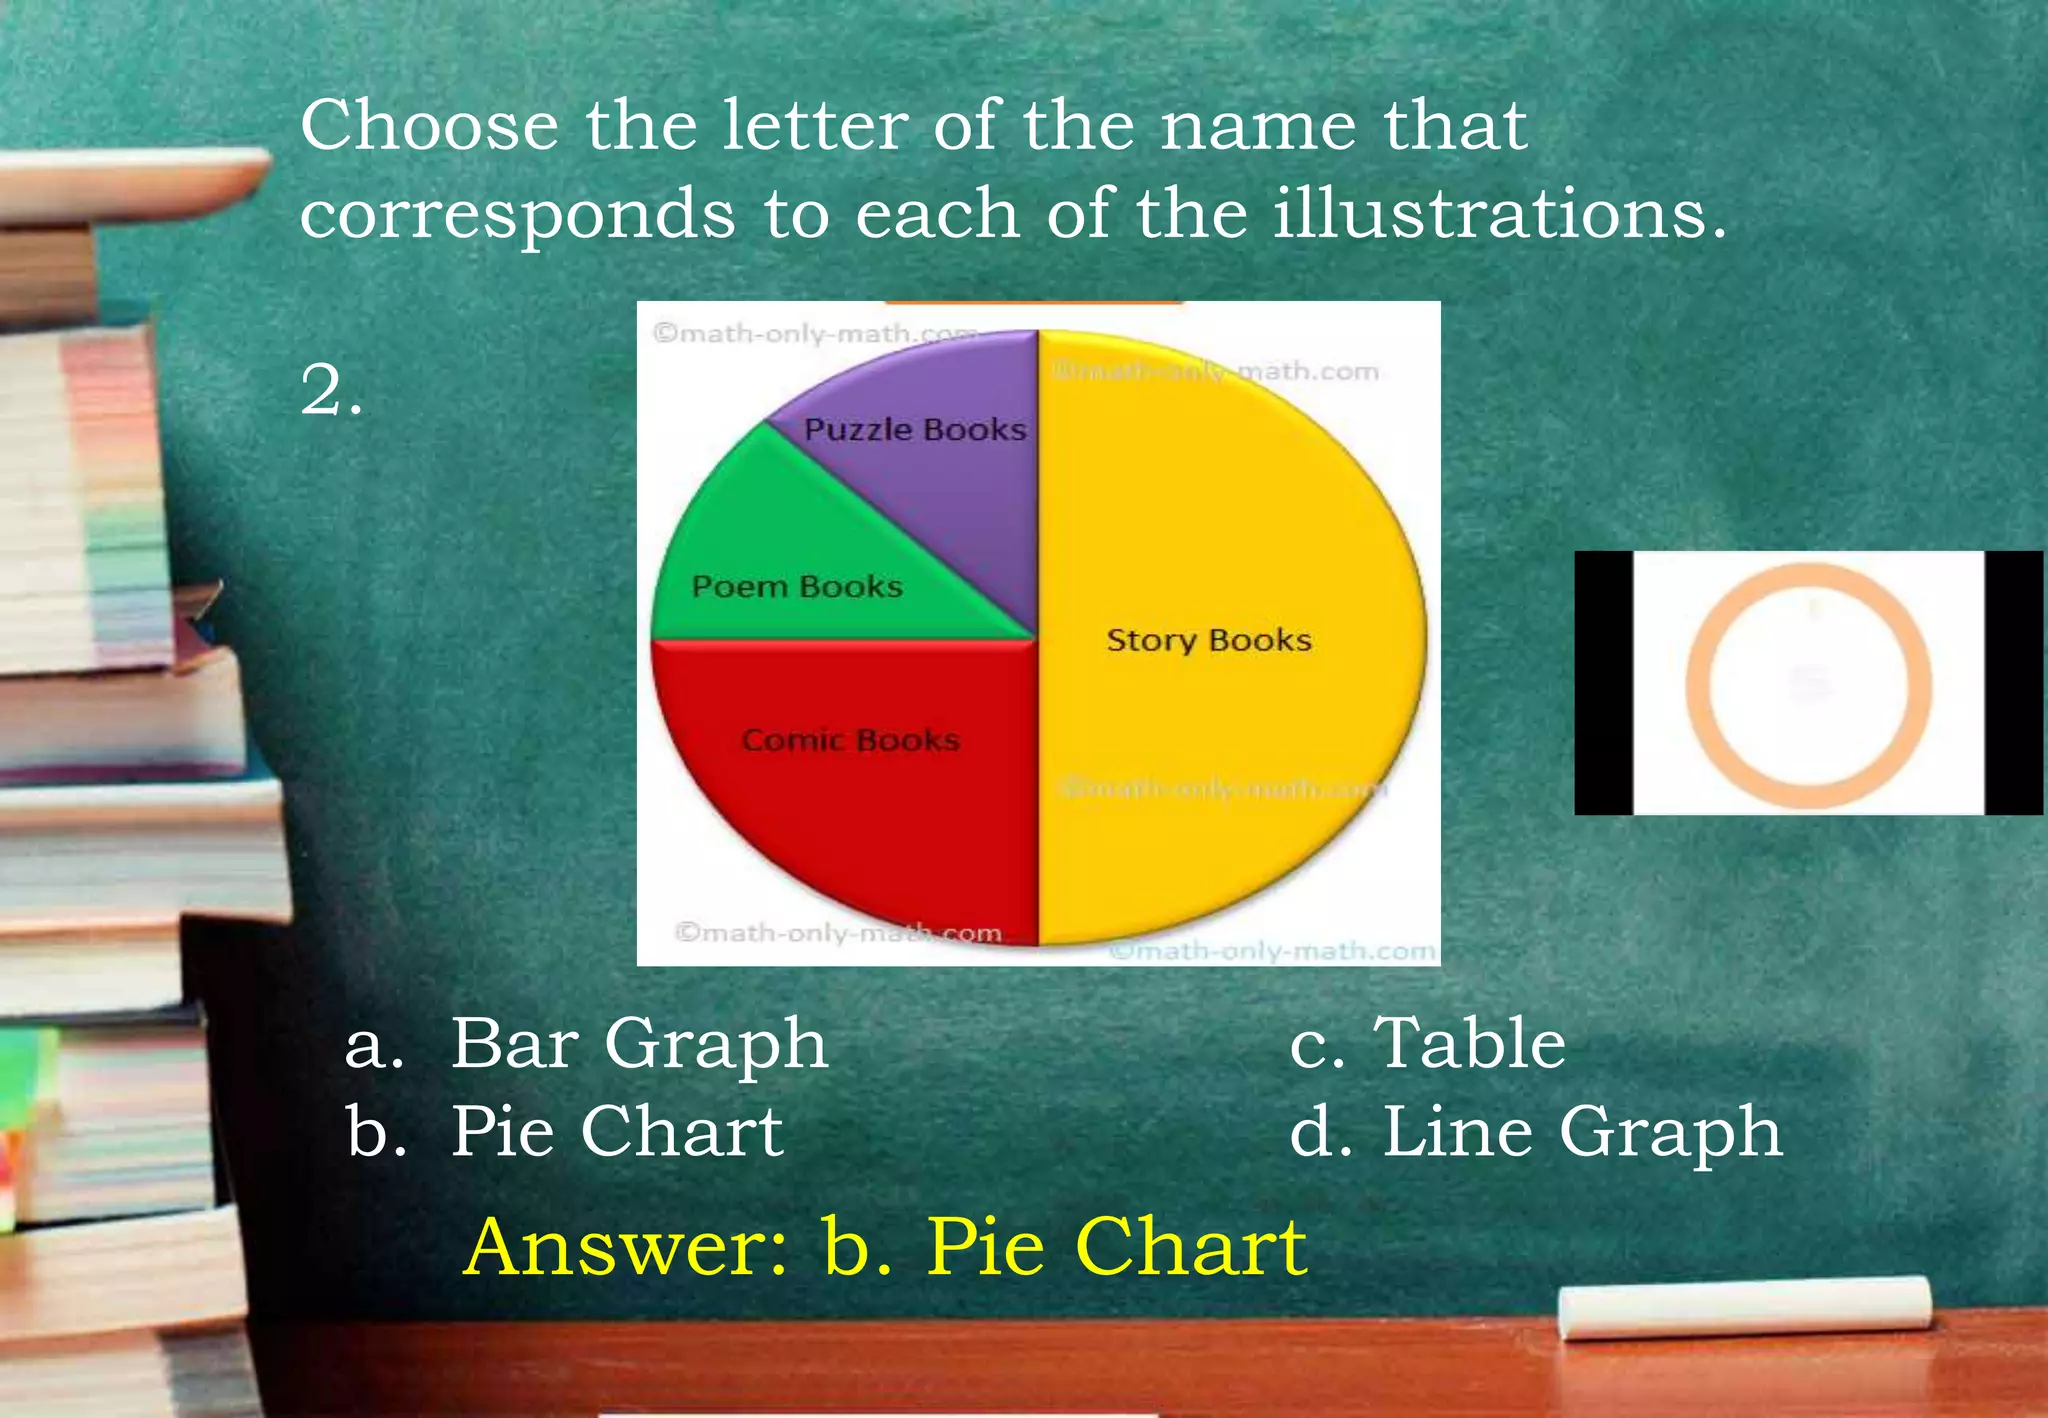
Choose the letterof the name that
corresponds to each of the illustrations.
2.
Answer: b. Pie Chart
a. Bar Graph c. Table
b. Pie Chart d. Line Graph
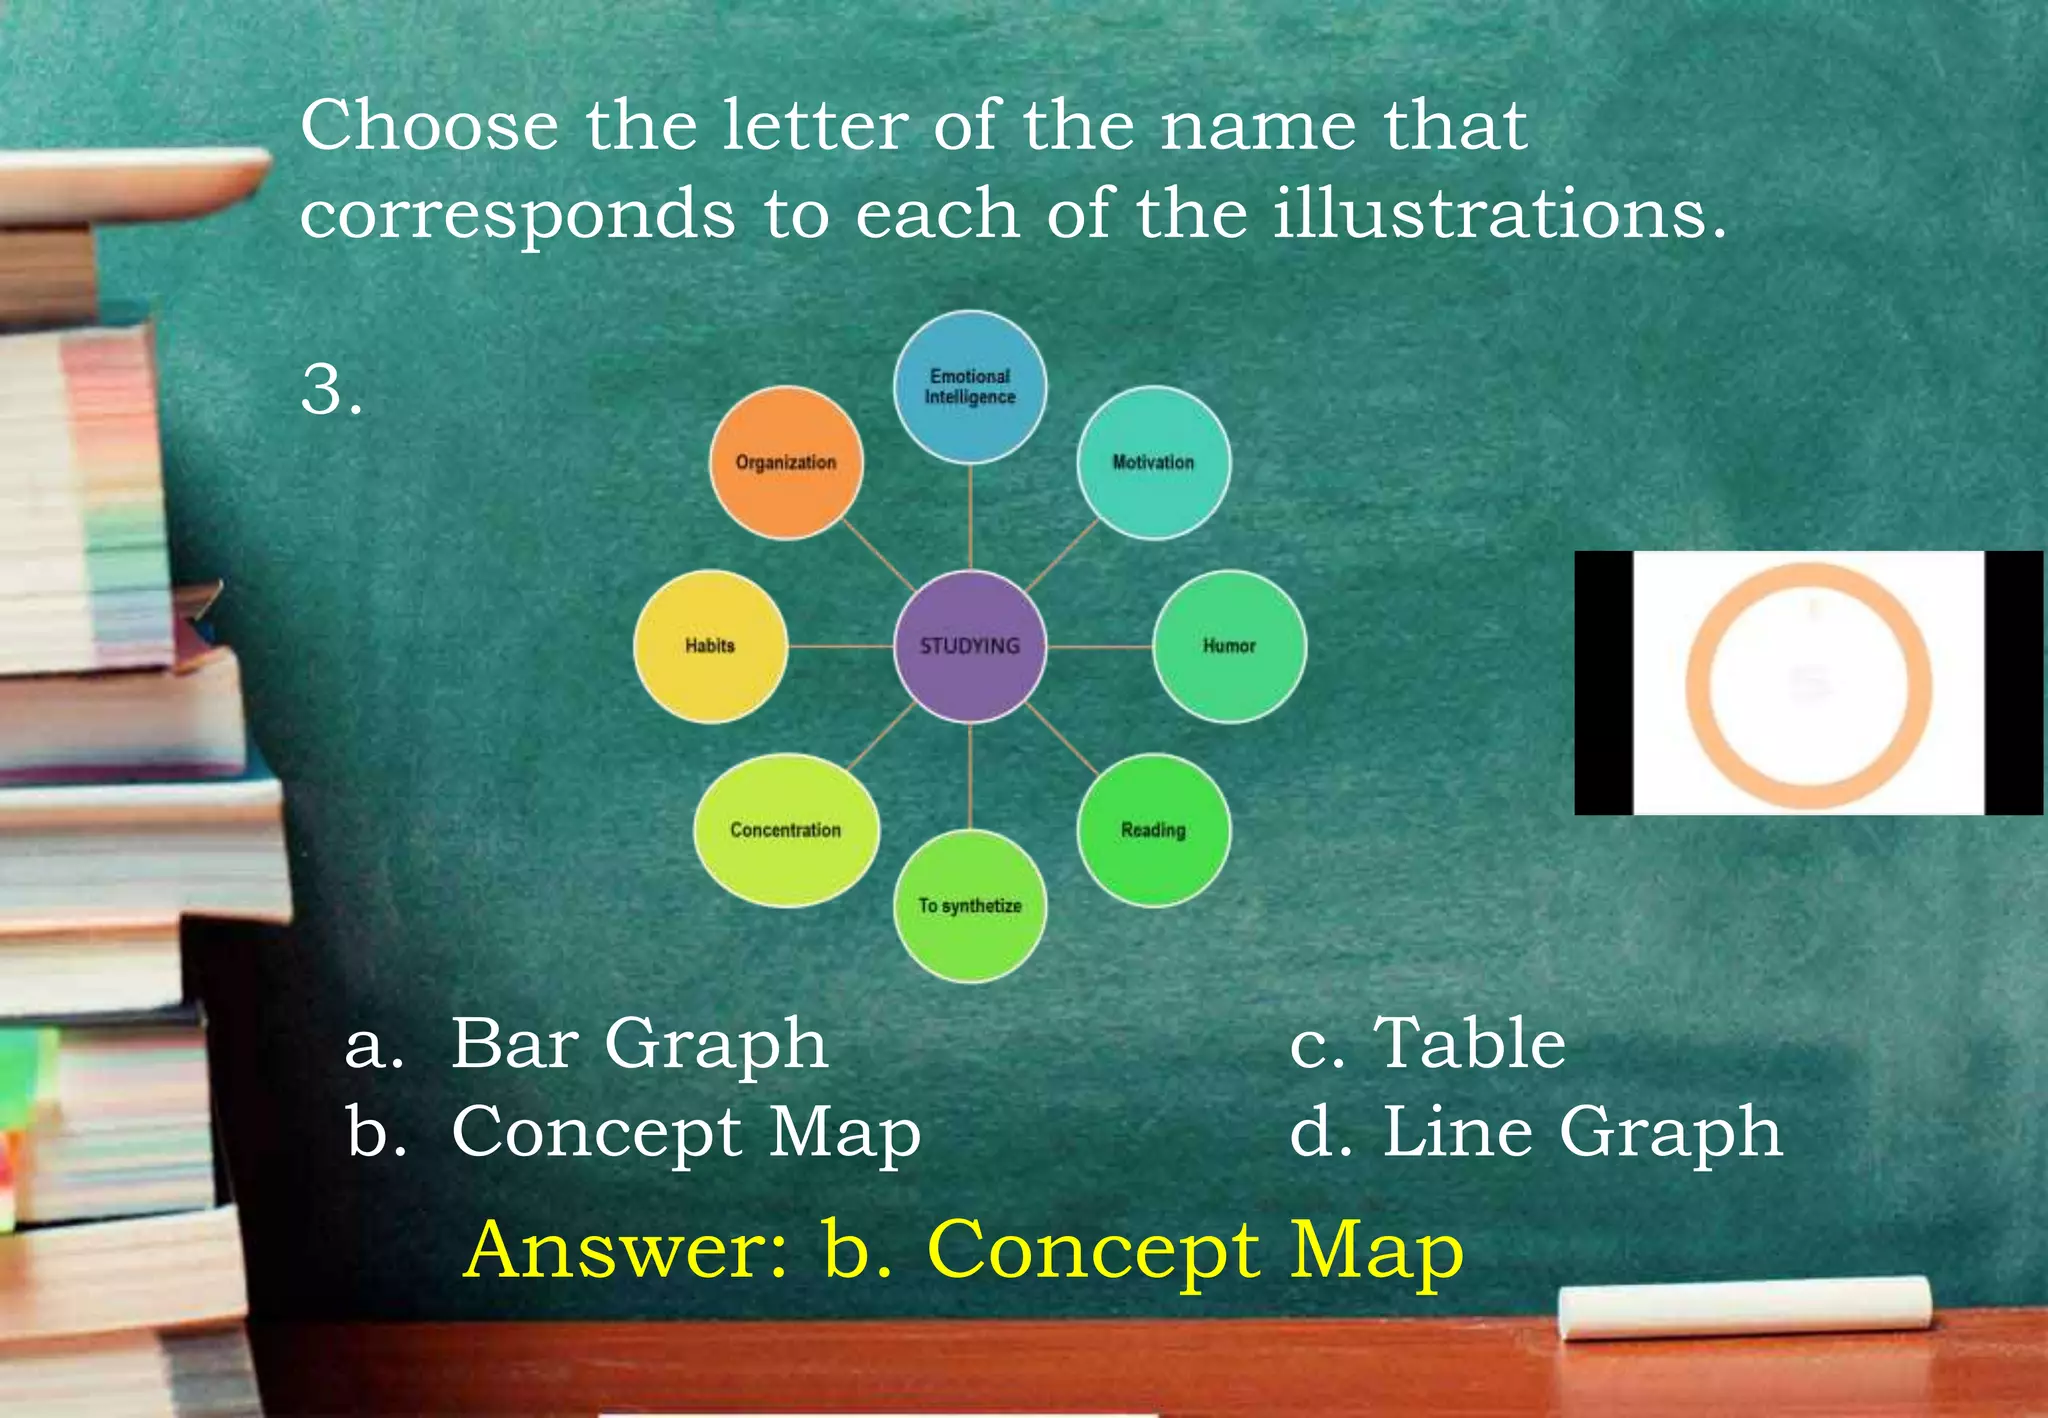
9.
Choose the letterof the name that
corresponds to each of the illustrations.
3.
Answer: b. Concept Map
a. Bar Graph c. Table
b. Concept Map d. Line Graph
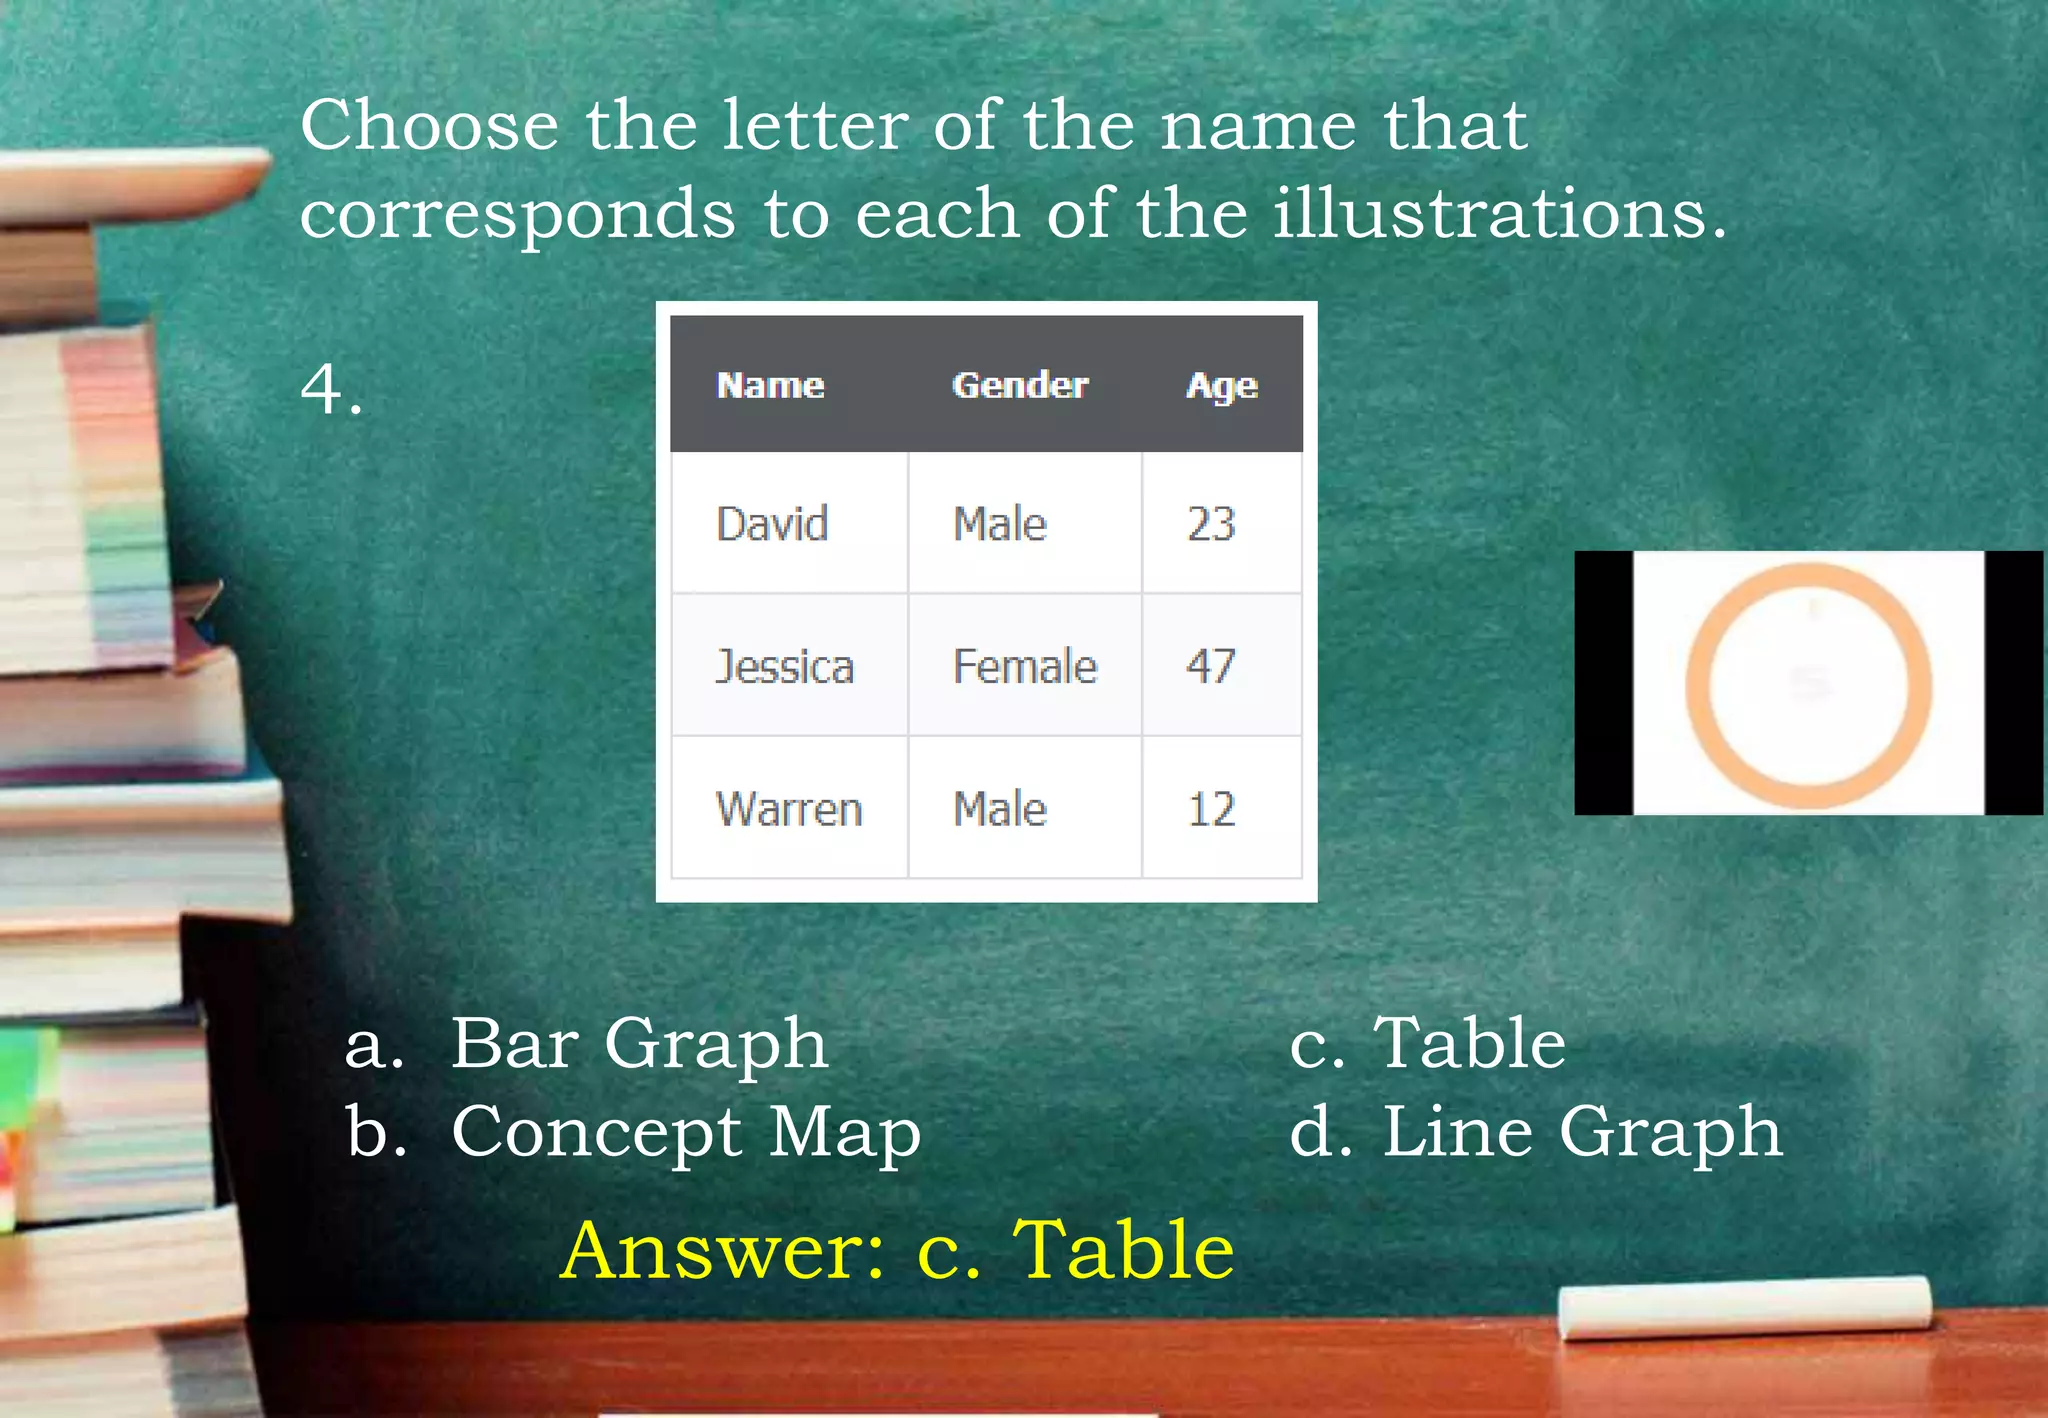
10.
Choose the letterof the name that
corresponds to each of the illustrations.
4.
Answer: c. Table
a. Bar Graph c. Table
b. Concept Map d. Line Graph
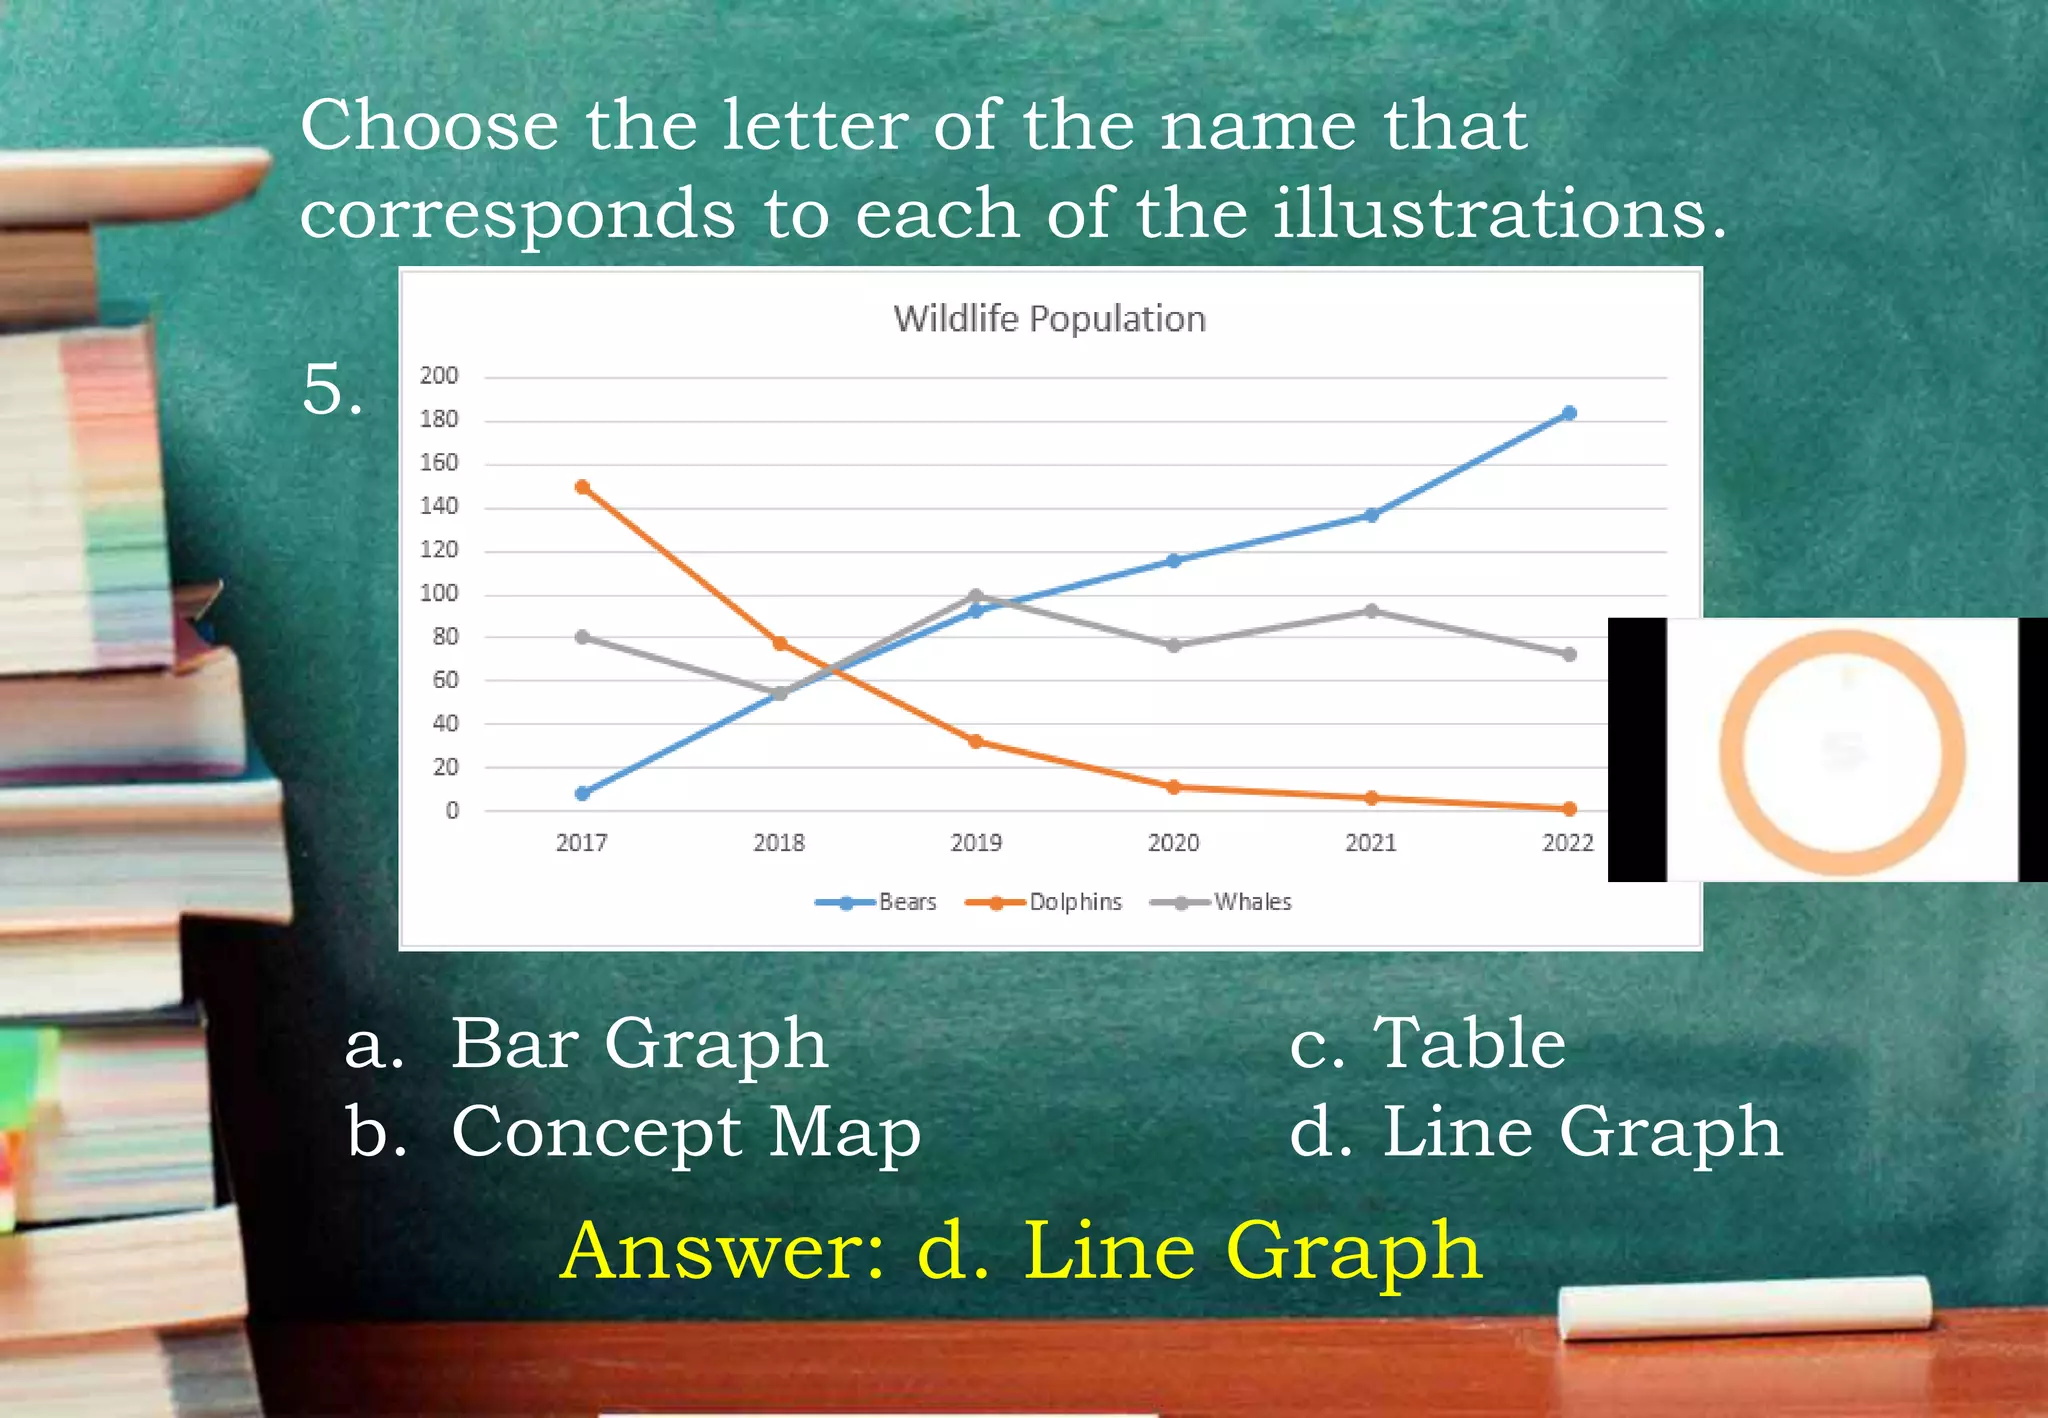
11.
Choose the letterof the name that
corresponds to each of the illustrations.
5.
Answer: d. Line Graph
a. Bar Graph c. Table
b. Concept Map d. Line Graph
12.
Bar graphs, Piecharts, Concept
maps, tables, and line graphs are
examples of visual-verbal
illustrations or visual aids.
Visual-verbal illustrations are the
ways of presenting information in a
simple and attractive manner to
catch the readers’ interests.
13.
These illustrations helpexplain
concepts easily using graphs, maps,
tables, infographics, charts and
the like.
Today, we will discuss some of the
most commonly used visual-verbal
illustrations.
14.
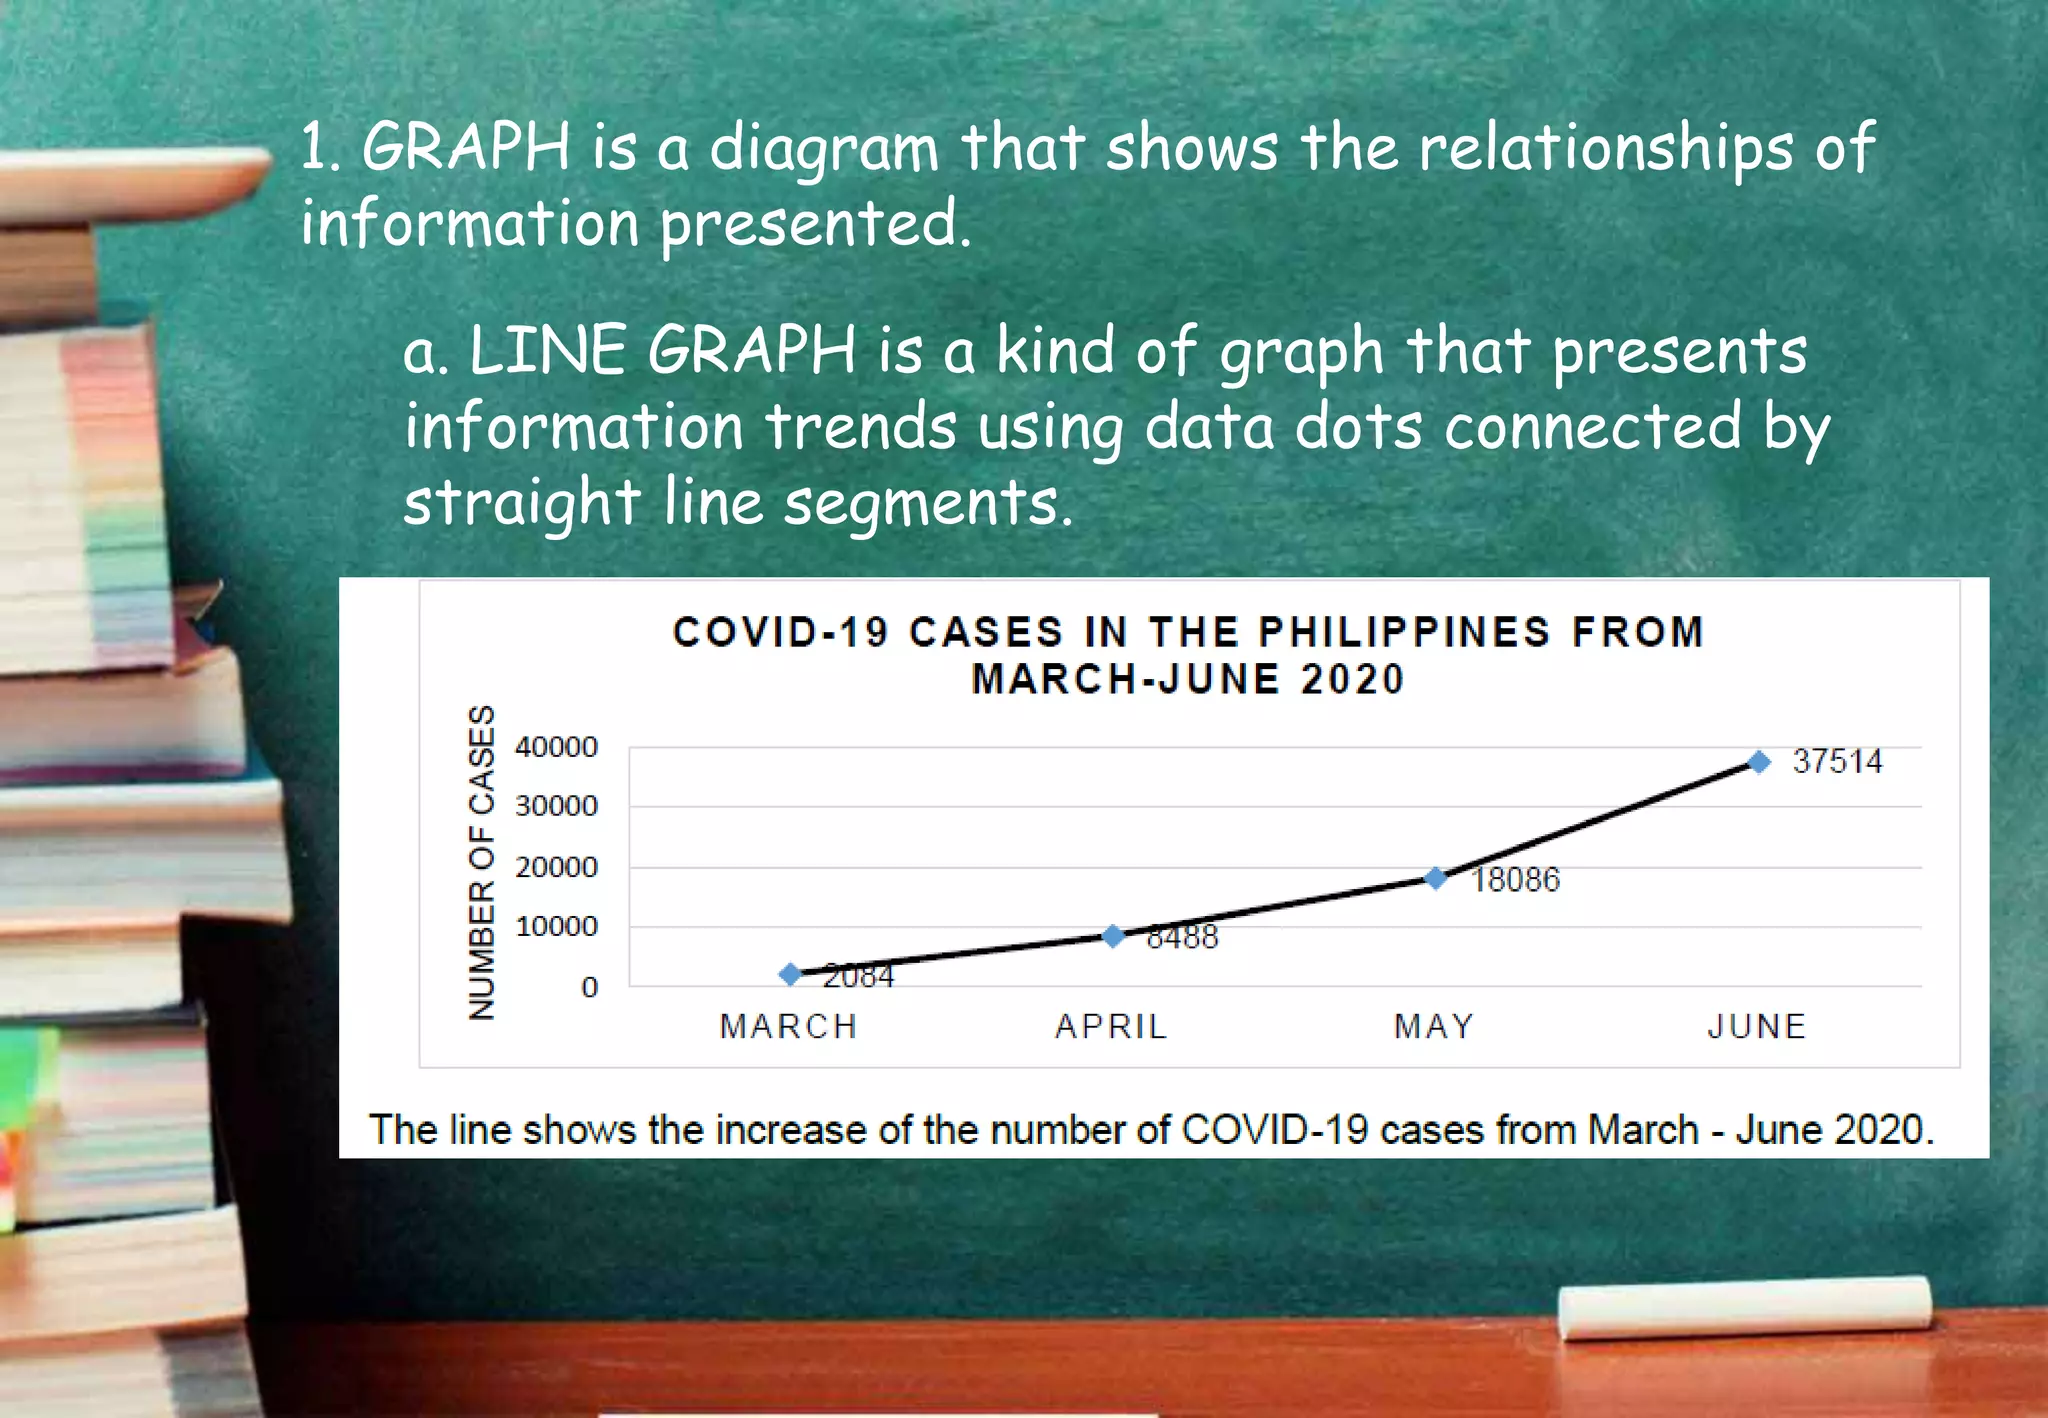
1. GRAPH isa diagram that shows the relationships of
information presented.
a. LINE GRAPH is a kind of graph that presents
information trends using data dots connected by
straight line segments.
15.
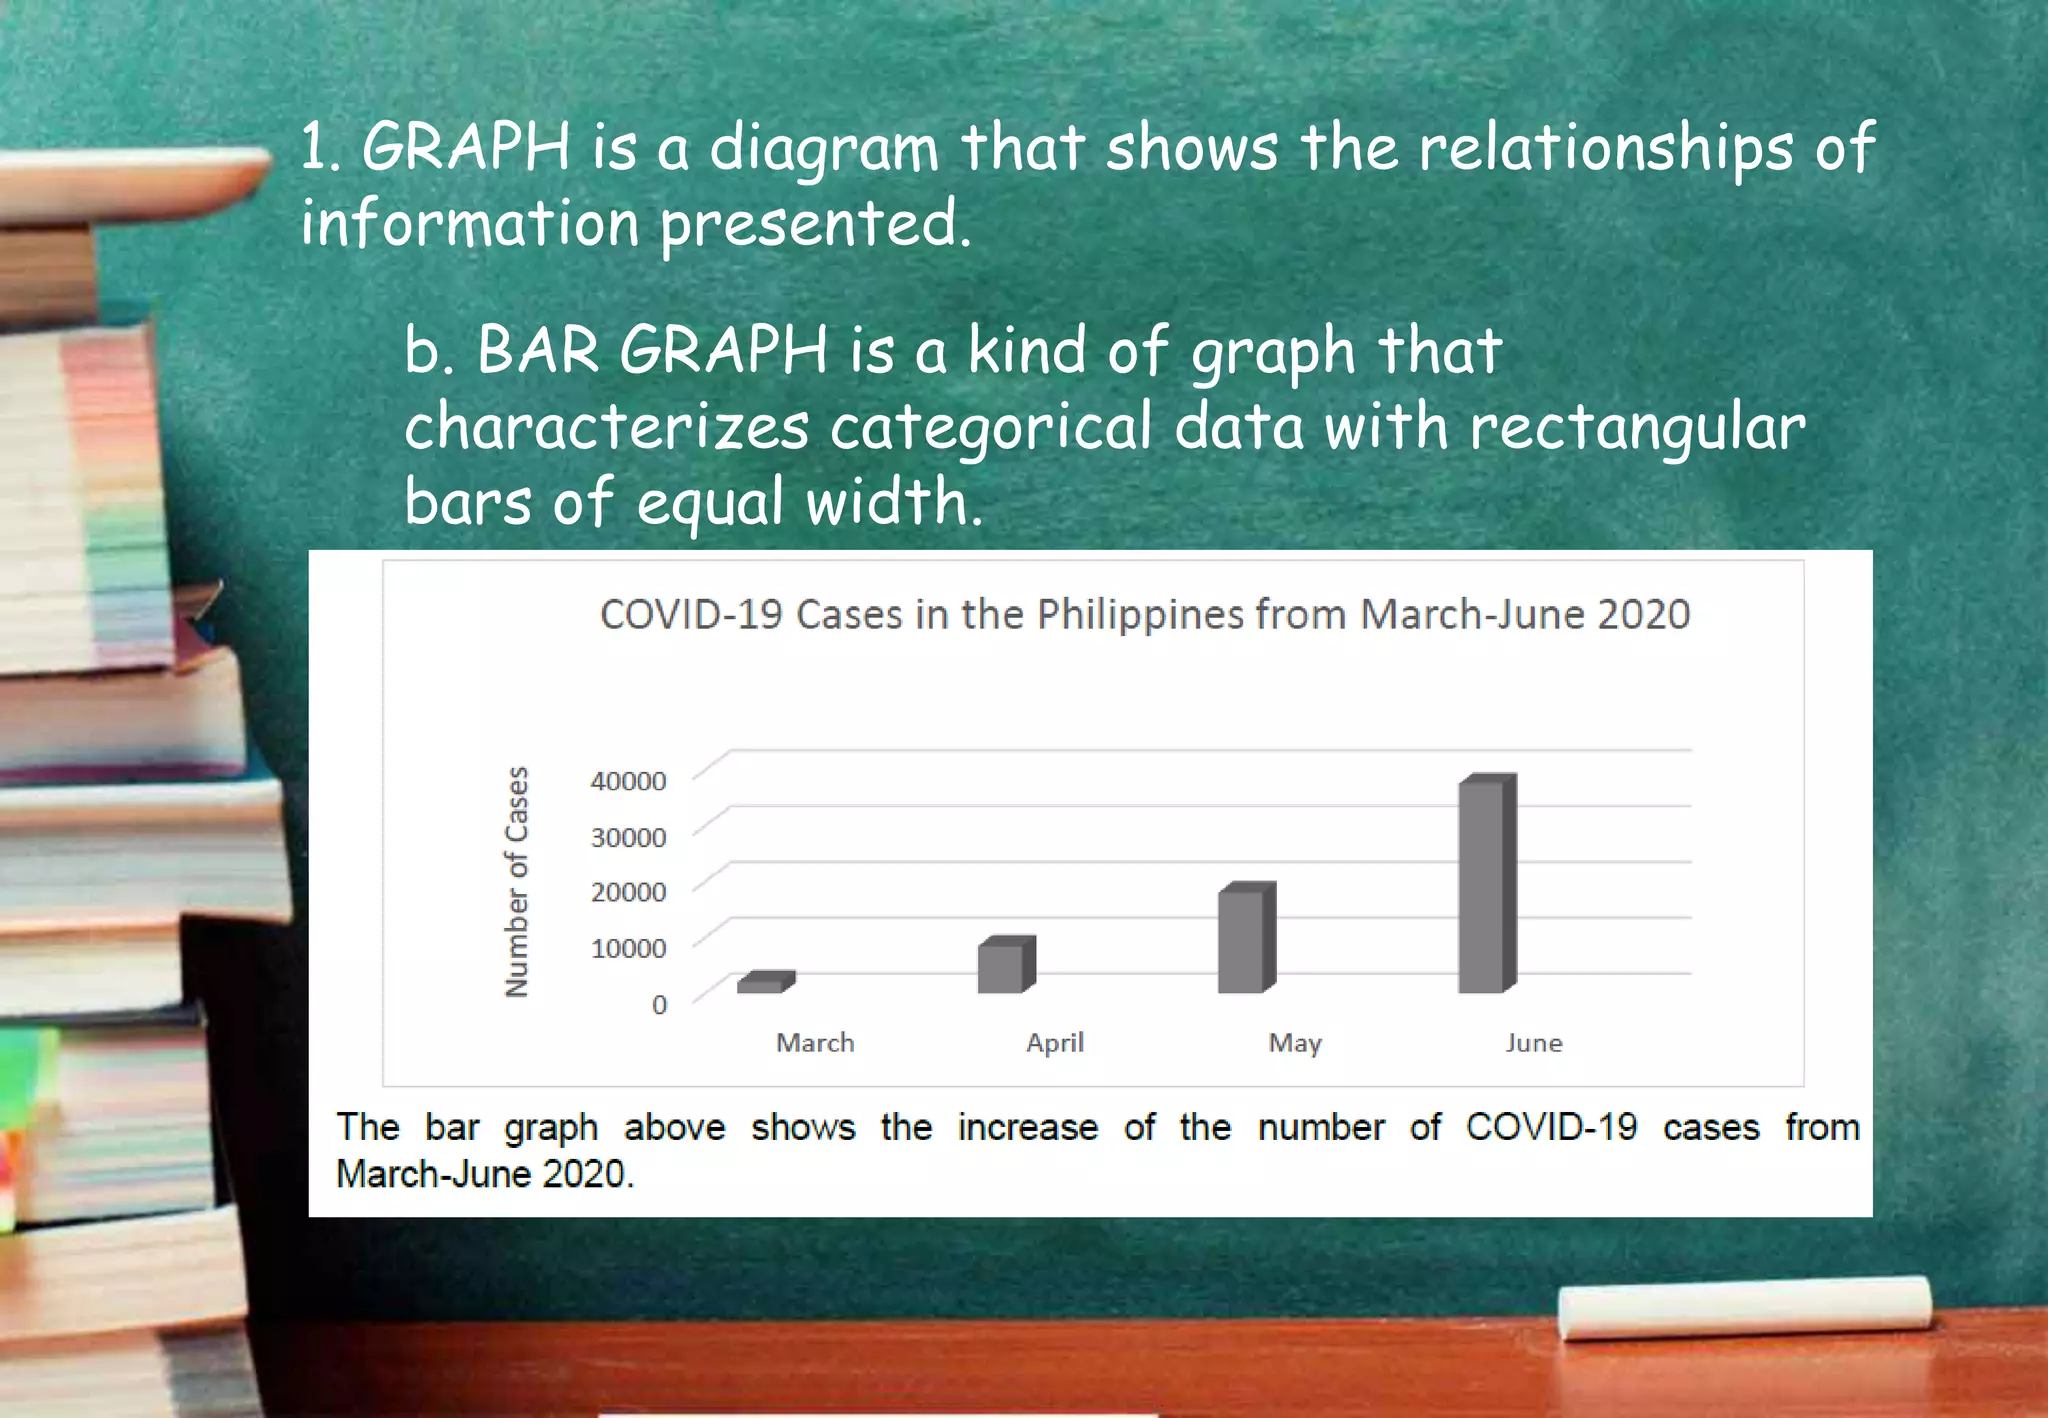
1. GRAPH isa diagram that shows the relationships of
information presented.
b. BAR GRAPH is a kind of graph that
characterizes categorical data with rectangular
bars of equal width.
16.
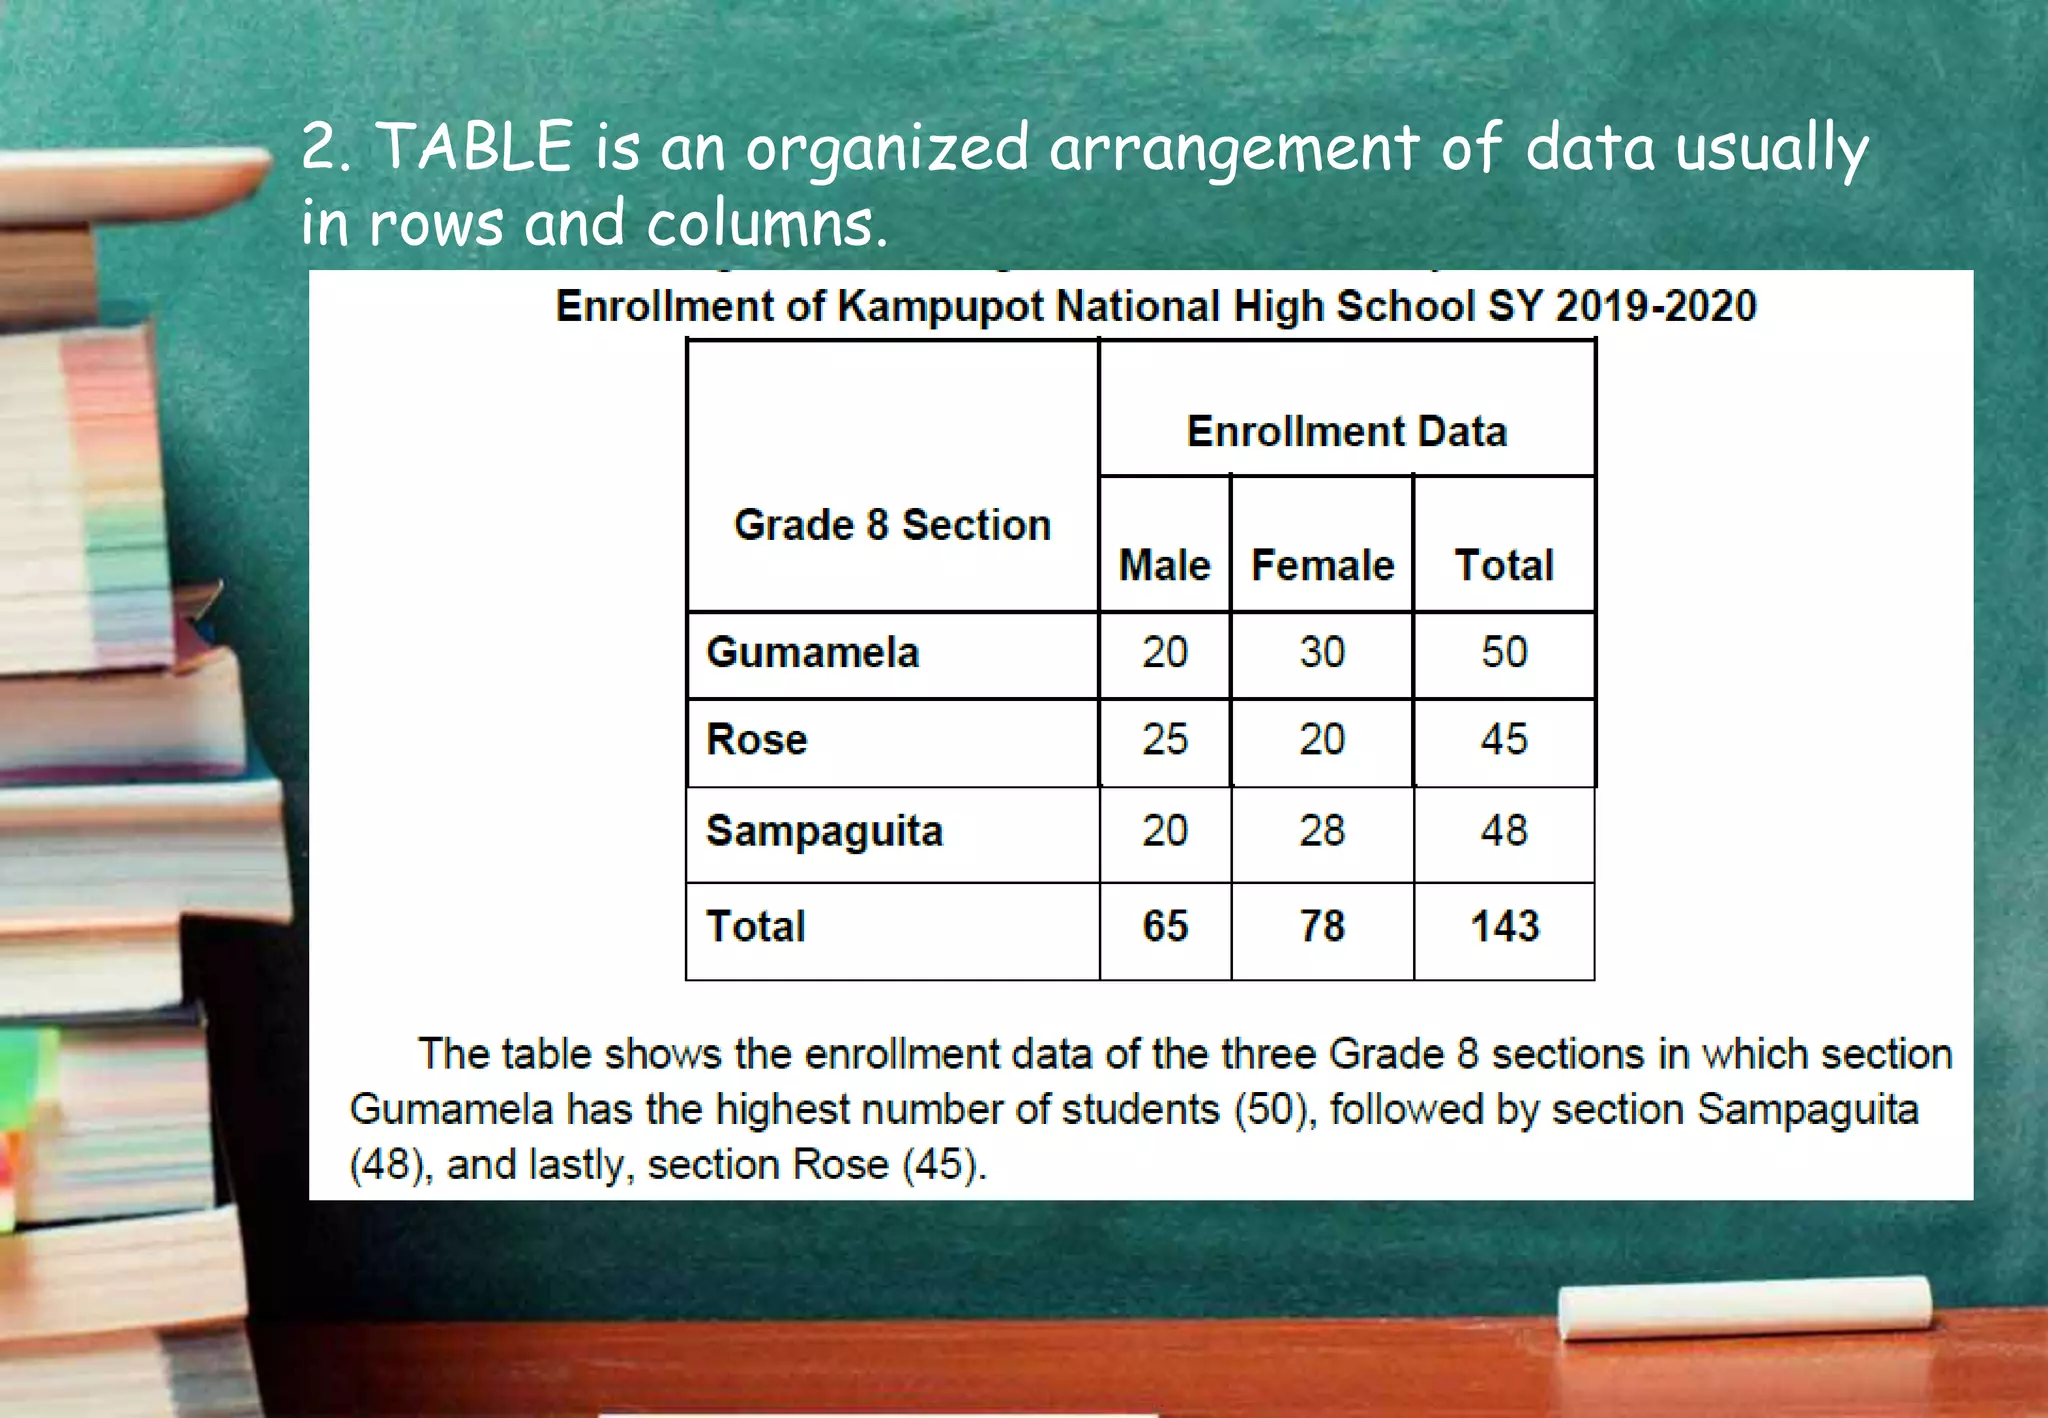
2. TABLE isan organized arrangement of data usually
in rows and columns.
17.
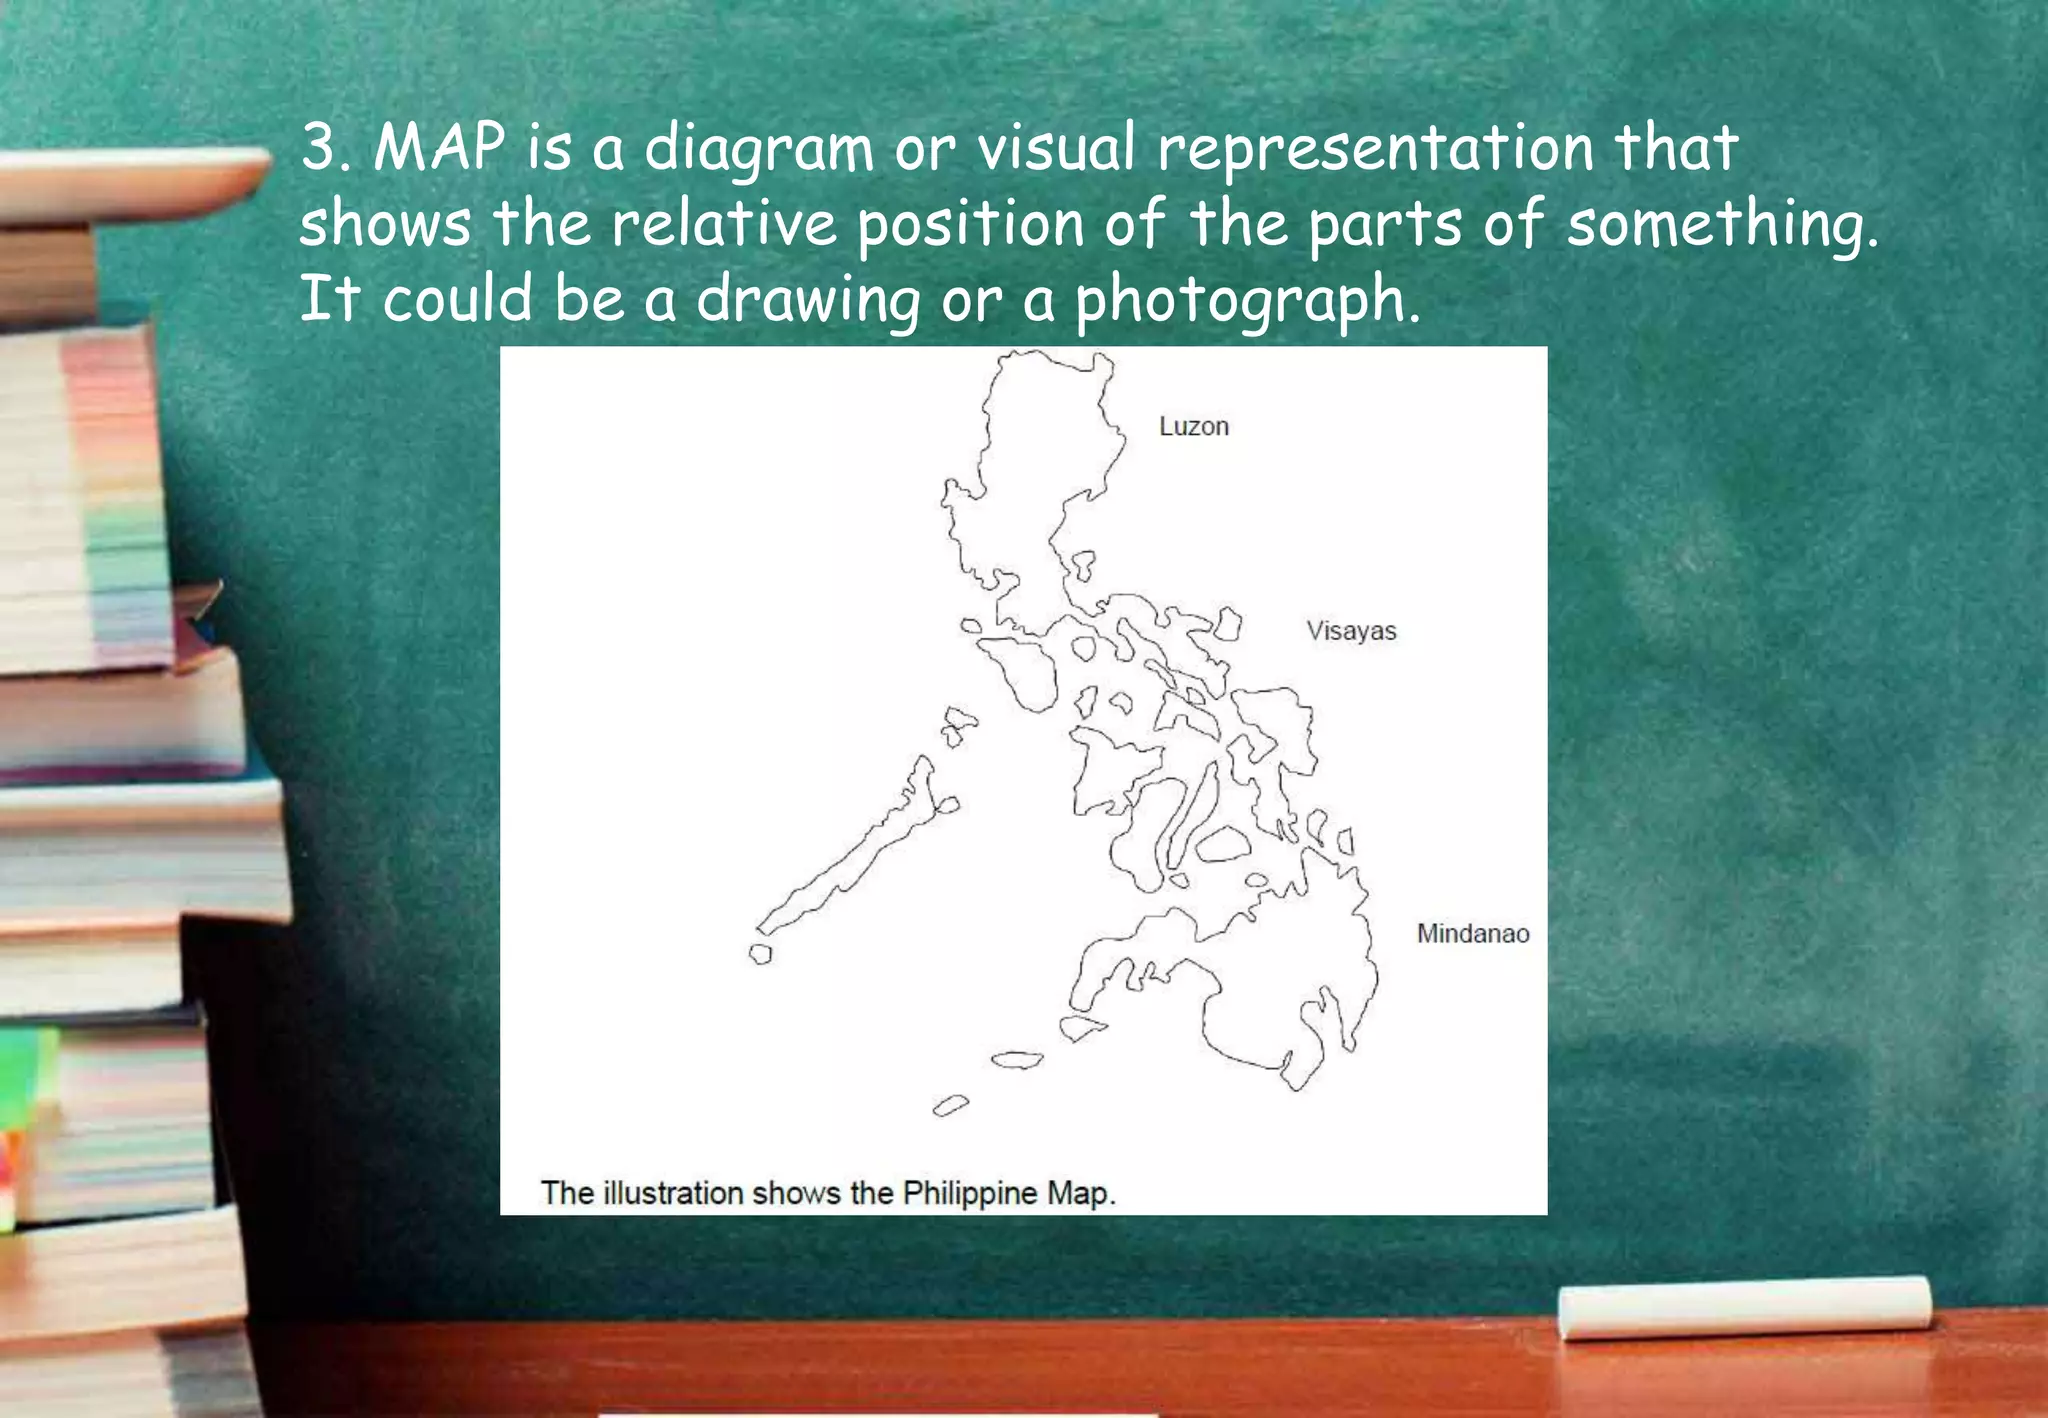
3. MAP isa diagram or visual representation that
shows the relative position of the parts of something.
It could be a drawing or a photograph.
18.
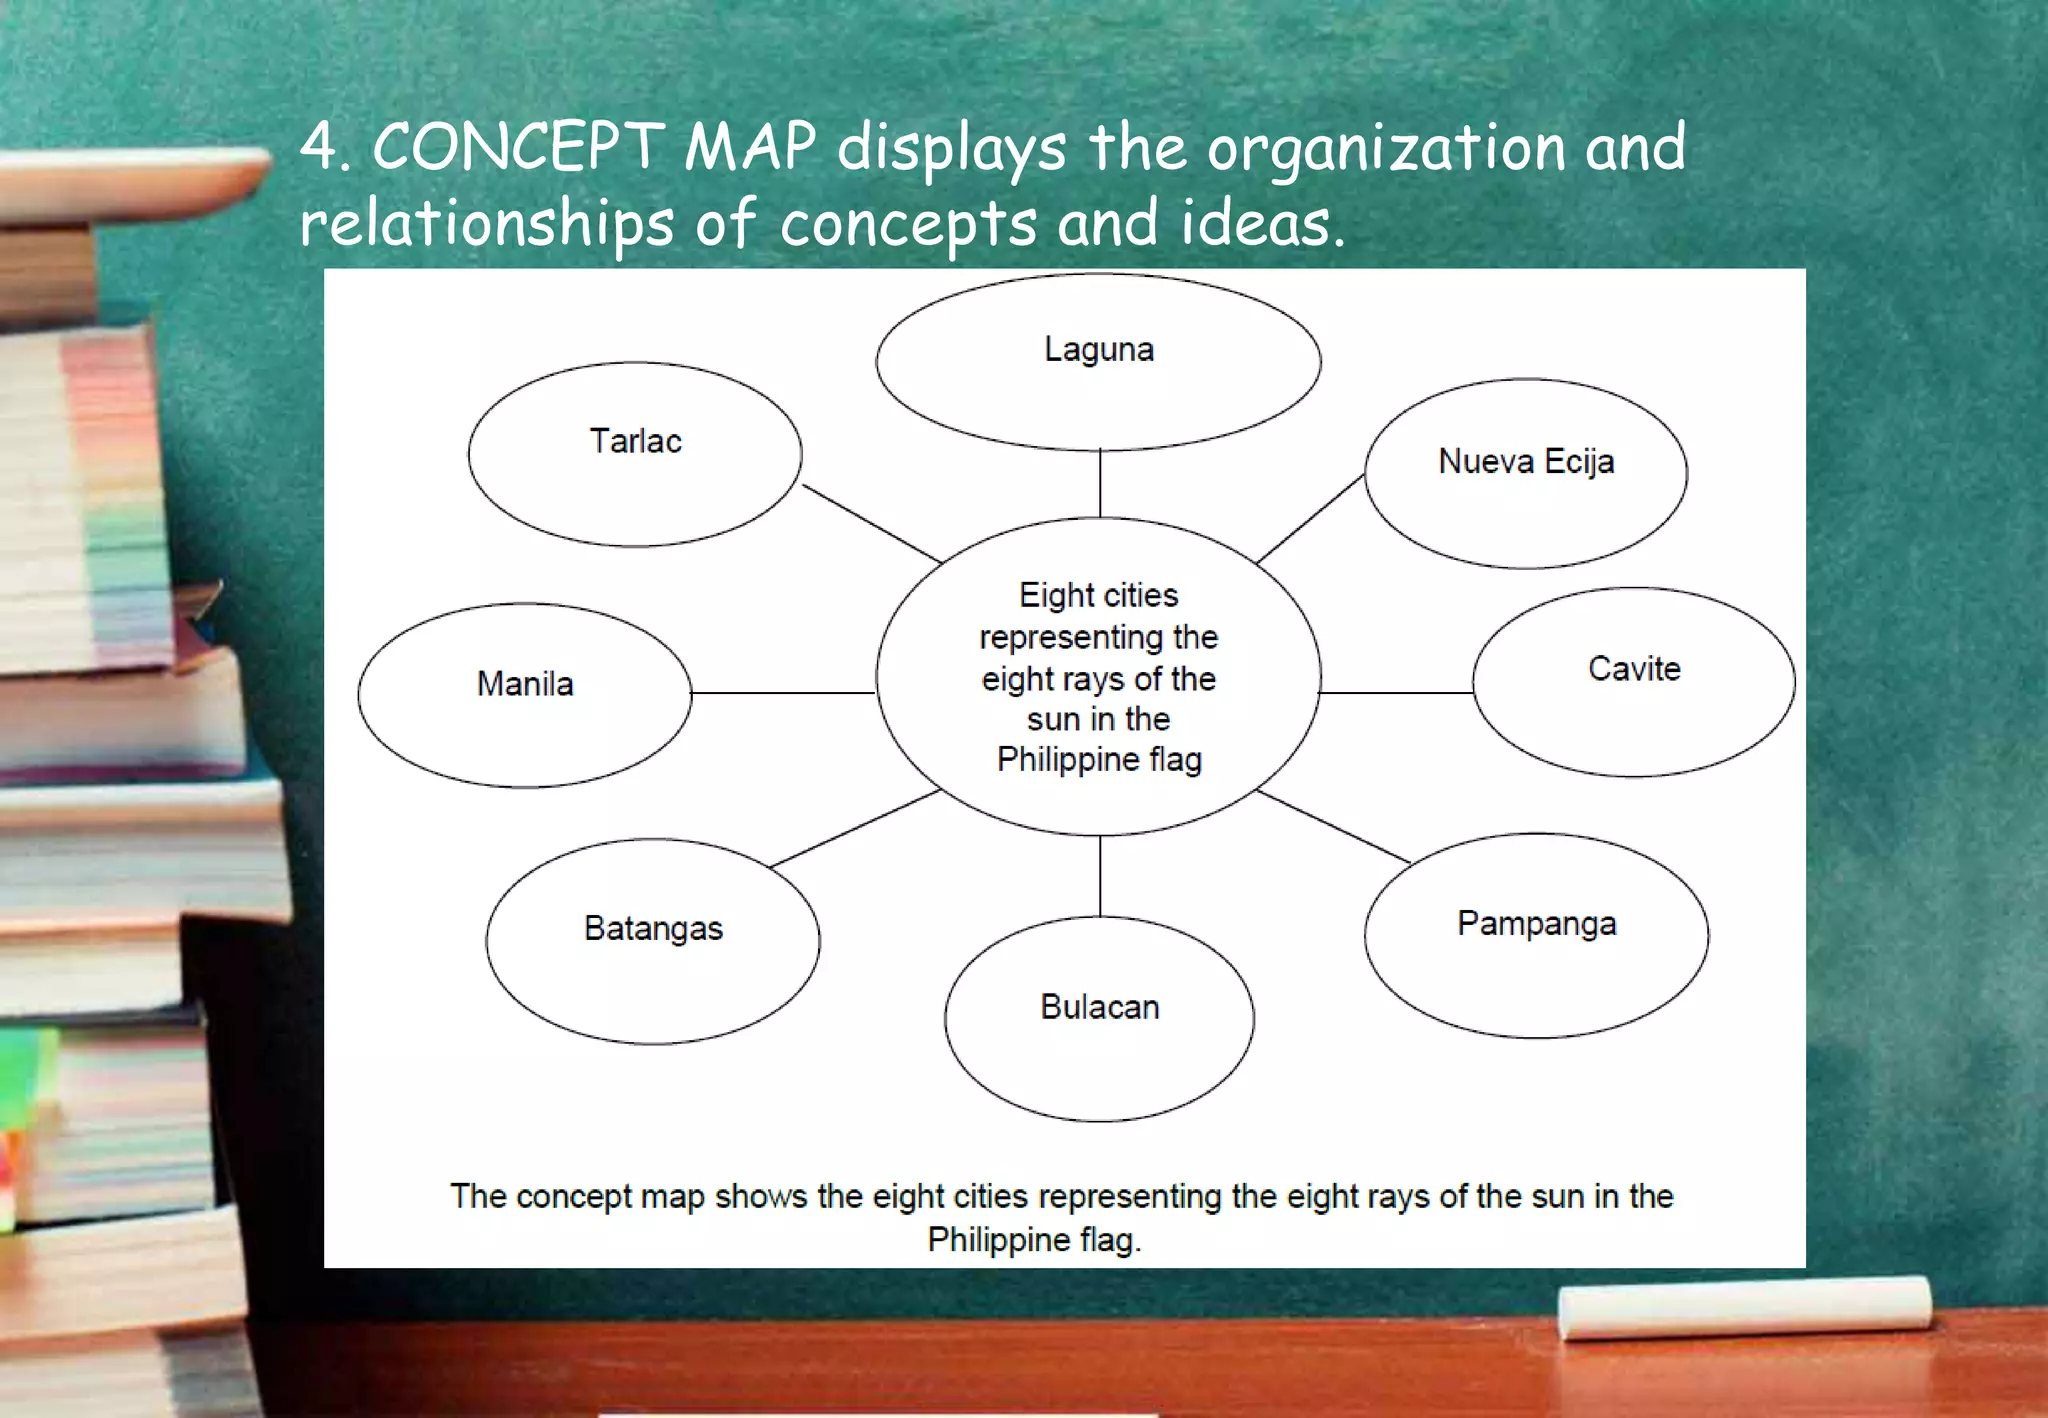
4. CONCEPT MAPdisplays the organization and
relationships of concepts and ideas.
19.
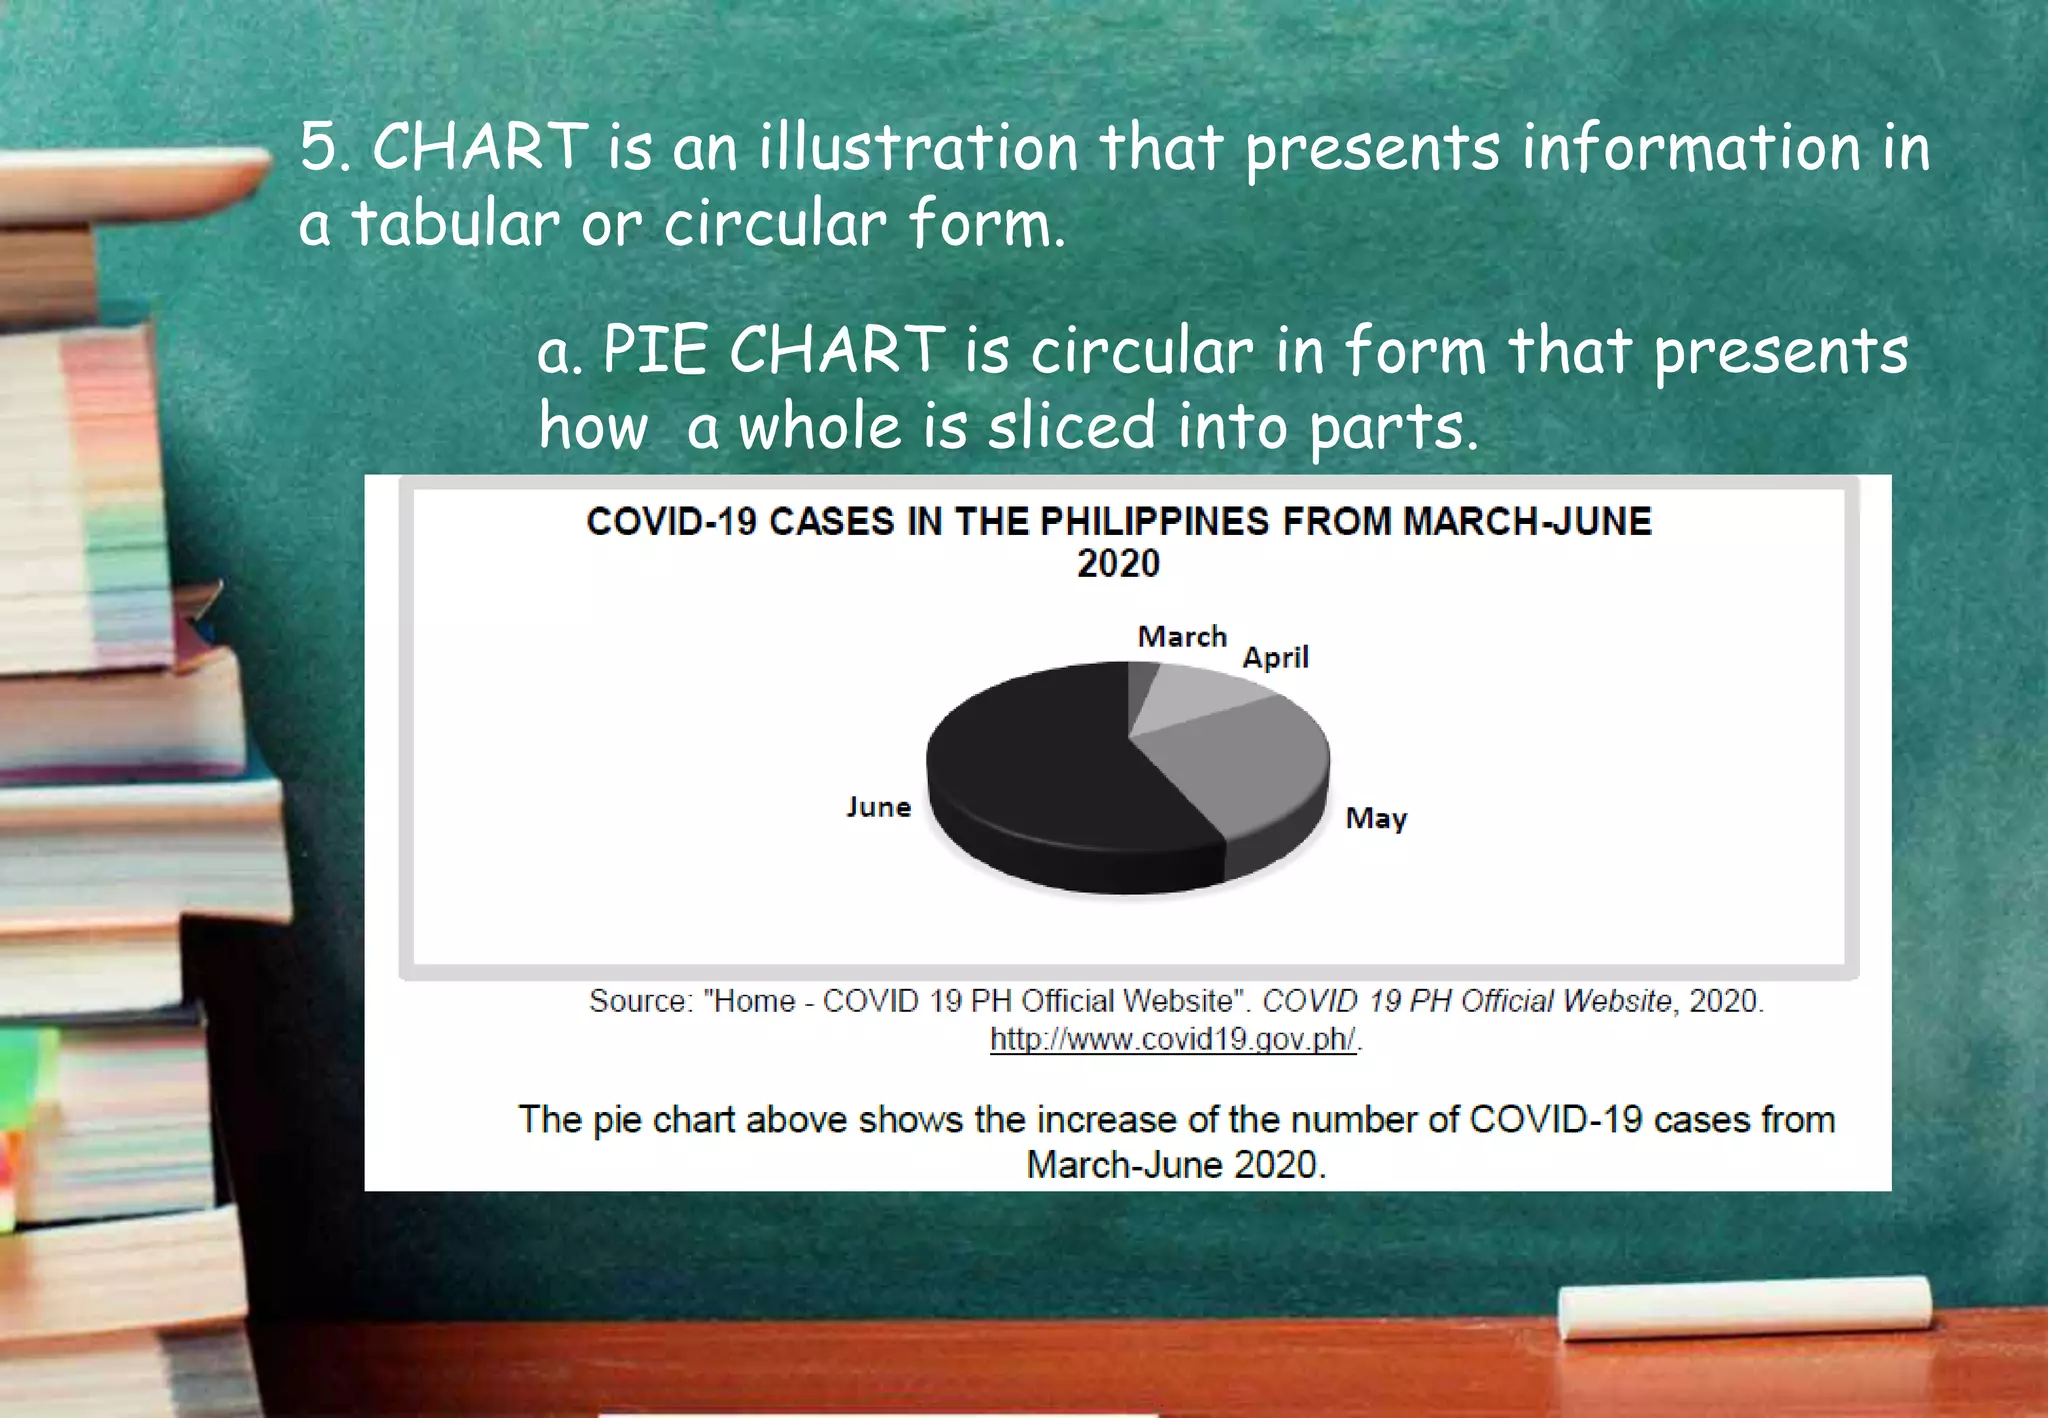
5. CHART isan illustration that presents information in
a tabular or circular form.
a. PIE CHART is circular in form that presents
how a whole is sliced into parts.
20.
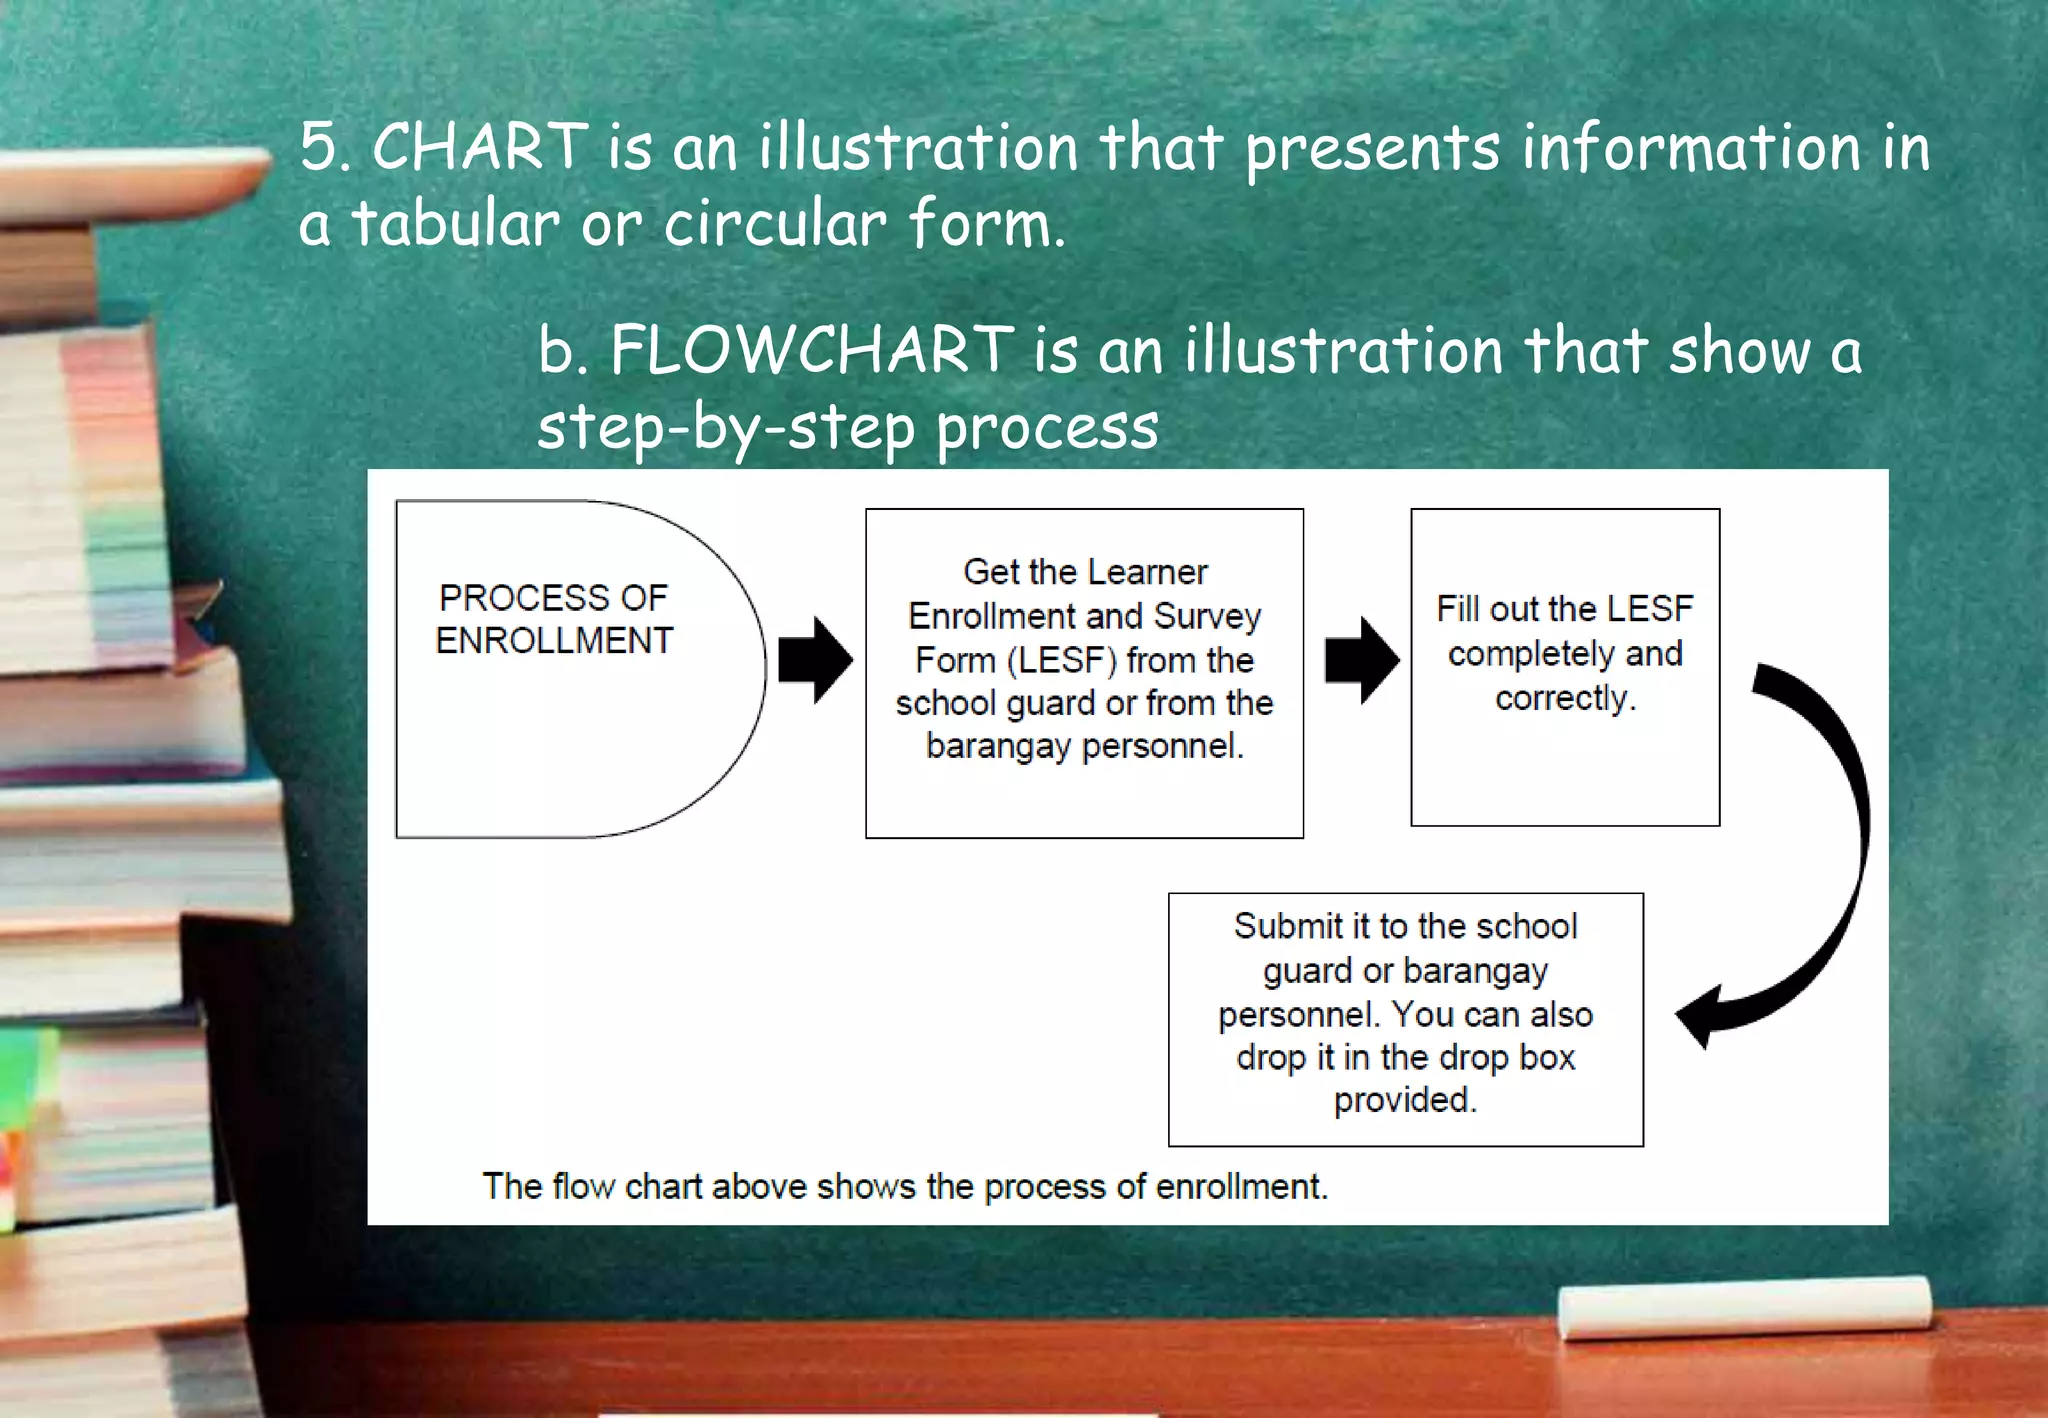
5. CHART isan illustration that presents information in
a tabular or circular form.
b. FLOWCHART is an illustration that show a
step-by-step process
21.
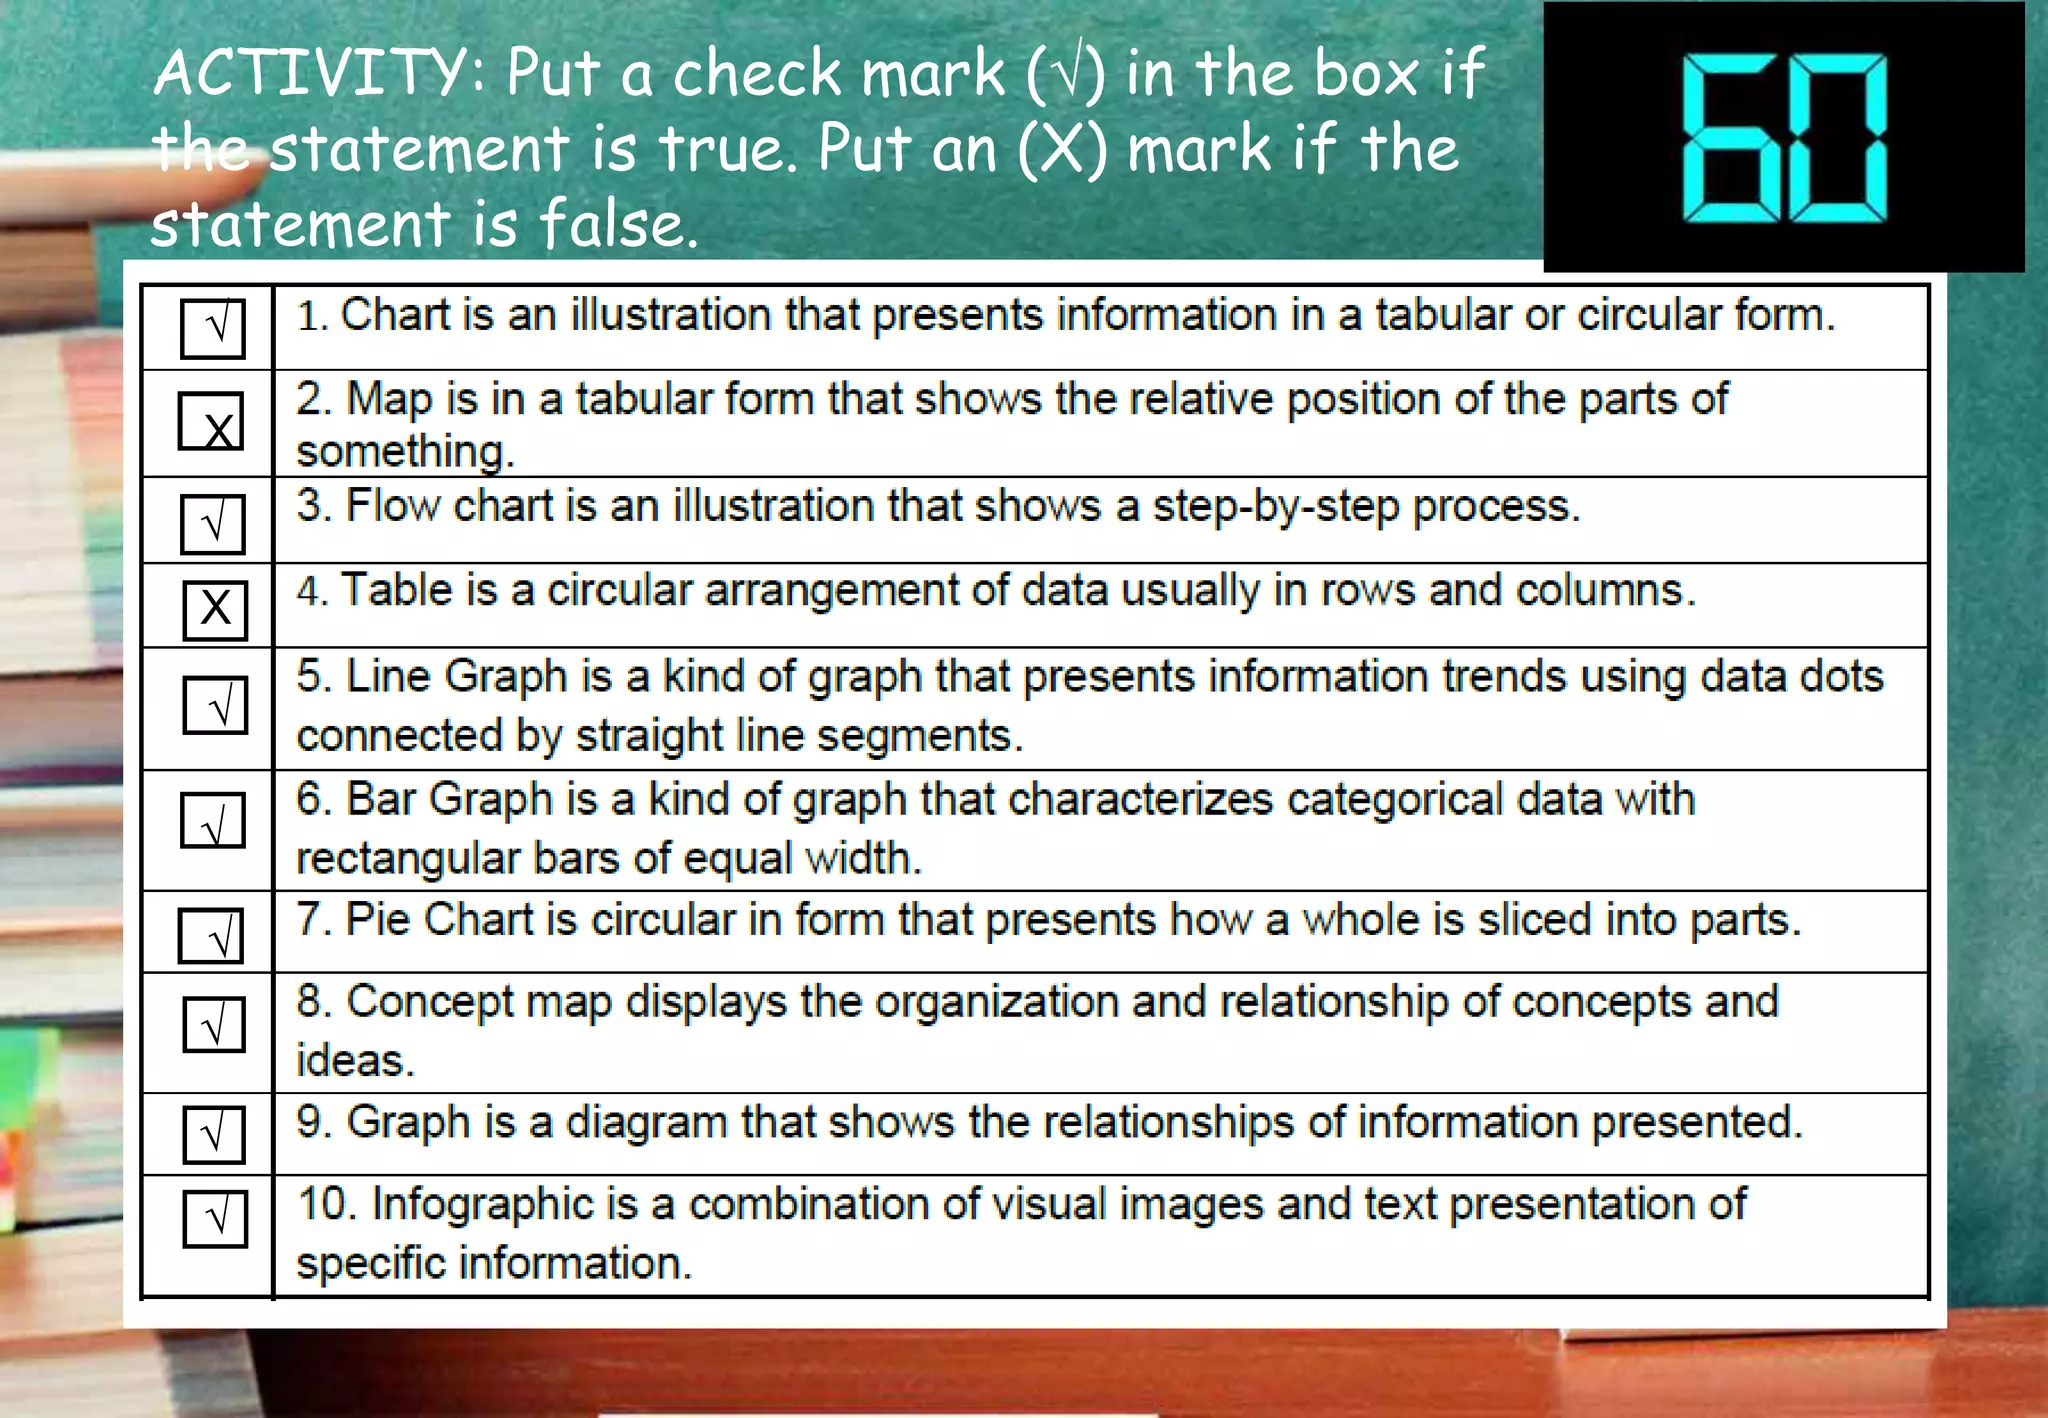
ACTIVITY: Put acheck mark (√) in the box if
the statement is true. Put an (X) mark if the
statement is false.
√
√
√
√
√
√
√
√
X
X
22.
6. INFOGRAPHIC isa combination of visual images and
text presentation of specific information.
What makes these visual-
verbal illustrations
important?
Visual-verbal illustrations make
complex ideas from expository
texts simpler and easier to
understand
Let’s try to do this activity…
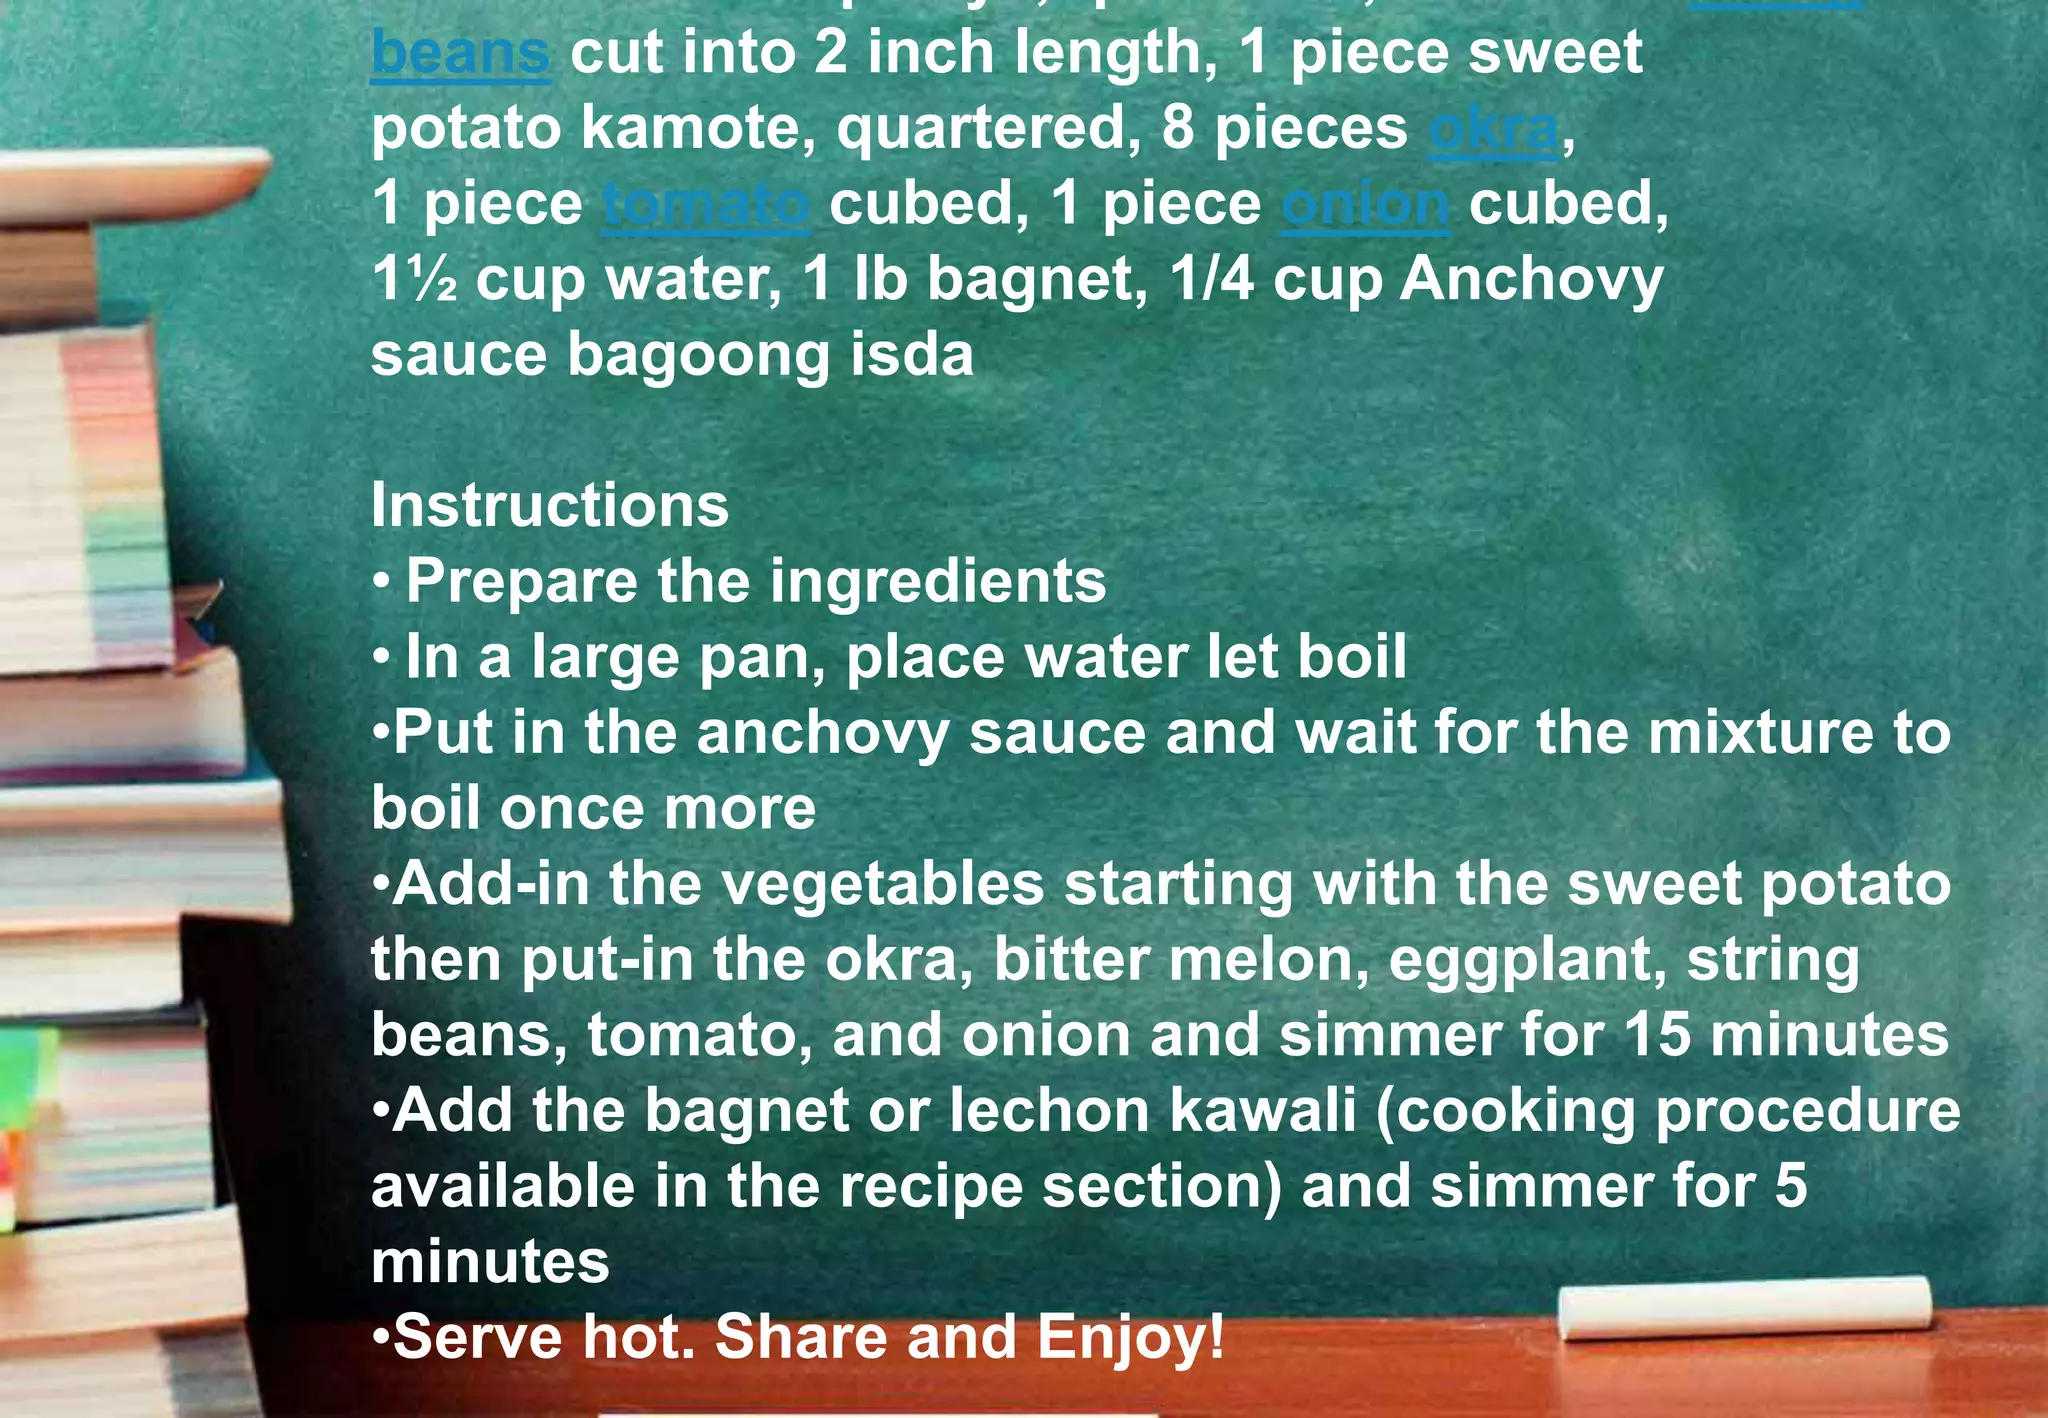
beans cut into2 inch length, 1 piece sweet
potato kamote, quartered, 8 pieces okra,
1 piece tomato cubed, 1 piece onion cubed,
1½ cup water, 1 lb bagnet, 1/4 cup Anchovy
sauce bagoong isda
Instructions
• Prepare the ingredients
• In a large pan, place water let boil
•Put in the anchovy sauce and wait for the mixture to
boil once more
•Add-in the vegetables starting with the sweet potato
then put-in the okra, bitter melon, eggplant, string
beans, tomato, and onion and simmer for 15 minutes
•Add the bagnet or lechon kawali (cooking procedure
available in the recipe section) and simmer for 5
minutes
•Serve hot. Share and Enjoy!
Make a FLOWCHART
on How to cook
Pinakbet.
Draw your flow chart
in a clean sheet of
short bond paper to
be submitted later.
31.
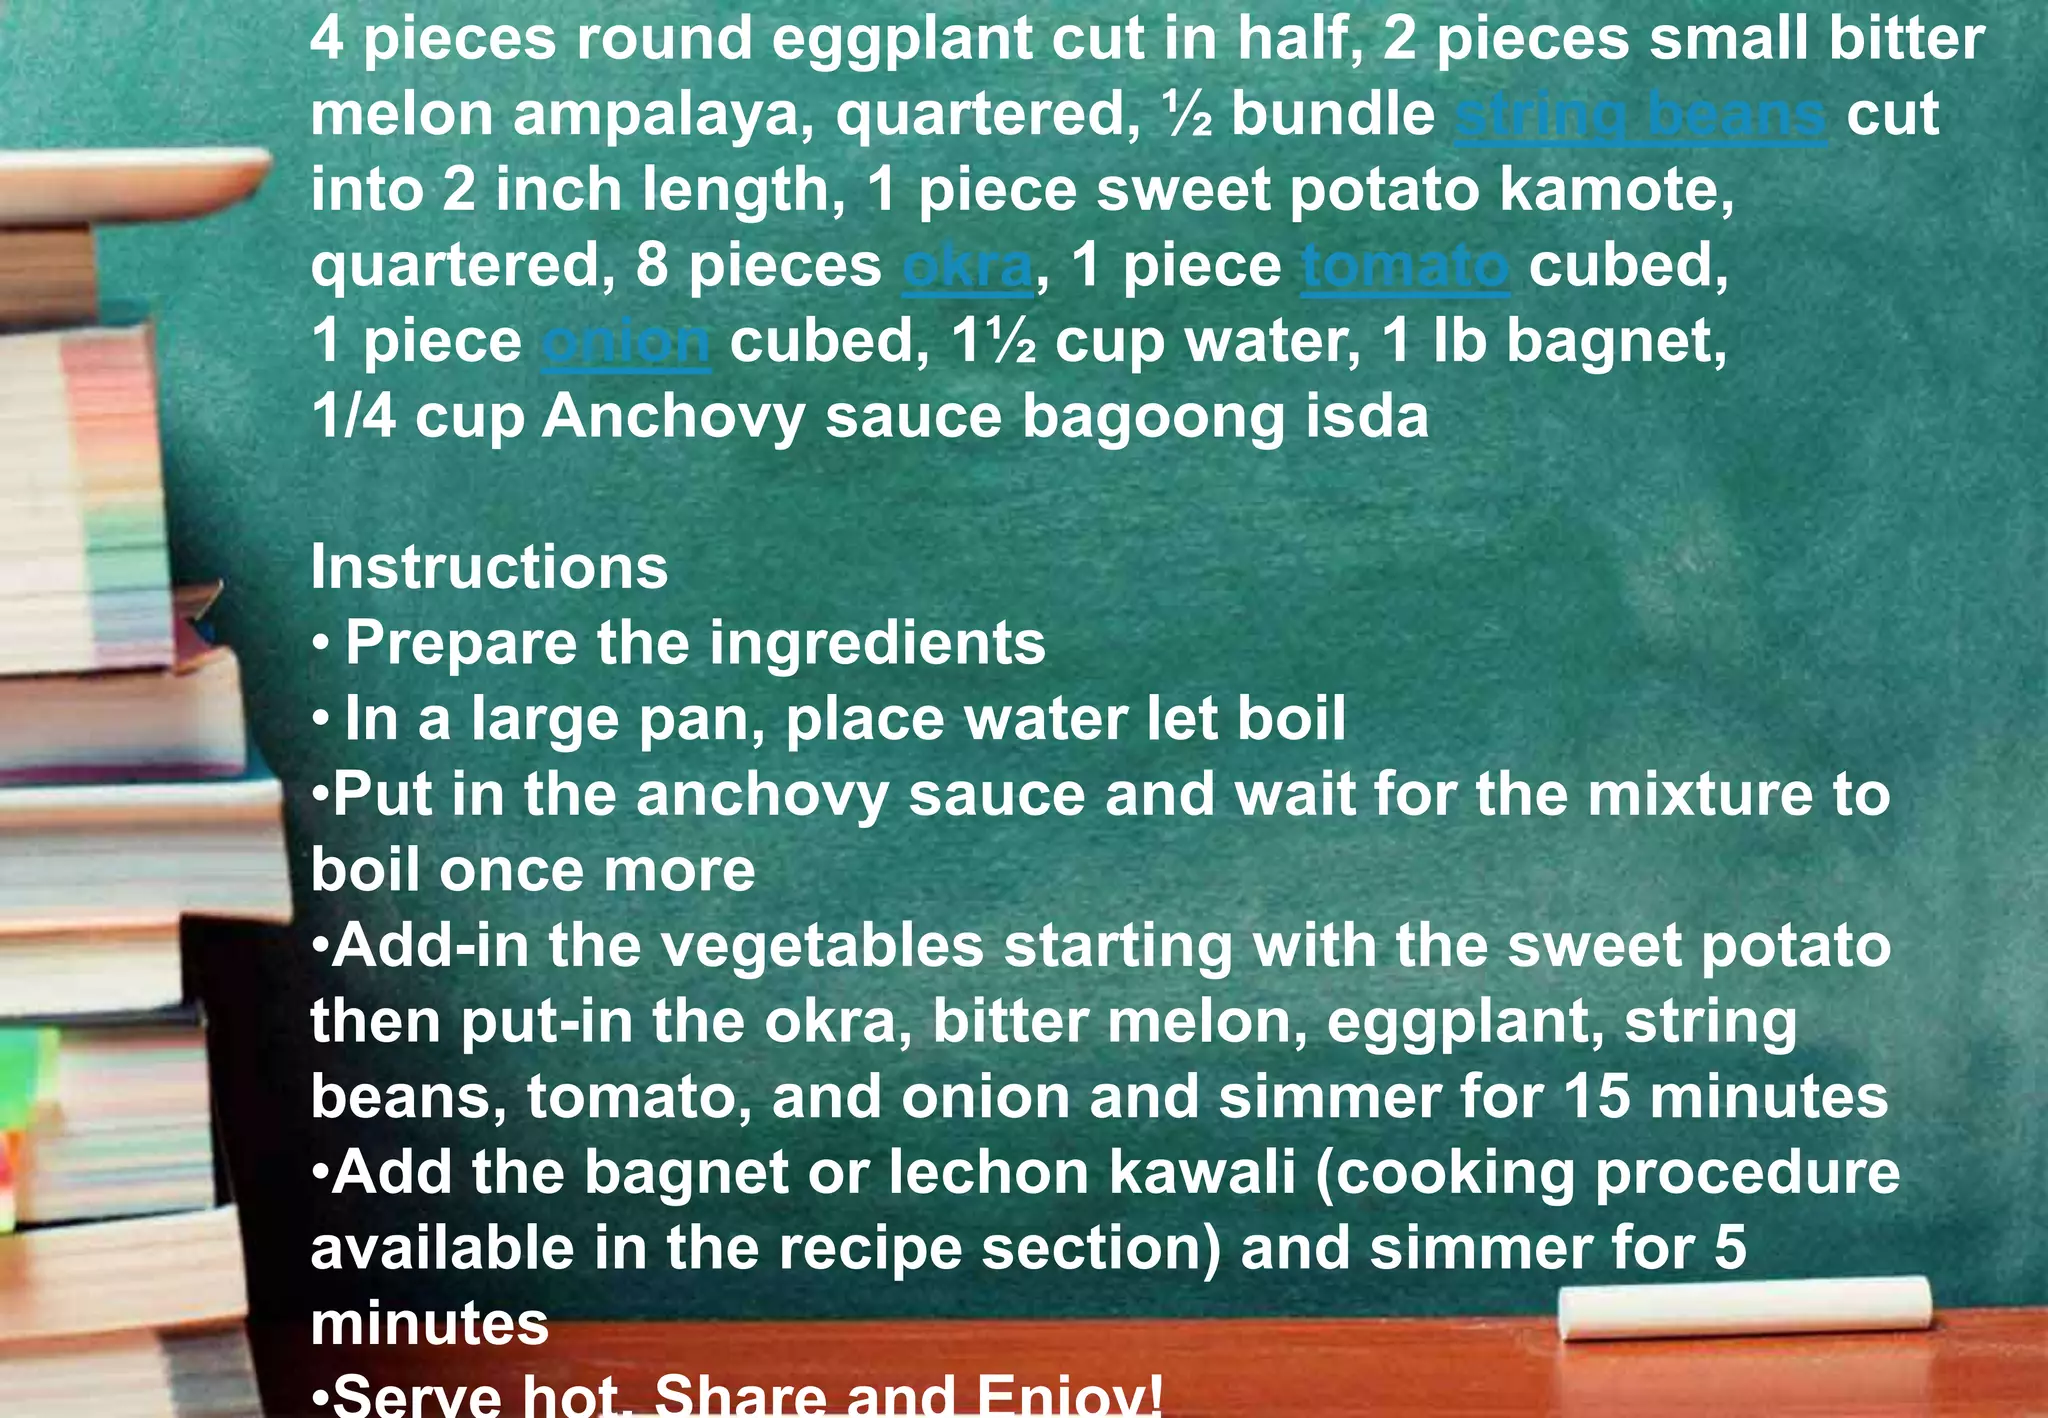
4 pieces roundeggplant cut in half, 2 pieces small bitter
melon ampalaya, quartered, ½ bundle string beans cut
into 2 inch length, 1 piece sweet potato kamote,
quartered, 8 pieces okra, 1 piece tomato cubed,
1 piece onion cubed, 1½ cup water, 1 lb bagnet,
1/4 cup Anchovy sauce bagoong isda
Instructions
• Prepare the ingredients
• In a large pan, place water let boil
•Put in the anchovy sauce and wait for the mixture to
boil once more
•Add-in the vegetables starting with the sweet potato
then put-in the okra, bitter melon, eggplant, string
beans, tomato, and onion and simmer for 15 minutes
•Add the bagnet or lechon kawali (cooking procedure
available in the recipe section) and simmer for 5
minutes
32.
Before we endthis
lesson, let me ask you
one more time…
Why do we use visual-
verbal illustrations in
interpreting
expository texts?
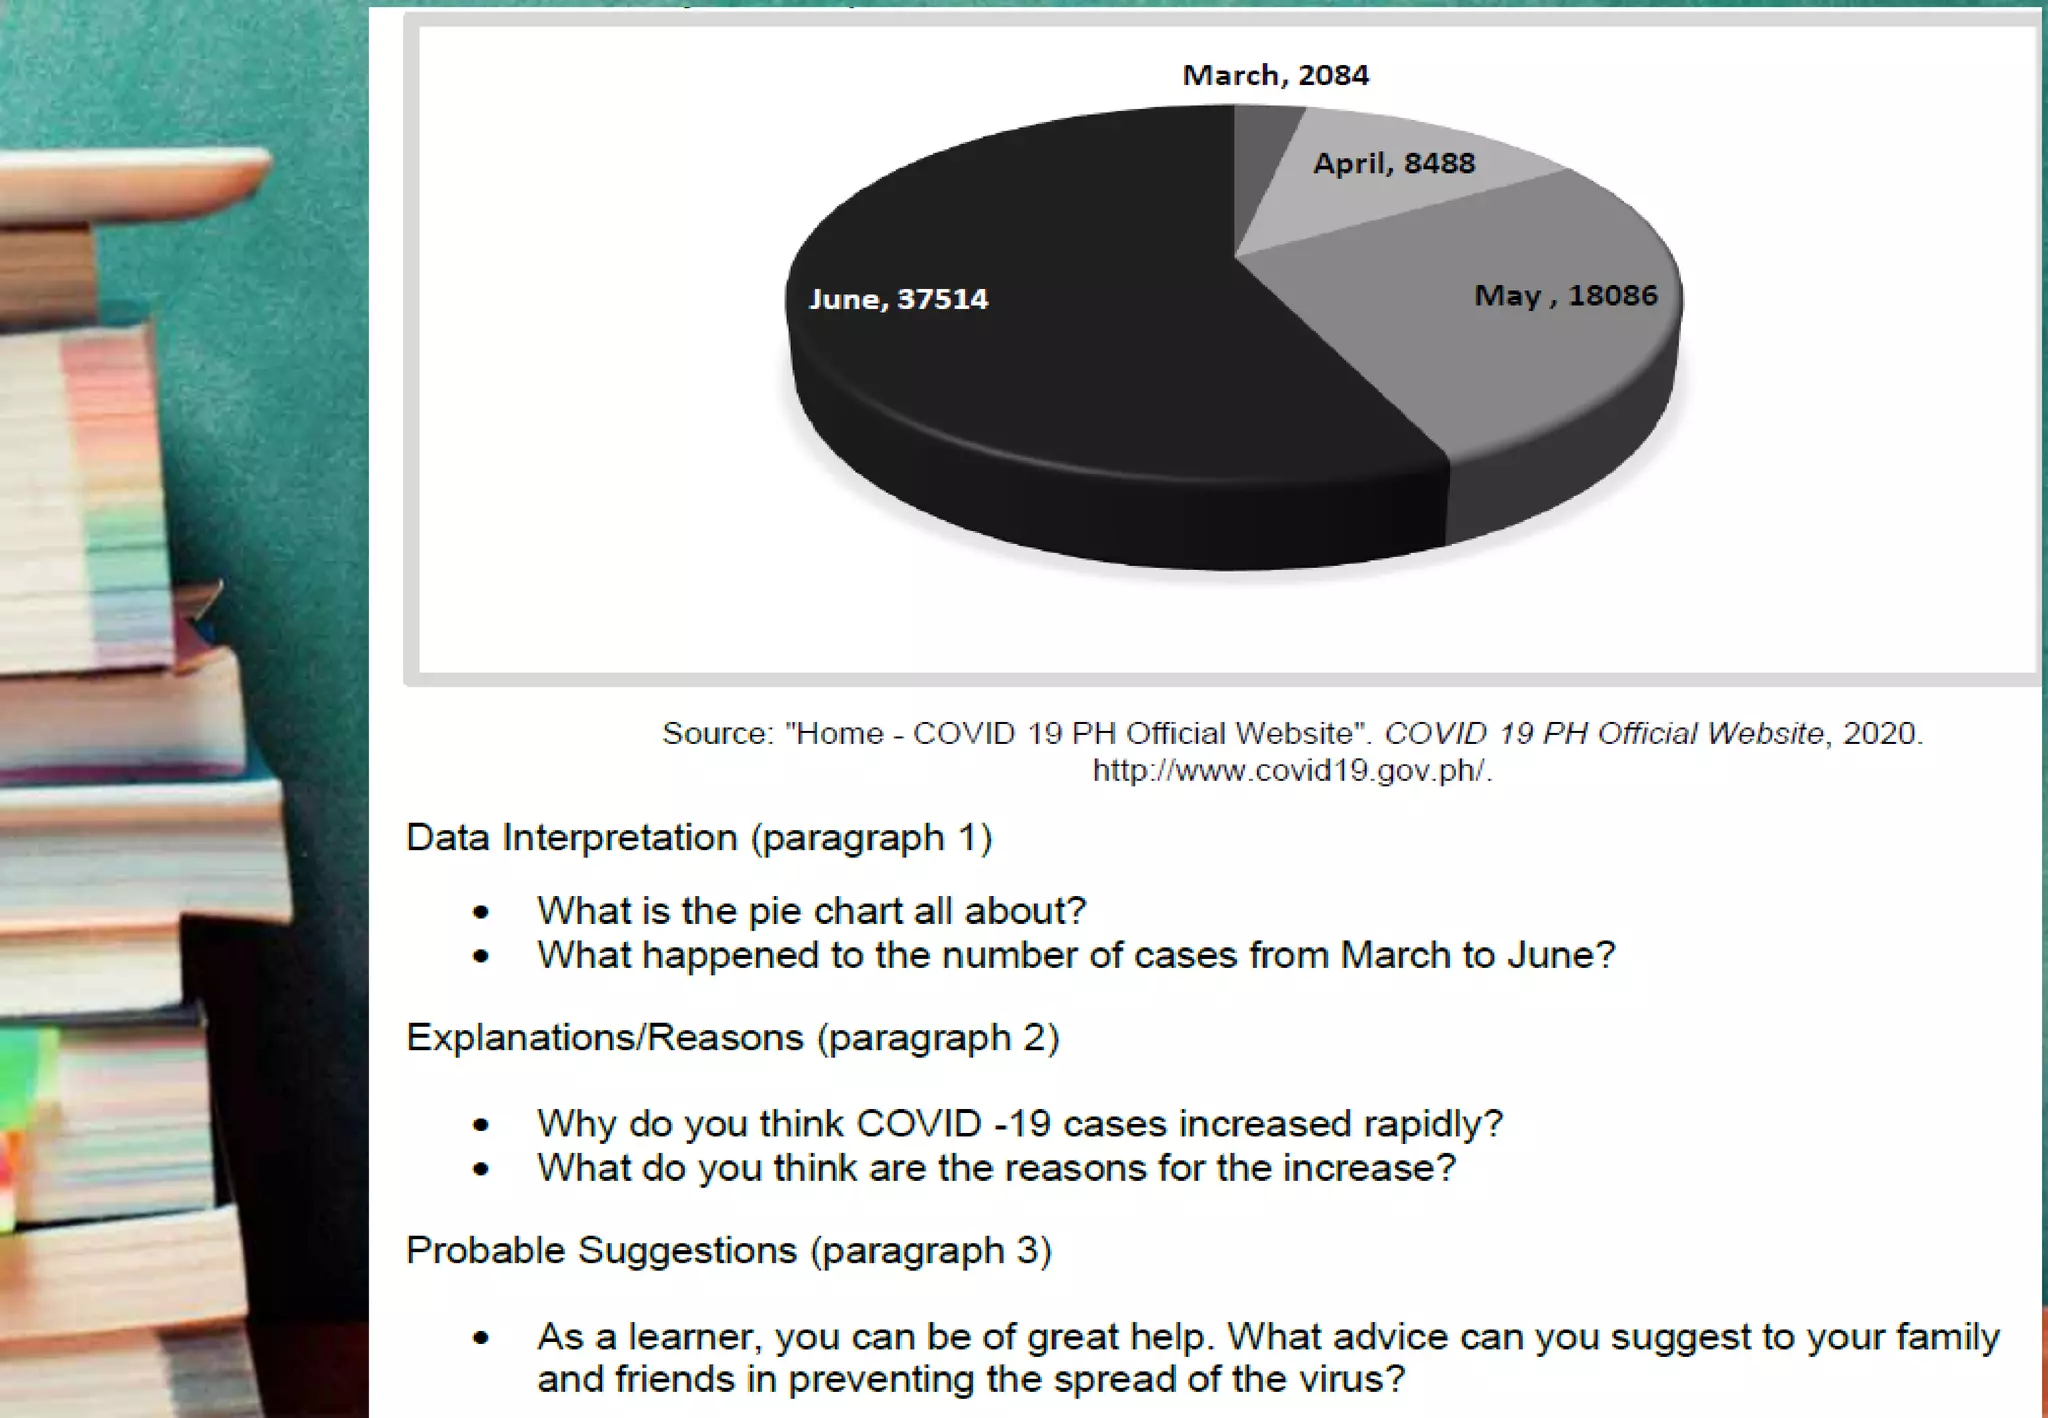
ASSIGNMENT: Interpret the
givendata in the pie chart
through writing a three-paragraph
composition following the guide
questions below. Write your
composition in a clean sheet of
short bond paper.


![Recognizing-Positive-and-Negative-Messages [Autosaved].pptx](https://cdn.slidesharecdn.com/ss_thumbnails/recognizing-positive-and-negative-messagesautosaved-230216020059-27a69639-thumbnail.jpg?width=640&height=640&fit=bounds)


