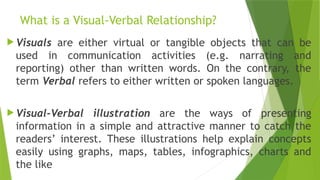
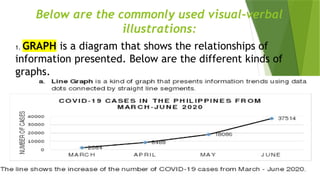
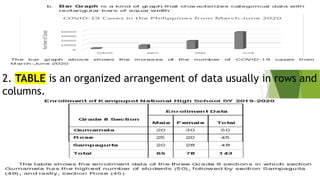
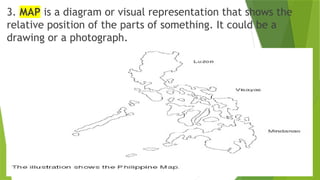
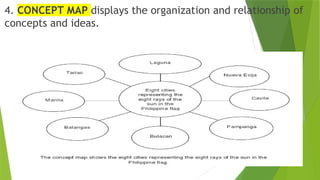
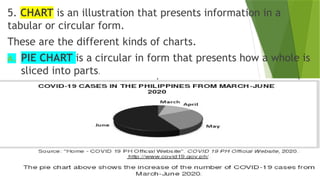
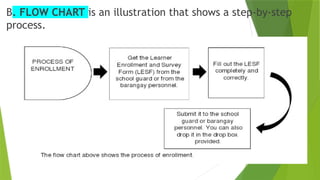
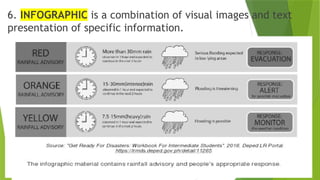
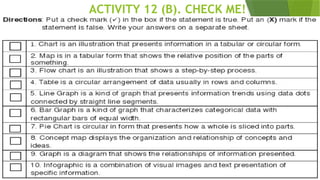
Lesson Objectives:
• Analyze visual-verbal relationships through tables,
graphs, infographics, and information maps;
• Interpret information presented in a text; and
• Demonstrate appreciation and understanding of
expository text through a concept map.
What is a Visual-Verbal Relationship?
 Visuals are either virtual or tangible objects that can be
used in communication activities (e.g. narrating and
reporting) other than written words. On the contrary, the
term Verbal refers to either written or spoken languages.
 Visual-Verbal illustration are the ways of presenting
information in a simple and attractive manner to catch the
readers’ interest. These illustrations help explain concepts
easily using graphs, maps, tables, infographics, charts and
the like
Below are the commonly used visual-verbal
illustrations:
1. GRAPH is a diagram that shows the relationships of
information presented. Below are the different kinds of
graphs.
2. TABLE is an organized arrangement of data usually in rows and
columns.
3. MAP is a diagram or visual representation that shows the
relative position of the parts of something. It could be a
drawing or a photograph.
4. CONCEPT MAP displays the organization and relationship of
concepts and ideas.
5. CHART is an illustration that presents information in a
tabular or circular form.
These are the different kinds of charts.
A. PIE CHART is a circular in form that presents how a whole is
sliced into parts.
B. FLOW CHART is an illustration that shows a step-by-step
process.
6. INFOGRAPHIC is a combination of visual images and text
presentation of specific information.
Activity 12 (A.). MATCH ME!
ACTIVITY 12 (B). CHECK ME!

English 8- Lesson 9.pptx "Visual-verbal"

  • 1.
    Lesson Objectives: • Analyzevisual-verbal relationships through tables, graphs, infographics, and information maps; • Interpret information presented in a text; and • Demonstrate appreciation and understanding of expository text through a concept map.
  • 2.
    What is aVisual-Verbal Relationship?  Visuals are either virtual or tangible objects that can be used in communication activities (e.g. narrating and reporting) other than written words. On the contrary, the term Verbal refers to either written or spoken languages.  Visual-Verbal illustration are the ways of presenting information in a simple and attractive manner to catch the readers’ interest. These illustrations help explain concepts easily using graphs, maps, tables, infographics, charts and the like
  • 3.
    Below are thecommonly used visual-verbal illustrations: 1. GRAPH is a diagram that shows the relationships of information presented. Below are the different kinds of graphs.
  • 4.
    2. TABLE isan organized arrangement of data usually in rows and columns.
  • 5.
    3. MAP isa diagram or visual representation that shows the relative position of the parts of something. It could be a drawing or a photograph.
  • 6.
    4. CONCEPT MAPdisplays the organization and relationship of concepts and ideas.
  • 7.
    5. CHART isan illustration that presents information in a tabular or circular form. These are the different kinds of charts. A. PIE CHART is a circular in form that presents how a whole is sliced into parts.
  • 8.
    B. FLOW CHARTis an illustration that shows a step-by-step process.
  • 9.
    6. INFOGRAPHIC isa combination of visual images and text presentation of specific information.
  • 10.
  • 12.