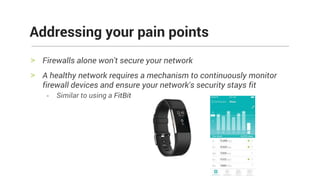
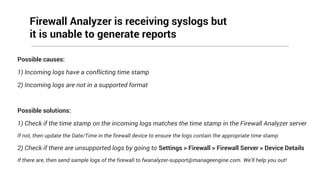
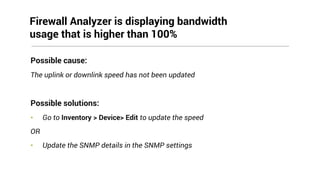
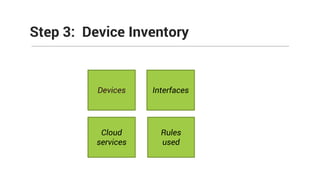
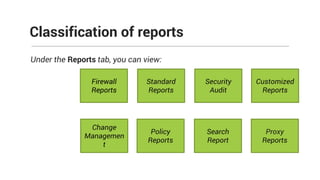
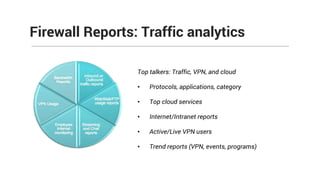
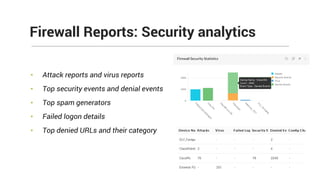
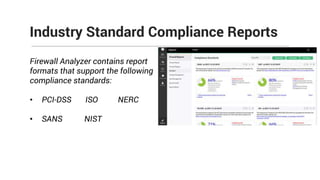
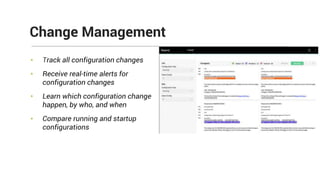
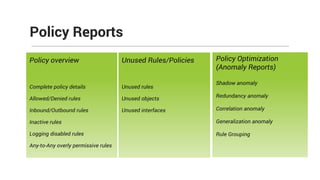
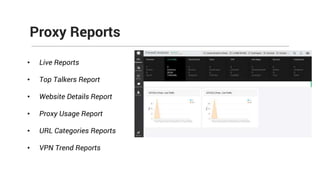
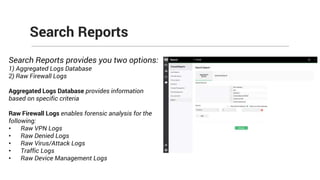
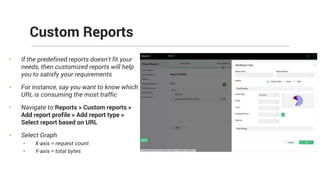
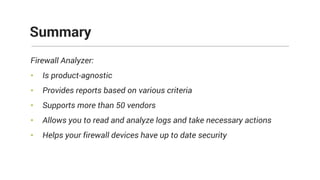
The nuts and bolts
of Firewall Analyzer
Free training on Firewall Analyzer
Part 1
Can you hear me?
Can you see the presentation?
Please confirm by commenting in the chat panel
Presenter
Introduction
> Installation
> Configuring firewalls
> Importing firewall logs
> Classification of reports
Agenda
What is Firewall Analyzer?
Firewall Analyzer analyzes and
configures logs from your firewall
devices
Introduction
> Firewalls alone won't secure your network
> A healthy network requires a mechanism to continuously monitor
firewall devices and ensure your network's security stays fit
- Similar to using a FitBit
Addressing your pain points
Support from more than 50 vendors
Firewall Analyzer is a technology partner with:
Technology partnerships
What our partner has to say about us:
"This integration offers administrators an incredible amount of visibility into firewall systems. Application control
goes deeper with detailed usage reports, while change management, security reporting, event trends, and a detailed
compliance report for firewall configuration creates an immediate ROI for customers to present back to their
stakeholders." — Ben Oster, WatchGuard
Getting started
Installation
Viewing and
customizing reports
Setting up
firewall logs
Step 4
Notification and alert
configuration
Installation requirements
1 GHZ Pentium Dual
Core processor or
equivalent
1 GB of RAM 1 GB of disk space Postgre SQL or
MSSQL
Windows or Linux
The disk space and RAM size requirements depend on the number of
devices being analyzed and the number of devices sending log
information to Firewall Analyzer.
Configuration depends on vendor type
Device configuration
Note: We have additional information for configuring different firewall types at
http://help.fwanalyzer.com/configure-firewall
For example, let's
look at
configuring a
Cisco device:
• Get Firewall Analyzer for either Windows or Linux
• Execute the binary files once it has been downloaded
• After installation, you can access the Web Client through a web browser
• Log in to Firewall Analyzer using the default username/password
combination of admin/admin.
Step 1: Installation
Mechanisms of Firewall Analyzer
Where should I send syslogs?
> Ports to be considered:
• Server port—Firewall Analyzer's web
server port: 80
• Listener port—Port on which Firewall
Analyzer receives syslogs: 1514
• Database (Postgres): 13306
- Ports are configurable
Step 2: Setting up firewall logs
How do I send syslogs?
Ways of exporting syslogs to
Firewall Analyzer:
1) Device configuration
2) Importing logs
Importing log files
How to do I import logs?
After lauching the product for the first
time, a screen will pop up, prompting
you to import logs
After the initial import, you can always:
• Go to Settings > Firewall > System
• Click Import Log and select which
TXT or CSV file you'd like to import
Common challenges faced after
exporting logs
Possible causes:
1) Incoming logs have a conflicting time stamp
2) Incoming logs are not in a supported format
Possible solutions:
1) Check if the time stamp on the incoming logs matches the time stamp in the Firewall Analyzer server
If not, then update the Date/Time in the firewall device to ensure the logs contain the appropriate time stamp
2) Check if there are unsupported logs by going to Settings > Firewall > Firewall Server > Device Details
If there are, then send sample logs of the firewall to fwanalyzer-support@manageengine.com. We'll help you out!
Firewall Analyzer is receiving syslogs but
it is unable to generate reports
Possible cause:
The uplink or downlink speed has not been updated
Possible solutions:
• Go to Inventory > Device> Edit to update the speed
OR
• Update the SNMP details in the SNMP settings
Firewall Analyzer is displaying bandwidth
usage that is higher than 100%
Step 3: Device Inventory
Devices Interfaces
Cloud
services
Rules
used
Under the Reports tab, you can view:
Classification of reports
Firewall
Reports
Standard
Reports
Change
Managemen
t
Policy
Reports
Security
Audit
Search
Report
Customized
Reports
Proxy
Reports
Firewall Reports: Traffic analytics
Top talkers: Traffic, VPN, and cloud
• Protocols, applications, category
• Top cloud services
• Internet/Intranet reports
• Active/Live VPN users
• Trend reports (VPN, events, programs)
• Attack reports and virus reports
• Top security events and denial events
• Top spam generators
• Failed logon details
• Top denied URLs and their category
Firewall Reports: Security analytics
Industry Standard Compliance Reports
Firewall Analyzer contains report
formats that support the following
compliance standards:
• PCI-DSS ISO NERC
• SANS NIST
• Track all configuration changes
• Receive real-time alerts for
configuration changes
• Learn which configuration change
happen, by who, and when
• Compare running and startup
configurations
Change Management
Policy overview
Complete policy details
Allowed/Denied rules
Inbound/Outbound rules
Inactive rules
Logging disabled rules
Any-to-Any overly permissive rules
Policy Reports
Policy Optimization
(Anomaly Reports)
Shadow anomaly
Redundancy anomaly
Correlation anomaly
Generalization anomaly
Rule Grouping
Unused Rules/Policies
Unused rules
Unused objects
Unused interfaces
Proxy Reports
• Live Reports
• Top Talkers Report
• Website Details Report
• Proxy Usage Report
• URL Categories Reports
• VPN Trend Reports
Search Reports
Search Reports provides you two options:
1) Aggregated Logs Database
2) Raw Firewall Logs
Aggregated Logs Database provides information
based on specific criteria
Raw Firewall Logs enables forensic analysis for the
following:
• Raw VPN Logs
• Raw Denied Logs
• Raw Virus/Attack Logs
• Traffic Logs
• Raw Device Management Logs
• If the predefined reports doesn't fit your
needs, then customized reports will help
you to satisfy your requirements
• For instance, say you want to know which
URL is consuming the most traffic
• Navigate to Reports > Custom reports >
Add report profile > Add report type >
Select report based on URL
• Select Graph
• X-axis = request count
• Y-axis = total bytes
Custom Reports
Tips to enhance your
visibility into Reports
Possible cause:
UserName is not availabile in the incoming logs
Solution:
We have four options for mapping UserName with an IP address
1) Configure Active Directory
2) Import DHCP logs
3) Import proxy logs
4) Create manual mapping
User names in my traffic report shows unknown
How can I get notifications?
> Mail server settings SMS server settings
Step 4: Notification configurations
There are three types of alert profiles:
> Normal alert
> Anomaly alert
> Bandwidth alert
How to do it?
Go to Settings > Firewall > Alarm profiles > Add
Here, you can create a profile name, profile type, and select the required devices
Provide the desired criteria, select the notification frequency, then click Save
Alarm Settings
Alert use cases
Let's say you want to configure an alert
that displays when five ARP attacks
happen within 10 minutes
Follow these steps:
• Select the Normal Alert profile
• Set the criteria as attack contains ARP
• Set the threshold to five events in ten
minutes
Use case #1
Let's say you'd like to be notified about any
abnormal activity from suspicious IP
addresses or a particular IP
Follow these steps:
• Select the Anomaly Alert profile
• Set the source IP criteria
• Set the threshold based on the IP requirement
Use case #2
Step 5: Basic and Server Settings
Mail
Server
SMS
server
Snapshot
Settings
User
Management Re-branding REST API
Firewall settings
SNMP
settings
Firewall
Server
System
RAW
Search
User Name/
IP mapping
Report
Search
Admin
Report
Type
Firewall Analyzer:
• Is product-agnostic
• Provides reports based on various criteria
• Supports more than 50 vendors
• Allows you to read and analyze logs and take necessary actions
• Helps your firewall devices have up to date security
Summary
Understanding firewall policies and their effectiveness
in defending against network threats
During this training, you'll learn about:
• Firewall policies
• Optimizing firewall policies
• Policy classification reports
Upcoming training on Feb 27th
Need more help?
https://www.manageengine.com/products/firewall/help/index.html
https://pitstop.manageengine.com/portal/community/netflow-and-
deviceexpert-and-firewall-support
fwanalyzer-support@manageengine.com
Q&A
Thank You!

ManageEngine Firewall Analyzer training

  • 1.
    The nuts andbolts of Firewall Analyzer Free training on Firewall Analyzer Part 1
  • 2.
    Can you hearme? Can you see the presentation? Please confirm by commenting in the chat panel
  • 3.
  • 4.
    Introduction > Installation > Configuringfirewalls > Importing firewall logs > Classification of reports Agenda
  • 5.
    What is FirewallAnalyzer? Firewall Analyzer analyzes and configures logs from your firewall devices Introduction
  • 6.
    > Firewalls alonewon't secure your network > A healthy network requires a mechanism to continuously monitor firewall devices and ensure your network's security stays fit - Similar to using a FitBit Addressing your pain points
  • 7.
    Support from morethan 50 vendors
  • 8.
    Firewall Analyzer isa technology partner with: Technology partnerships What our partner has to say about us: "This integration offers administrators an incredible amount of visibility into firewall systems. Application control goes deeper with detailed usage reports, while change management, security reporting, event trends, and a detailed compliance report for firewall configuration creates an immediate ROI for customers to present back to their stakeholders." — Ben Oster, WatchGuard
  • 9.
    Getting started Installation Viewing and customizingreports Setting up firewall logs Step 4 Notification and alert configuration
  • 10.
    Installation requirements 1 GHZPentium Dual Core processor or equivalent 1 GB of RAM 1 GB of disk space Postgre SQL or MSSQL Windows or Linux The disk space and RAM size requirements depend on the number of devices being analyzed and the number of devices sending log information to Firewall Analyzer.
  • 11.
    Configuration depends onvendor type Device configuration Note: We have additional information for configuring different firewall types at http://help.fwanalyzer.com/configure-firewall For example, let's look at configuring a Cisco device:
  • 12.
    • Get FirewallAnalyzer for either Windows or Linux • Execute the binary files once it has been downloaded • After installation, you can access the Web Client through a web browser • Log in to Firewall Analyzer using the default username/password combination of admin/admin. Step 1: Installation
  • 13.
  • 14.
    Where should Isend syslogs? > Ports to be considered: • Server port—Firewall Analyzer's web server port: 80 • Listener port—Port on which Firewall Analyzer receives syslogs: 1514 • Database (Postgres): 13306 - Ports are configurable Step 2: Setting up firewall logs How do I send syslogs? Ways of exporting syslogs to Firewall Analyzer: 1) Device configuration 2) Importing logs
  • 15.
    Importing log files Howto do I import logs? After lauching the product for the first time, a screen will pop up, prompting you to import logs After the initial import, you can always: • Go to Settings > Firewall > System • Click Import Log and select which TXT or CSV file you'd like to import
  • 16.
    Common challenges facedafter exporting logs
  • 17.
    Possible causes: 1) Incominglogs have a conflicting time stamp 2) Incoming logs are not in a supported format Possible solutions: 1) Check if the time stamp on the incoming logs matches the time stamp in the Firewall Analyzer server If not, then update the Date/Time in the firewall device to ensure the logs contain the appropriate time stamp 2) Check if there are unsupported logs by going to Settings > Firewall > Firewall Server > Device Details If there are, then send sample logs of the firewall to fwanalyzer-support@manageengine.com. We'll help you out! Firewall Analyzer is receiving syslogs but it is unable to generate reports
  • 18.
    Possible cause: The uplinkor downlink speed has not been updated Possible solutions: • Go to Inventory > Device> Edit to update the speed OR • Update the SNMP details in the SNMP settings Firewall Analyzer is displaying bandwidth usage that is higher than 100%
  • 19.
    Step 3: DeviceInventory Devices Interfaces Cloud services Rules used
  • 20.
    Under the Reportstab, you can view: Classification of reports Firewall Reports Standard Reports Change Managemen t Policy Reports Security Audit Search Report Customized Reports Proxy Reports
  • 21.
    Firewall Reports: Trafficanalytics Top talkers: Traffic, VPN, and cloud • Protocols, applications, category • Top cloud services • Internet/Intranet reports • Active/Live VPN users • Trend reports (VPN, events, programs)
  • 22.
    • Attack reportsand virus reports • Top security events and denial events • Top spam generators • Failed logon details • Top denied URLs and their category Firewall Reports: Security analytics
  • 23.
    Industry Standard ComplianceReports Firewall Analyzer contains report formats that support the following compliance standards: • PCI-DSS ISO NERC • SANS NIST
  • 24.
    • Track allconfiguration changes • Receive real-time alerts for configuration changes • Learn which configuration change happen, by who, and when • Compare running and startup configurations Change Management
  • 25.
    Policy overview Complete policydetails Allowed/Denied rules Inbound/Outbound rules Inactive rules Logging disabled rules Any-to-Any overly permissive rules Policy Reports Policy Optimization (Anomaly Reports) Shadow anomaly Redundancy anomaly Correlation anomaly Generalization anomaly Rule Grouping Unused Rules/Policies Unused rules Unused objects Unused interfaces
  • 26.
    Proxy Reports • LiveReports • Top Talkers Report • Website Details Report • Proxy Usage Report • URL Categories Reports • VPN Trend Reports
  • 27.
    Search Reports Search Reportsprovides you two options: 1) Aggregated Logs Database 2) Raw Firewall Logs Aggregated Logs Database provides information based on specific criteria Raw Firewall Logs enables forensic analysis for the following: • Raw VPN Logs • Raw Denied Logs • Raw Virus/Attack Logs • Traffic Logs • Raw Device Management Logs
  • 28.
    • If thepredefined reports doesn't fit your needs, then customized reports will help you to satisfy your requirements • For instance, say you want to know which URL is consuming the most traffic • Navigate to Reports > Custom reports > Add report profile > Add report type > Select report based on URL • Select Graph • X-axis = request count • Y-axis = total bytes Custom Reports
  • 29.
    Tips to enhanceyour visibility into Reports
  • 30.
    Possible cause: UserName isnot availabile in the incoming logs Solution: We have four options for mapping UserName with an IP address 1) Configure Active Directory 2) Import DHCP logs 3) Import proxy logs 4) Create manual mapping User names in my traffic report shows unknown
  • 31.
    How can Iget notifications? > Mail server settings SMS server settings Step 4: Notification configurations
  • 32.
    There are threetypes of alert profiles: > Normal alert > Anomaly alert > Bandwidth alert How to do it? Go to Settings > Firewall > Alarm profiles > Add Here, you can create a profile name, profile type, and select the required devices Provide the desired criteria, select the notification frequency, then click Save Alarm Settings
  • 33.
  • 34.
    Let's say youwant to configure an alert that displays when five ARP attacks happen within 10 minutes Follow these steps: • Select the Normal Alert profile • Set the criteria as attack contains ARP • Set the threshold to five events in ten minutes Use case #1
  • 35.
    Let's say you'dlike to be notified about any abnormal activity from suspicious IP addresses or a particular IP Follow these steps: • Select the Anomaly Alert profile • Set the source IP criteria • Set the threshold based on the IP requirement Use case #2
  • 36.
    Step 5: Basicand Server Settings Mail Server SMS server Snapshot Settings User Management Re-branding REST API
  • 37.
  • 38.
    Firewall Analyzer: • Isproduct-agnostic • Provides reports based on various criteria • Supports more than 50 vendors • Allows you to read and analyze logs and take necessary actions • Helps your firewall devices have up to date security Summary
  • 39.
    Understanding firewall policiesand their effectiveness in defending against network threats During this training, you'll learn about: • Firewall policies • Optimizing firewall policies • Policy classification reports Upcoming training on Feb 27th
  • 40.
  • 41.
  • 42.