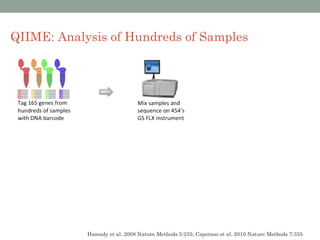
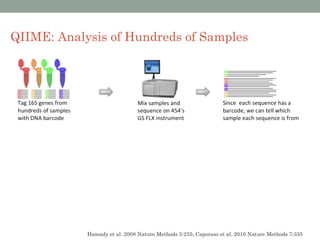
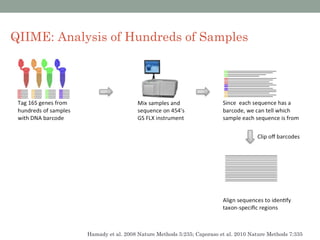
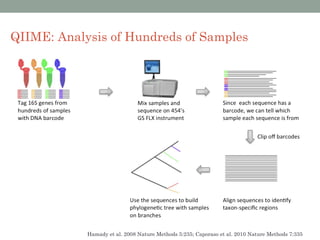
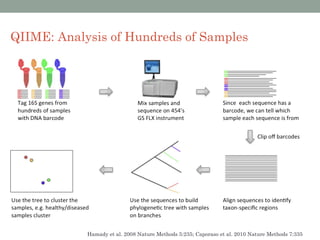
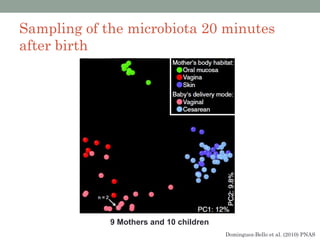
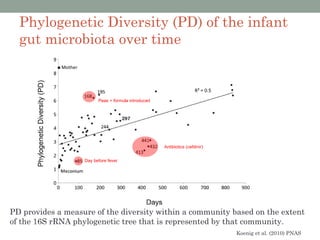
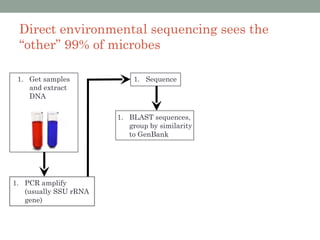
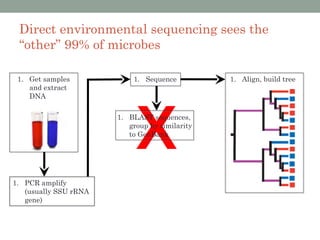
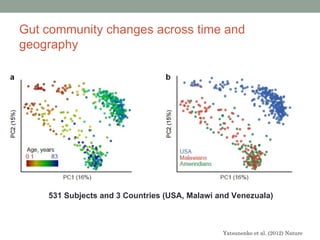
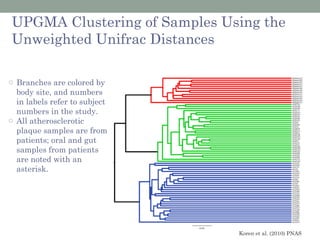
High-Throughput
Sequencing of the Human
Microbiome
Jesse Stombaugh
Biofrontiers Institute
University of Colorado at Boulder
Viewing the human microbiome through an
RNA lens
There are as many E. coli in your
gut...
As there are humans on the Earth!


                            =


However, only a tiny fraction of the gut
microbes are E.coli…
You are covered with microbes on and in your
body: How human are we?


                                Micah Hamady, PhD Thesis, 2009
Where do our microbes come from?
It’s important to remember that our
   world...


NASA: Earth from Apollo
...is a microbial world.

                                                             o Multicellular lineages
                                                               (red) rare, not diverse
                                                               as measured by SSU
                                                               rRNA
                                                             o Most molecular
                                                               diversity can be found
                                                               in microbes
                                                             o Most (99%+) microbes
                                                               can’t be cultured:
                                                               known only from
                                                               sequences


Figure adapted from Norm Pace, Science (1997) 276:734-740.
Decline in cost of sequencing
As the cost of sequencing declines...
…quantitative differences become qualitative
differences
Need to interpret vast amounts of data
Problem: Big trees hard to understand and
  analyze
Example: 5088 mouse gut
and 11,831 human colon
bacterial sequences

•See many clusters of
sequences from each
sample
•Significance tests for
differences, but no
phylogenetic metric


                                  Ley et al., 2005 PNAS 102:11070
QIIME: Analysis of Hundreds of Samples


            Hamady et al. 2008 Nature Methods 5:235; Caporaso et al. 2010 Nature Methods 7:335
QIIME: Analysis of Hundreds of Samples


            Hamady et al. 2008 Nature Methods 5:235; Caporaso et al. 2010 Nature Methods 7:335
QIIME: Analysis of Hundreds of Samples


            Hamady et al. 2008 Nature Methods 5:235; Caporaso et al. 2010 Nature Methods 7:335
QIIME: Analysis of Hundreds of Samples


            Hamady et al. 2008 Nature Methods 5:235; Caporaso et al. 2010 Nature Methods 7:335
QIIME: Analysis of Hundreds of Samples


            Hamady et al. 2008 Nature Methods 5:235; Caporaso et al. 2010 Nature Methods 7:335
QIIME: Analysis of Hundreds of Samples


            Hamady et al. 2008 Nature Methods 5:235; Caporaso et al. 2010 Nature Methods 7:335
Comparing Microbial Communities
• What is there?
• How much is there?
  • α (i.e., within sample) diversity
• How similar or different are samples?
  • β (i.e., between sample) diversity
• What relationships exist between a microbial
 community and characteristics of the sampled
 environment?
Sampling of the microbiota 20 minutes
after birth


             9 Mothers and 10 children
                                         Dominguez-Bello et al. (2010) PNAS
Phylogenetic Diversity (PD) of the infant
  gut microbiota over time


                         Peas + formula introduced


                                                     Antibiotics (cefdinir)


                   Day before fever


PD provides a measure of the diversity within a community based on the extent
of the 16S rRNA phylogenetic tree that is represented by that community.
                                                                              Koenig et al. (2010) PNAS
Community composition changes over time
    conform to a smooth temporal gradient


•   Time and PC1 from a
    PCoA of bacterial
    communities determined
    from 16S rRNA genes are
    plotted.

•   Blue color gradient based on time
    (days). Mother’s sample is red.


                                        Koenig et al. (2010) PNAS
Human oral, gut, and plaque microbiota in
patients with Atherosclerosis


                       •   Samples collected from 15
                           patients with atherosclerosis
                           and 14 healthy patients
                       •   Bacterial diversity
                           clustering by body habitat
                           using unweighted UniFrac.


                                       Koren et al. (2010) PNAS
Mean Phylum Abundances by Body Habitat
 for Patients and Controls

• Plotted values are mean sequence
  abundances in each phylum for 1,700
  randomly selected sequences per
  sample.

Most Abundant Phyla
• Plaque: Proteobacteria/Actinobacteria
• Oral: Firmicutes/Bacteroidetes/
        Actinobacteria
• Gut: Firmicutes/Bacteroidetes


                                          Koren et al. (2010) PNAS
Correlations between the Abundances of Different
    Genera and Disease Markers


                                        Oral samples
•   Pearson correlation coefficients are represented by color ranging from blue, negative
    correlation (−1), to red, positive correlation (1).
•   Positive correlations between Fusobacteria with LDL and cholesterol levels
•   Positive correlation between Streptococcus with HDL cholesterol and Apolipoprotein A-1 (ApoA1),
    whereas Neisseria was negatively correlated to levels of these two disease markers
•   Significant correlations are noted by *P < 0.05; **P < 0.01, and ***P < 0.001.

                                                                             Koren et al. (2010) PNAS
Microbial biogeography of public restroom
   surfaces
             12 University of Colorado Restrooms (6 men and 6 women)


Light blue indicates low abundance while dark blue indicates high abundance of taxa.
B.Skin-associated taxa (Propionibacteriaceae, Corynebacteriaceae, Staphylococcaceae and
Streptococcaceae) were abundant on all surfaces.
C.Gut-associated taxa (Clostridiales, Clostridiales group XI, Ruminococcaceae, Lachnospiraceae,
Prevotellaceae and Bacteroidaceae) were most abundant on toilet surfaces.
D.soil-associated taxa (Rhodobacteraceae, Rhizobiales, Microbacteriaceae and Nocardioidaceae) were in
low abundance on all restroom surfaces, they were relatively more abundant on the floor of the restrooms we
surveyed.
                                                                             Flores et al. (2012) Plos One
Microbial biogeography of public restroom
surfaces


                                Flores et al. (2012) Plos One
Principal Investigators:
Rob Knight (CU)
                                  Acknowledgements
Noah Fierer (CU)
Ruth Ley (Cornell)
Frederik Backhed (Gothenburg)
Jeff Gordon (Wash U.)
                                       Support:
Knight Lab:
Jose Clemente Litran
Doug Wendel
Antonio Gonzalez-Pena
Jeremy Widmann
Meg Pirrung
Tony Walters
Daniel McDonald
Cathy Lozupone
Greg Caporaso -> Northern Arizona U.
Justin Kuczynski -> Second Genome
Jens Reeder -> Genetech
Dan Knights -> Harvard
Julia Goodrich -> Cornell
Jesse Zaneveld -> Oregon State U.
Chris Lauber
Donna Berg-Lyons
Jerry Kennedy
Gail Ackermann
Elizabeth Costello -> Stanford
Micah Hamady -> world travels

Other Labs:
Jeremy Koenig (Cornell)
Omry Koren (Cornell)
Ayme Spor (Cornell)
Technologies like MIxS enable everyone to
contribute


     Minimal Information about
     any (x) Sequence
Direct environmental sequencing sees the
 “other” 99% of microbes

 1. Get samples            1. Sequence
    and extract
    DNA

                       1. BLAST sequences,
                          group by similarity
                          to GenBank


1. PCR amplify
   (usually SSU rRNA
   gene)
Direct environmental sequencing sees the
 “other” 99% of microbes

 1. Get samples            1. Sequence          1. Align, build tree
    and extract
    DNA


                            X
                       1. BLAST sequences,
                          group by similarity
                          to GenBank


1. PCR amplify
   (usually SSU rRNA
   gene)
Gut community changes across time and
geography


    531 Subjects and 3 Countries (USA, Malawi and Venezuala)


                                               Yatsunenko et al. (2012) Nature
UPGMA Clustering of Samples Using the
Unweighted Unifrac Distances

o Branches are colored by
  body site, and numbers
  in labels refer to subject
  numbers in the study.
o All atherosclerotic
  plaque samples are from
  patients; oral and gut
  samples from patients
  are noted with an
  asterisk.


                               Koren et al. (2010) PNAS
Differences in Abundance between Body
   Sites


(A) Shrunken differences for the 10 genera accounting for the differences among the three
    body sites.
     •   Plaque: (+) Chyrseomonas/Staphylococcus/Propionibactererineae
     •   Oral: (+) Streptococcus
     •   Gut:    (+) Lachnospiraceae/Ruminococcus/Faecalibacterium, (-) Streptococcus
(B) Heat map of the abundances of genera (i.e., those driving differences between body sites)
                                                                               Koren et al. (2010) PNAS

High-Throughput Sequencing of the Human Microbiome, Rob Knight Research Group, University of Colorado at Boulder, Jesse Stombaugh, Copenhagenomics 2012

  • 1.
    High-Throughput Sequencing of theHuman Microbiome Jesse Stombaugh Biofrontiers Institute University of Colorado at Boulder
  • 2.
    Viewing the humanmicrobiome through an RNA lens
  • 3.
    There are asmany E. coli in your gut...
  • 4.
    As there arehumans on the Earth! = However, only a tiny fraction of the gut microbes are E.coli…
  • 5.
    You are coveredwith microbes on and in your body: How human are we? Micah Hamady, PhD Thesis, 2009
  • 6.
    Where do ourmicrobes come from?
  • 7.
    It’s important toremember that our world... NASA: Earth from Apollo
  • 8.
    ...is a microbialworld. o Multicellular lineages (red) rare, not diverse as measured by SSU rRNA o Most molecular diversity can be found in microbes o Most (99%+) microbes can’t be cultured: known only from sequences Figure adapted from Norm Pace, Science (1997) 276:734-740.
  • 9.
    Decline in costof sequencing
  • 10.
    As the costof sequencing declines...
  • 11.
    …quantitative differences becomequalitative differences
  • 12.
    Need to interpretvast amounts of data
  • 13.
    Problem: Big treeshard to understand and analyze Example: 5088 mouse gut and 11,831 human colon bacterial sequences •See many clusters of sequences from each sample •Significance tests for differences, but no phylogenetic metric Ley et al., 2005 PNAS 102:11070
  • 14.
    QIIME: Analysis ofHundreds of Samples Hamady et al. 2008 Nature Methods 5:235; Caporaso et al. 2010 Nature Methods 7:335
  • 15.
    QIIME: Analysis ofHundreds of Samples Hamady et al. 2008 Nature Methods 5:235; Caporaso et al. 2010 Nature Methods 7:335
  • 16.
    QIIME: Analysis ofHundreds of Samples Hamady et al. 2008 Nature Methods 5:235; Caporaso et al. 2010 Nature Methods 7:335
  • 17.
    QIIME: Analysis ofHundreds of Samples Hamady et al. 2008 Nature Methods 5:235; Caporaso et al. 2010 Nature Methods 7:335
  • 18.
    QIIME: Analysis ofHundreds of Samples Hamady et al. 2008 Nature Methods 5:235; Caporaso et al. 2010 Nature Methods 7:335
  • 19.
    QIIME: Analysis ofHundreds of Samples Hamady et al. 2008 Nature Methods 5:235; Caporaso et al. 2010 Nature Methods 7:335
  • 20.
    Comparing Microbial Communities •What is there? • How much is there? • α (i.e., within sample) diversity • How similar or different are samples? • β (i.e., between sample) diversity • What relationships exist between a microbial community and characteristics of the sampled environment?
  • 21.
    Sampling of themicrobiota 20 minutes after birth 9 Mothers and 10 children Dominguez-Bello et al. (2010) PNAS
  • 22.
    Phylogenetic Diversity (PD)of the infant gut microbiota over time Peas + formula introduced Antibiotics (cefdinir) Day before fever PD provides a measure of the diversity within a community based on the extent of the 16S rRNA phylogenetic tree that is represented by that community. Koenig et al. (2010) PNAS
  • 23.
    Community composition changesover time conform to a smooth temporal gradient • Time and PC1 from a PCoA of bacterial communities determined from 16S rRNA genes are plotted. • Blue color gradient based on time (days). Mother’s sample is red. Koenig et al. (2010) PNAS
  • 24.
    Human oral, gut,and plaque microbiota in patients with Atherosclerosis • Samples collected from 15 patients with atherosclerosis and 14 healthy patients • Bacterial diversity clustering by body habitat using unweighted UniFrac. Koren et al. (2010) PNAS
  • 25.
    Mean Phylum Abundancesby Body Habitat for Patients and Controls • Plotted values are mean sequence abundances in each phylum for 1,700 randomly selected sequences per sample. Most Abundant Phyla • Plaque: Proteobacteria/Actinobacteria • Oral: Firmicutes/Bacteroidetes/ Actinobacteria • Gut: Firmicutes/Bacteroidetes Koren et al. (2010) PNAS
  • 26.
    Correlations between theAbundances of Different Genera and Disease Markers Oral samples • Pearson correlation coefficients are represented by color ranging from blue, negative correlation (−1), to red, positive correlation (1). • Positive correlations between Fusobacteria with LDL and cholesterol levels • Positive correlation between Streptococcus with HDL cholesterol and Apolipoprotein A-1 (ApoA1), whereas Neisseria was negatively correlated to levels of these two disease markers • Significant correlations are noted by *P < 0.05; **P < 0.01, and ***P < 0.001. Koren et al. (2010) PNAS
  • 27.
    Microbial biogeography ofpublic restroom surfaces 12 University of Colorado Restrooms (6 men and 6 women) Light blue indicates low abundance while dark blue indicates high abundance of taxa. B.Skin-associated taxa (Propionibacteriaceae, Corynebacteriaceae, Staphylococcaceae and Streptococcaceae) were abundant on all surfaces. C.Gut-associated taxa (Clostridiales, Clostridiales group XI, Ruminococcaceae, Lachnospiraceae, Prevotellaceae and Bacteroidaceae) were most abundant on toilet surfaces. D.soil-associated taxa (Rhodobacteraceae, Rhizobiales, Microbacteriaceae and Nocardioidaceae) were in low abundance on all restroom surfaces, they were relatively more abundant on the floor of the restrooms we surveyed. Flores et al. (2012) Plos One
  • 28.
    Microbial biogeography ofpublic restroom surfaces Flores et al. (2012) Plos One
  • 29.
    Principal Investigators: Rob Knight(CU) Acknowledgements Noah Fierer (CU) Ruth Ley (Cornell) Frederik Backhed (Gothenburg) Jeff Gordon (Wash U.) Support: Knight Lab: Jose Clemente Litran Doug Wendel Antonio Gonzalez-Pena Jeremy Widmann Meg Pirrung Tony Walters Daniel McDonald Cathy Lozupone Greg Caporaso -> Northern Arizona U. Justin Kuczynski -> Second Genome Jens Reeder -> Genetech Dan Knights -> Harvard Julia Goodrich -> Cornell Jesse Zaneveld -> Oregon State U. Chris Lauber Donna Berg-Lyons Jerry Kennedy Gail Ackermann Elizabeth Costello -> Stanford Micah Hamady -> world travels Other Labs: Jeremy Koenig (Cornell) Omry Koren (Cornell) Ayme Spor (Cornell)
  • 30.
    Technologies like MIxSenable everyone to contribute Minimal Information about any (x) Sequence
  • 31.
    Direct environmental sequencingsees the “other” 99% of microbes 1. Get samples 1. Sequence and extract DNA 1. BLAST sequences, group by similarity to GenBank 1. PCR amplify (usually SSU rRNA gene)
  • 32.
    Direct environmental sequencingsees the “other” 99% of microbes 1. Get samples 1. Sequence 1. Align, build tree and extract DNA X 1. BLAST sequences, group by similarity to GenBank 1. PCR amplify (usually SSU rRNA gene)
  • 33.
    Gut community changesacross time and geography 531 Subjects and 3 Countries (USA, Malawi and Venezuala) Yatsunenko et al. (2012) Nature
  • 34.
    UPGMA Clustering ofSamples Using the Unweighted Unifrac Distances o Branches are colored by body site, and numbers in labels refer to subject numbers in the study. o All atherosclerotic plaque samples are from patients; oral and gut samples from patients are noted with an asterisk. Koren et al. (2010) PNAS
  • 35.
    Differences in Abundancebetween Body Sites (A) Shrunken differences for the 10 genera accounting for the differences among the three body sites. • Plaque: (+) Chyrseomonas/Staphylococcus/Propionibactererineae • Oral: (+) Streptococcus • Gut: (+) Lachnospiraceae/Ruminococcus/Faecalibacterium, (-) Streptococcus (B) Heat map of the abundances of genera (i.e., those driving differences between body sites) Koren et al. (2010) PNAS

Editor's Notes

  • #7 Which raises the question: where do our microbes come from?
  • #11 Due to this decline, we have the opportunity to sequence more microbial communities, where in the past we could only sequence a couple dozen samples, whereas today, we can sequence thousands of samples in 1 run, which will allow quantitative differences to become qualitative differences.
  • #17 Now, we can identify which sequences are associated to a particular sample by its barcodes.
  • #25 It has been suggested that periodontal disease has been associated with atherosclerosis Also, that gut bacteria may contribute to obesity
  • #36 For each genus listed in center, the direction of the horizontal bars indicates relative overrepresentation (Right) and underrepresentation (Left), and the length of the bar indicates the strength of the effect. Columns show, for each sample, the abundance data of genera listed in center. The abundances of the genera were clustered using unsupervised hierarchical clustering (blue, low abundance; red, high abundance). The phylum;genus of each of the classifying OTUs is noted.