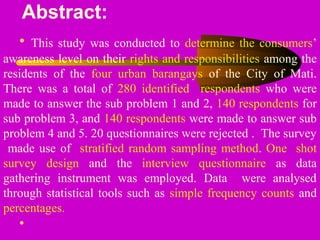
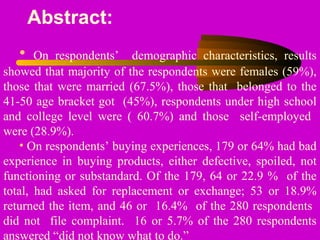
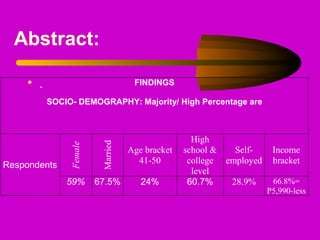
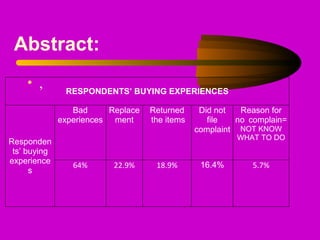
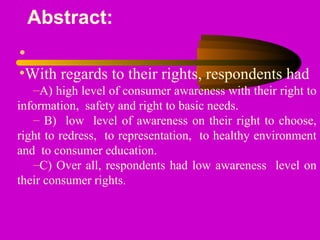
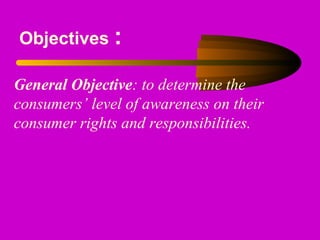
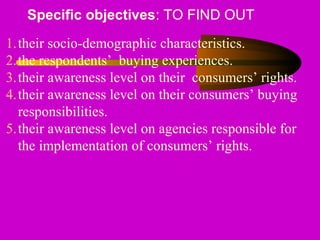
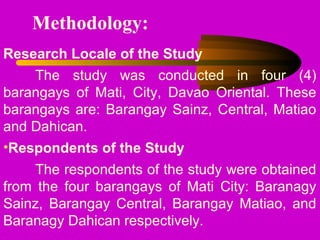
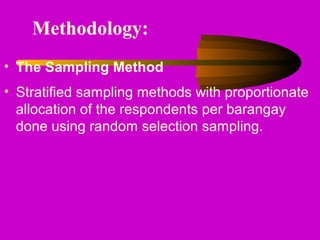
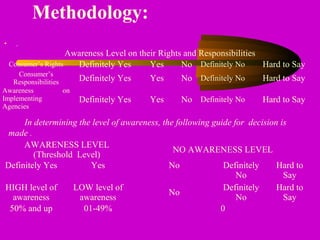
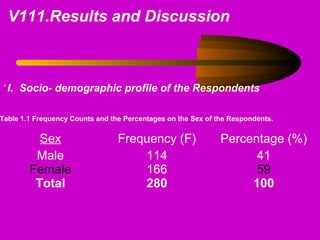
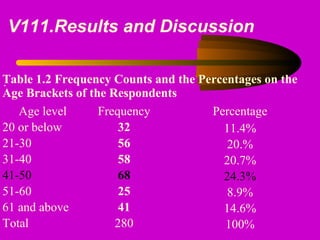
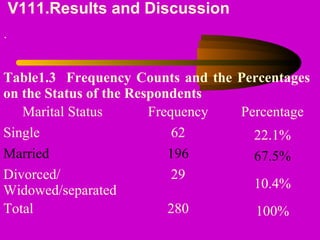
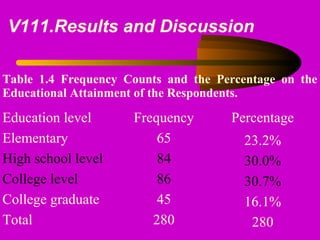
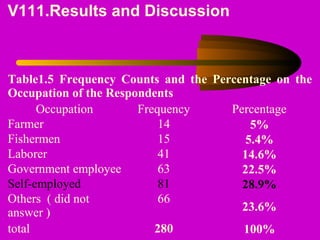
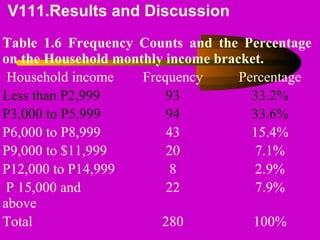
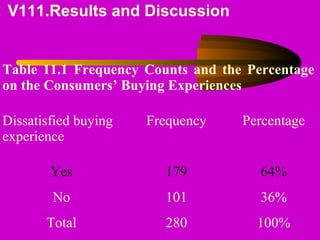
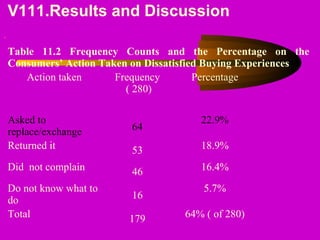
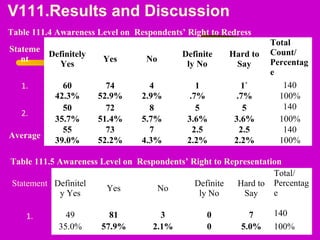
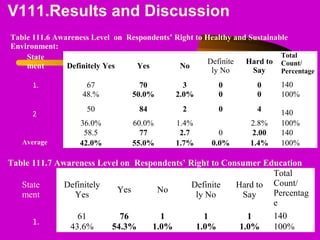
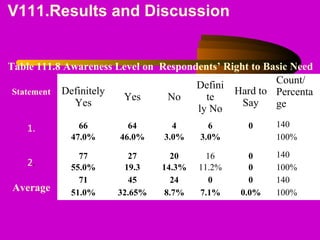
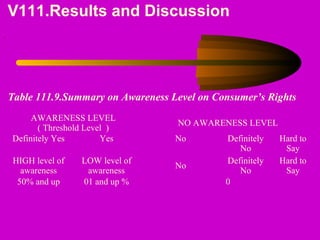
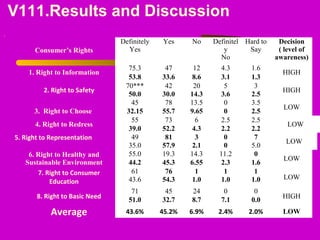
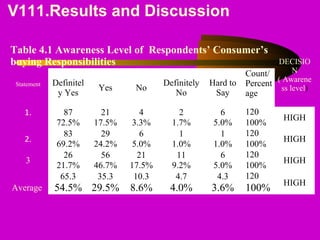
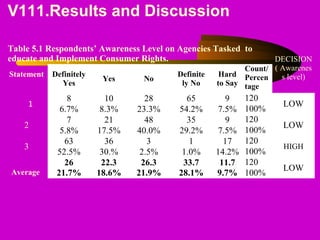
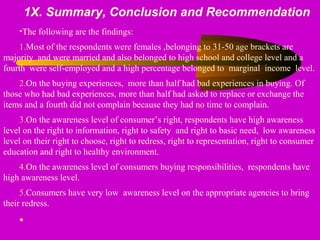
The study aimed to determine consumers' awareness of their rights and responsibilities in four urban barangays in Mati City, Philippines. A total of 280 respondents participated in surveys regarding their demographics, buying experiences, and knowledge of rights. The results showed that most respondents were female, married, aged 41-50, had secondary education, and were self-employed. Over 64% reported dissatisfying buying experiences. Overall, respondents showed low awareness of most rights but high awareness of their rights to information, safety, and basic needs. The study aims to help improve consumer education strategies.
Market Research to Measure Brand Awareness in Consumer ElectronicsPravesh Anand
An academic project undertaken to measure the brand awareness of branded products in Consumer Electronics. The project brief is as follows:
1.Market research to examine the brand awareness in Khichra village(rural area) and study the interest of consumers in branded products of Consumer Electronics.
Learn what consumer awareness really is, how to shop smart and how to file complaint if, unfortunately, you have been caught in a scam or are unhappy with a purchase.
As a consumer, we are protected against market malpractices, illegal trade practices and exploitation in various forms through six important Indian Consumer Rights. In a growing economy like our country, it isn’t unusual for us to face these abuses mostly due to aggressive competition among a multitude of products and services. To lean more visit http://www.instaremedy.com/
Follow us on:
Facebook: https://www.facebook.com/InstaRemedy/
Twitter: https://twitter.com/InstaRemedy
Linkedin: https://www.linkedin.com/company-beta/10130024/
If you have any Complaints against any brand then you can contact us through • Website : www.instaremedy.com • Call : 022-39966111 • Email : info@instaremedy.com Zindagi Banaaye Aasaan! InstaRemedy –At your Service Always
WHAT IS THE CONSUMER AWARENESS LEVEL ON THEIR RIGHTS AND RESPONSIBILITIES? WHAT IS THE BEST INFORMATION CAMPAIGN STRATEGIES IN DISSEMINATING CONSUMER RIGHTS AND RESPONSIBILITIES AS DEFINE UNDER THE LAWS OF THE PHILIPPINES?
This report looks at findings from web survey and depth interviews about use of the site amongst people looking for a new GP. It identifies what factors are important to people and provides feedback on some proposed new indicators.
Data were collected from 120 smallholder famers from two communities. Findings revealed that 82% were aware of specific Good Agricultural Practices (GAP) but the majority of the respondents were not practicing GAPs due to several challenges.
This survey’s purpose was to explore utilisation of shopping areas in Stonnington, including what factors attract or detract people from visiting some shopping areas. The survey data will help to inform the marketing and branding of Stonnington’s shopping areas and assist with other economic development activities to support the development of Stonnington businesses.
July 2014 NHS Choices Satisfaction SurveyNHSChoices
Results of the July 2014 NHS Choices satisfaction survey. This includes details of:
Reasons for visiting the site
Whether people found what they were looking for and what was missing
Satisfaction and advocacy and suggested improvements
December 2014 nhs choices satisfaction surveyNHSChoices
Results of the December 2014/January 2015 NHS Choices satisfaction survey. This includes details of:
Reasons for visiting the site
Whether people found what they were looking for and what was missing
Satisfaction and advocacy and suggested improvements
July 2015: Sustainable Environment (Connect Stonnington Group)Stonnington Connect
This survey aims to identify the issues of interest to residents and gain an insight into current environmental attitudes and behaviours. The results of this section will inform Council’s environmental sustainability activities and provide a measure for the effectiveness of our sustainability initiatives.
" Each society is a speech community sharing a language. It is composed of people from different social orientations identified according to their social status, the circle they move in, or the different functions they perform in society. These differences in social orientations are a basis for variations in language use within the community."
" The Philippines is home to more than 13 million indigenous peoples belonging to more than 120 distinct ethnolinguistic groups. Most of the indigenous Filipinos live in the mountains or their fringes, or near the sea. They are found throughout the archipelago. One of those indigenous peoples in the Philippines is the mandaya tribe which can be found in Eastcoast in the Province of the Davao Oriental. This tribe is known as Mandaya people. Their language, Mandayan, has many classifications:"
" Manaymandayan,Karagamandayan, Mandayalupon, MangaraganMandaya, Cateelenyo, Davawenyo, CataelanoMandaya, Sangab.The dialects of this Mandaya language vary on manner of articulation- how it is being pronounced and the changes of some words."
Thoughts equal energy and energy equals matter, then thoughts become matter. Observe your thoughts as they will manifest themselves in your life in the natural via the ZPF.
Heart-based Educ Pararadigm for the 3 rd MillenniumPARISH
For humanity to move towards higher evolutionary scale, the need to redefine education is inevitable- a polar shift from individual competition to human and environmental interconnectedness; from robotized learning from memorization and facts accumulation and skills training method for industry use and manipulation, to the enhancement of one's native genius for him to contribute to the betterment of human society,from the manufacturing/producing globally competitive skilled trained individual for higher salary scale..to the wisdom of the love of life ...
THE TIME IS RIPE TO REPLACE THE OLD EDUCATION PARADIGM WHICH IS ANCHORED ONLY ON MEMORIZATION AND ACCUMULATION OF FACTS AND DEVELOPING SKILLS THAT RESULTED ONLY ON HUMAN ROBOTIZATION, COMPETITION, SEPARATION, EXPLOITATION, SURVIVAL OF THE FITTEST AND UNTIMELY DEATH.
THE 21ST EDUCATION IS NOTHING BUT PHYSICAL SURVIVAL OF HUMANS...10 % REAL EDUCATION AND 90 NOTHING BUT GARBAGE..WHAT IS BASIC IS NOT BASIC AT ALL..HUMAN POWER IS LEFT UNTAPPED SO MUCH THAT HUMANS ARE LEFT GROPING IN THE DARKNESS OF PHYSICAL AND MATERIAL PURSUIT...
FOR HUMAN SPECIES TO MOVE TO THE NEXT EPOCH OF EVOLUTION, HUMAN HAS TO SHIFT AND FOCUS TO HIS HEART AND TAPS HIS HEART- BRAIN FOR HIGHER LEVEL OF INTELLIGENCE- THE INTELLIGENCE OF INTUITION AND INSPIRATION..
How to Get CNIC Information System with Paksim Ga.pptxdanishmna97
Pakdata Cf is a groundbreaking system designed to streamline and facilitate access to CNIC information. This innovative platform leverages advanced technology to provide users with efficient and secure access to their CNIC details.
GridMate - End to end testing is a critical piece to ensure quality and avoid...ThomasParaiso2
End to end testing is a critical piece to ensure quality and avoid regressions. In this session, we share our journey building an E2E testing pipeline for GridMate components (LWC and Aura) using Cypress, JSForce, FakerJS…
Generative AI Deep Dive: Advancing from Proof of Concept to ProductionAggregage
Join Maher Hanafi, VP of Engineering at Betterworks, in this new session where he'll share a practical framework to transform Gen AI prototypes into impactful products! He'll delve into the complexities of data collection and management, model selection and optimization, and ensuring security, scalability, and responsible use.
Encryption in Microsoft 365 - ExpertsLive Netherlands 2024Albert Hoitingh
In this session I delve into the encryption technology used in Microsoft 365 and Microsoft Purview. Including the concepts of Customer Key and Double Key Encryption.
A tale of scale & speed: How the US Navy is enabling software delivery from l...sonjaschweigert1
Rapid and secure feature delivery is a goal across every application team and every branch of the DoD. The Navy’s DevSecOps platform, Party Barge, has achieved:
- Reduction in onboarding time from 5 weeks to 1 day
- Improved developer experience and productivity through actionable findings and reduction of false positives
- Maintenance of superior security standards and inherent policy enforcement with Authorization to Operate (ATO)
Development teams can ship efficiently and ensure applications are cyber ready for Navy Authorizing Officials (AOs). In this webinar, Sigma Defense and Anchore will give attendees a look behind the scenes and demo secure pipeline automation and security artifacts that speed up application ATO and time to production.
We will cover:
- How to remove silos in DevSecOps
- How to build efficient development pipeline roles and component templates
- How to deliver security artifacts that matter for ATO’s (SBOMs, vulnerability reports, and policy evidence)
- How to streamline operations with automated policy checks on container images
UiPath Test Automation using UiPath Test Suite series, part 6DianaGray10
Welcome to UiPath Test Automation using UiPath Test Suite series part 6. In this session, we will cover Test Automation with generative AI and Open AI.
UiPath Test Automation with generative AI and Open AI webinar offers an in-depth exploration of leveraging cutting-edge technologies for test automation within the UiPath platform. Attendees will delve into the integration of generative AI, a test automation solution, with Open AI advanced natural language processing capabilities.
Throughout the session, participants will discover how this synergy empowers testers to automate repetitive tasks, enhance testing accuracy, and expedite the software testing life cycle. Topics covered include the seamless integration process, practical use cases, and the benefits of harnessing AI-driven automation for UiPath testing initiatives. By attending this webinar, testers, and automation professionals can gain valuable insights into harnessing the power of AI to optimize their test automation workflows within the UiPath ecosystem, ultimately driving efficiency and quality in software development processes.
What will you get from this session?
1. Insights into integrating generative AI.
2. Understanding how this integration enhances test automation within the UiPath platform
3. Practical demonstrations
4. Exploration of real-world use cases illustrating the benefits of AI-driven test automation for UiPath
Topics covered:
What is generative AI
Test Automation with generative AI and Open AI.
UiPath integration with generative AI
Speaker:
Deepak Rai, Automation Practice Lead, Boundaryless Group and UiPath MVP
In the rapidly evolving landscape of technologies, XML continues to play a vital role in structuring, storing, and transporting data across diverse systems. The recent advancements in artificial intelligence (AI) present new methodologies for enhancing XML development workflows, introducing efficiency, automation, and intelligent capabilities. This presentation will outline the scope and perspective of utilizing AI in XML development. The potential benefits and the possible pitfalls will be highlighted, providing a balanced view of the subject.
We will explore the capabilities of AI in understanding XML markup languages and autonomously creating structured XML content. Additionally, we will examine the capacity of AI to enrich plain text with appropriate XML markup. Practical examples and methodological guidelines will be provided to elucidate how AI can be effectively prompted to interpret and generate accurate XML markup.
Further emphasis will be placed on the role of AI in developing XSLT, or schemas such as XSD and Schematron. We will address the techniques and strategies adopted to create prompts for generating code, explaining code, or refactoring the code, and the results achieved.
The discussion will extend to how AI can be used to transform XML content. In particular, the focus will be on the use of AI XPath extension functions in XSLT, Schematron, Schematron Quick Fixes, or for XML content refactoring.
The presentation aims to deliver a comprehensive overview of AI usage in XML development, providing attendees with the necessary knowledge to make informed decisions. Whether you’re at the early stages of adopting AI or considering integrating it in advanced XML development, this presentation will cover all levels of expertise.
By highlighting the potential advantages and challenges of integrating AI with XML development tools and languages, the presentation seeks to inspire thoughtful conversation around the future of XML development. We’ll not only delve into the technical aspects of AI-powered XML development but also discuss practical implications and possible future directions.
GraphSummit Singapore | The Future of Agility: Supercharging Digital Transfor...Neo4j
Leonard Jayamohan, Partner & Generative AI Lead, Deloitte
This keynote will reveal how Deloitte leverages Neo4j’s graph power for groundbreaking digital twin solutions, achieving a staggering 100x performance boost. Discover the essential role knowledge graphs play in successful generative AI implementations. Plus, get an exclusive look at an innovative Neo4j + Generative AI solution Deloitte is developing in-house.
In his public lecture, Christian Timmerer provides insights into the fascinating history of video streaming, starting from its humble beginnings before YouTube to the groundbreaking technologies that now dominate platforms like Netflix and ORF ON. Timmerer also presents provocative contributions of his own that have significantly influenced the industry. He concludes by looking at future challenges and invites the audience to join in a discussion.
Essentials of Automations: The Art of Triggers and Actions in FMESafe Software
In this second installment of our Essentials of Automations webinar series, we’ll explore the landscape of triggers and actions, guiding you through the nuances of authoring and adapting workspaces for seamless automations. Gain an understanding of the full spectrum of triggers and actions available in FME, empowering you to enhance your workspaces for efficient automation.
We’ll kick things off by showcasing the most commonly used event-based triggers, introducing you to various automation workflows like manual triggers, schedules, directory watchers, and more. Plus, see how these elements play out in real scenarios.
Whether you’re tweaking your current setup or building from the ground up, this session will arm you with the tools and insights needed to transform your FME usage into a powerhouse of productivity. Join us to discover effective strategies that simplify complex processes, enhancing your productivity and transforming your data management practices with FME. Let’s turn complexity into clarity and make your workspaces work wonders!
zkStudyClub - Reef: Fast Succinct Non-Interactive Zero-Knowledge Regex ProofsAlex Pruden
This paper presents Reef, a system for generating publicly verifiable succinct non-interactive zero-knowledge proofs that a committed document matches or does not match a regular expression. We describe applications such as proving the strength of passwords, the provenance of email despite redactions, the validity of oblivious DNS queries, and the existence of mutations in DNA. Reef supports the Perl Compatible Regular Expression syntax, including wildcards, alternation, ranges, capture groups, Kleene star, negations, and lookarounds. Reef introduces a new type of automata, Skipping Alternating Finite Automata (SAFA), that skips irrelevant parts of a document when producing proofs without undermining soundness, and instantiates SAFA with a lookup argument. Our experimental evaluation confirms that Reef can generate proofs for documents with 32M characters; the proofs are small and cheap to verify (under a second).
Paper: https://eprint.iacr.org/2023/1886
Observability Concepts EVERY Developer Should Know -- DeveloperWeek Europe.pdfPaige Cruz
Monitoring and observability aren’t traditionally found in software curriculums and many of us cobble this knowledge together from whatever vendor or ecosystem we were first introduced to and whatever is a part of your current company’s observability stack.
While the dev and ops silo continues to crumble….many organizations still relegate monitoring & observability as the purview of ops, infra and SRE teams. This is a mistake - achieving a highly observable system requires collaboration up and down the stack.
I, a former op, would like to extend an invitation to all application developers to join the observability party will share these foundational concepts to build on:
Climate Impact of Software Testing at Nordic Testing DaysKari Kakkonen
My slides at Nordic Testing Days 6.6.2024
Climate impact / sustainability of software testing discussed on the talk. ICT and testing must carry their part of global responsibility to help with the climat warming. We can minimize the carbon footprint but we can also have a carbon handprint, a positive impact on the climate. Quality characteristics can be added with sustainability, and then measured continuously. Test environments can be used less, and in smaller scale and on demand. Test techniques can be used in optimizing or minimizing number of tests. Test automation can be used to speed up testing.
3. Duration:
Date Started: February 25, 2013
Date Ended: : May 26, 2014
Development Zone: Education
Summary of Financial Report:
Total budget: P 5,000.00
Actual Expenditure: P 5,000.00
4. Abstract:
• This study was conducted to determine the consumers’
awareness level on their rights and responsibilities among the
residents of the four urban barangays of the City of Mati.
There was a total of 280 identified respondents who were
made to answer the sub problem 1 and 2, 140 respondents for
sub problem 3, and 140 respondents were made to answer sub
problem 4 and 5. 20 questionnaires were rejected . The survey
made use of stratified random sampling method. One shot
survey design and the interview questionnaire as data
gathering instrument was employed. Data were analysed
through statistical tools such as simple frequency counts and
percentages.
•
5. Abstract:
• On respondents’ demographic characteristics, results
showed that majority of the respondents were females (59%),
those that were married (67.5%), those that belonged to the
41-50 age bracket got (45%), respondents under high school
and college level were ( 60.7%) and those self-employed
were (28.9%).
• On respondents’ buying experiences, 179 or 64% had bad
experience in buying products, either defective, spoiled, not
functioning or substandard. Of the 179, 64 or 22.9 % of the
total, had asked for replacement or exchange; 53 or 18.9%
returned the item, and 46 or 16.4% of the 280 respondents
did not file complaint. 16 or 5.7% of the 280 respondents
answered “did not know what to do.”
6. Abstract:
• . FINDINGS
SOCIO- DEMOGRAPHY: Majority/ High Percentage are
Respondents
Female
Married
Age bracket
41-50
High
school &
college
level
Self-
employed
Income
bracket
59% 67.5% 24% 60.7% 28.9% 66.8%=
P5,990-less
7. Abstract:
•On respondents’ buying experiences,
179 or 64% had bad experience in buying products,
either defective, spoiled, not functioning or substandard. Of
the 179, 64 or 22.9 % of the total, had asked for replacement
or exchange; 53 or 18.9% returned the item, and 46 or 16.4%
of the 280 respondents did not file complaint. 16 or 5.7% of
the 280 respondents answered “did not know what to do.”
8. Abstract:
• , RESPONDENTS’ BUYING EXPERIENCES
Responden
ts’ buying
experience
s
Bad
experiences
Replace
ment
Returned
the items
Did not
file
complaint
Reason for
no complain=
NOT KNOW
WHAT TO DO
64% 22.9% 18.9% 16.4% 5.7%
9. Abstract:
• Of the 46 respondents who did not file complaint,
25 or 54.3% had reasoned, ‘ no time to complain”.
while 39. 2% either they fear to complain ( 19.6%) and did
not know how to complain( 19. 6 % ).
10. Abstract:
• .
REASON FOR NOT FILING COMPLAINT
No time to
complain
Fear to
complain
Do not know
how to complain
Do not know the
right thing to do Total
54.3% 19.6% 19.6% 6.5% 100%
11. Abstract:
•
•With regards to their rights, respondents had
–A) high level of consumer awareness with their right to
information, safety and right to basic needs.
– B) low level of awareness on their right to choose,
right to redress, to representation, to healthy environment
and to consumer education.
–C) Over all, respondents had low awareness level on
their consumer rights.
12. Introduction:
•With impact of industrialization and
manufacturing companies, more and more goods and
services are made available to the consumers. Along
with this rapid social changes, consumers are more
vulnerable to substandard products and false services
due to malpractices of traders and manufacturing
entities who are motivated alone by material gains.
13. Introduction:
•So consumer laws were promulgated to safeguard
consumers against these practices
•With the legal basis, consumers’ rights and responsibilities
are defined.
•To what extent do consumers are aware of their rights and
responsibilities?
• Results of this study will assist the Trade and Industry
Department in plotting its direction of emphasis towards a
better consumer education strategy.
14. Objectives :
General Objective: to determine the
consumers’ level of awareness on their
consumer rights and responsibilities.
15. Specific objectives: TO FIND OUT
1.their socio-demographic characteristics.
2.the respondents’ buying experiences.
3.their awareness level on their consumers’ rights.
4.their awareness level on their consumers’ buying
responsibilities.
5.their awareness level on agencies responsible for
the implementation of consumers’ rights.
16. Methodology:
Research Locale of the Study
The study was conducted in four (4)
barangays of Mati, City, Davao Oriental. These
barangays are: Barangay Sainz, Central, Matiao
and Dahican.
•Respondents of the Study
The respondents of the study were obtained
from the four barangays of Mati City: Baranagy
Sainz, Barangay Central, Barangay Matiao, and
Baranagy Dahican respectively.
17. Methodology:
• The Sampling Method
• Stratified sampling methods with proportionate
allocation of the respondents per barangay
done using random selection sampling.
18. Methodology:
Research Design Instrument
One-shot survey design using interview
guide to gather data.
•Methods of Analysis
•Data were computed, analyzed and interpreted using
percentages and frequency counts.
19. Methodology:
• .
Awareness Level on their Rights and Responsibilities
Consumer’s Rights Definitely Yes Yes No Definitely No Hard to Say
Consumer’s
Responsibilities Definitely Yes Yes No Definitely No Hard to Say
Awareness on
Implementing
Agencies
Definitely Yes Yes No Definitely No Hard to Say
AWARENESS LEVEL
(Threshold Level)
NO AWARENESS LEVEL
Definitely Yes Yes No Definitely
No
Hard to
Say
HIGH level of
awareness
LOW level of
awareness
No
Definitely
No
Hard to
Say
50% and up 01-49% 0
In determining the level of awareness, the following guide for decision is
made .
20. Methodology:
Research Design Instrument
One-shot survey design using interview
guide to gather data.
•Methods of Analysis
•Data were computed, analyzed and interpreted using
percentages and frequency counts.
21. V111.Results and Discussion
.
Table 1.1 Frequency Counts and the Percentages on the Sex of the Respondents.
Sex Frequency (F) Percentage (%)
Male
Female
Total
114
166
280
41
59
100
I. Socio- demographic profile of the Respondents
22. V111.Results and Discussion
.Table 1.2 Frequency Counts and the Percentages on the
Age Brackets of the Respondents
Age level Frequency Percentage
20 or below 32 11.4%
21-30 56 20.%
31-40 58 20.7%
41-50 68 24.3%
51-60 25 8.9%
61 and above 41 14.6%
Total 280 100%
23. V111.Results and Discussion
.
Table1.3 Frequency Counts and the Percentages
on the Status of the Respondents
Marital Status Frequency Percentage
Single 62 22.1%
Married 196 67.5%
Divorced/
Widowed/separated
29
10.4%
Total 280 100%
24. V111.Results and Discussion
Table 1.4 Frequency Counts and the Percentage on the
Educational Attainment of the Respondents.
Education level Frequency Percentage
Elementary 65 23.2%
High school level 84 30.0%
College level 86 30.7%
College graduate 45 16.1%
Total 280 280
25. V111.Results and Discussion
Table1.5 Frequency Counts and the Percentage on the
Occupation of the Respondents
Occupation Frequency Percentage
Farmer 14 5%
Fishermen 15 5.4%
Laborer 41 14.6%
Government employee 63 22.5%
Self-employed 81 28.9%
Others ( did not
answer )
66
23.6%
total 280 100%
26. V111.Results and Discussion
.
Table 1.6 Frequency Counts and the Percentage
on the Household monthly income bracket.
Household income Frequency Percentage
Less than P2,999 93 33.2%
P3,000 to P5,999 94 33.6%
P6,000 to P8,999 43 15.4%
P9,000 to $11,999 20 7.1%
P12,000 to P14,999 8 2.9%
P 15,000 and
above
22 7.9%
Total 280 100%
27. V111.Results and Discussion
Table 11.1 Frequency Counts and the Percentage
on the Consumers’ Buying Experiences
Dissatisfied buying
experience
Frequency Percentage
Yes 179 64%
No 101 36%
Total 280 100%
• .
28. V111.Results and Discussion
.
Table 11.2 Frequency Counts and the Percentage on the
Consumers’ Action Taken on Dissatisfied Buying Experiences
Action taken Frequency
( 280)
Percentage
Asked to
replace/exchange 64
22.9%
Returned it 53 18.9%
Did not complain 46 16.4%
Do not know what to
do 16
5.7%
Total 179 64% ( of 280)
29. V111.Results and Discussion
Table 11.3. Frequency Counts and the Percentage on the
Consumers’ Reason for not making complaint.
Action Frequency Percentage
No time to complain 25 54.3%
Fear to complain 9 19.6%
Do not know how to
complain 9 19.6%
Do not know the right
thing to do 3 6.5%
Total 46 100%
30. V111.Results and Discussion
Table 11.3. Frequency Counts and the Percentage on the
Consumers’ Reason for not making complaint.
Action Frequency Percentage
No time to complain 25 54.3%
Fear to complain 9 19.6%
Do not know how to
complain 9 19.6%
Do not know the right
thing to do 3 6.5%
Total 46 100%
31. V111.Results and Discussion
Table 111.1. Awareness Level on Respondents’ Right to Information
Statement Definitely
Yes
Yes No
Definite
ly No
Hard to
Say
Total/
Percentage
1.
69
59 8 2 2
140
49.3% 42.1% 5.7% 1.4% 1.4% 100%
2.
92** 28
8
11 1
140
65.7%* 20.0% 5.7% 7.9 % .7% 100%
3
65**
54 20 0 1
140
46.4% 38.6% 14.3% 0.0% 1.% 100%
Average
75.3 47 12 4.3 1.6 140
53.8% 33.6 8.6 3.1 1.3 100%
32. V111.Results and Discussion
.
Table 111.2 Awareness Level on Respondents’ Right to
Safety
State
ment
Definitely
Yes
Yes No
Defin
ite
ly No
Hard to
Say
Total/
Percent
age
1
70*** 42 20 5 3 140
50.0% 30.0% 14.3%
3.6
%
2.5% 100%
33. V111.Results and Discussion
Table 111.3 Awareness Level on Respondents’ Right to Choose
Statement Definitely
Yes
Yes No
Defini
te
ly No
Hard to
Say
Total/
Percenta
ge
1.
48
77 12 0 3 140
34.3% 55.0% 8.6% 0.0% 2.1% 100%
2.
42 79 15 0 4 140
30.0% 56.4% 10.7% 0.O 2.9% 100%
Average
45 78 13.5 0 3.5 140
32.15% 55.7% 9.65% 0 2.5% 100%
• .
34. V111.Results and Discussion
.Table 111.4 Awareness Level on Respondents’ Right to Redress
Stateme
nt
Definitely
Yes
Yes No
Definite
ly No
Hard to
Say
Total
Count/
Percentag
e
1.
60 74 4 1 1` 140
42.3% 52.9% 2.9% .7% .7% 100%
2.
50 72 8 5 5 140
35.7% 51.4% 5.7% 3.6% 3.6% 100%
Average
55 73 7 2.5 2.5 140
39.0% 52.2% 4.3% 2.2% 2.2% 100%
Table 111.5 Awareness Level on Respondents’ Right to Representation
Statement
Definitel
y Yes
Yes No
Definite
ly No
Hard to
Say
Total/
Percentag
e
1.
49 81 3 0 7 140
35.0% 57.9% 2.1% 0 5.0% 100%
35. V111.Results and Discussion
.
Table 111.6 Awareness Level on Respondents’ Right to Healthy and Sustainable
Environment:
State
ment Definitely Yes Yes No
Definite
ly No
Hard to
Say
Total
Count/
Percentage
1.
67 70 3 0 0 140
48.% 50.0% 2.0% 0 0 100%
2.
50 84 2 0 4
140
36.0% 60.0% 1.4% 2.8% 100%
Average
58.5 77 2.7 0 2.00 140
42.0% 55.0% 1.7% 0.0% 1.4% 100%
Table 111.7 Awareness Level on Respondents’ Right to Consumer Education
State
ment
Definitely
Yes
Yes No
Definite
ly No
Hard to
Say
Total
Count/
Percentag
e
1.
61 76 1 1 1 140
43.6% 54.3% 1.0% 1.0% 1.0% 100%
36. V111.Results and Discussion
Table 111.8 Awareness Level on Respondents’ Right to Basic Need
Statement Definitely
Yes
Yes No
Defini
te
ly No
Hard to
Say
Count/
Percenta
ge
1.
66 64 4 6 0 140
47.0% 46.0% 3.0% 3.0% 100%
2.
77 27 20 16 0 140
55.0% 19.3 14.3% 11.2% 0 100%
Average
71 45 24 0 0 140
51.0% 32.65% 8.7% 7.1% 0.0% 100%
38. V111.Results and Discussion
.
Consumer’s Rights
Definitely
Yes
Yes No Definitel
y
No
Hard to
Say
Decision
( level of
awareness)
1. Right to Information
75.3 47 12 4.3 1.6
HIGH
53.8 33.6 8.6 3.1 1.3
2. Right to Safety
70*** 42 20 5 3
HIGH
50.0 30.0 14.3 3.6 2.5
3. Right to Choose
45 78 13.5 0 3.5
LOW
32.15 55.7 9.65 0 2.5
4. Right to Redress
55 73 6 2.5 2.5
LOW
39.0 52.2 4.3 2.2 2.2
5. Right to Representation
49 81 3 0 7
LOW
35.0 57.9 2.1 0 5.0
6. Right to Healthy and
Sustainable Environment
55.0 19.3 14.3 11.2 0
LOW
44.2 45.3 6.55 2.3 1.6
7. Right to Consumer
Education
61 76 1 1 1
LOW
43.6 54.3 1.0 1.0 1.0
8. Right to Basic Need
71 45 24 0 0
HIGH
51.0 32.7 8.7 7.1 0.0
Average 43.6% 45.2% 6.9% 2.4% 2.0% LOW
39. V111.Results and Discussion
Table 4.1 Awareness Level of Respondents’ Consumer’s
buying Responsibilities DECISIO
N
( Awarene
ss level)
Statement
Definitel
y Yes
Yes No
Definitely
No
Hard to
Say
Count/
Percent
age
1.
87 21 4 2 6 120
HIGH
72.5% 17.5% 3.3% 1.7% 5.0% 100%
2.
83 29 6 1 1 120
HIGH
69.2% 24.2% 5.0% 1.0% 1.0% 100%
3
26 56 21 11 6 120
HIGH
21.7% 46.7% 17.5% 9.2% 5.0% 100%
Average
65.3 35.3 10.3 4.7 4.3 120
HIGH
54.5% 29.5% 8.6% 4.0% 3.6% 100%
40. V111.Results and Discussion
Table 5.1 Respondents’ Awareness Level on Agencies Tasked to
educate and Implement Consumer Rights. DECISION
( Awarenes
s level)Statement Definitely
Yes
Yes No
Definite
ly No
Hard
to Say
Count/
Percen
tage
1
8 10 28 65 9 120
LOW
6.7% 8.3% 23.3% 54.2% 7.5% 100%
2
7 21 48 35 9 120
LOW
5.8% 17.5% 40.0% 29.2% 7.5% 100%
3
63 36 3 1 17 120
HIGH
52.5% 30.% 2.5% 1.0% 14.2% 100%
Average
26 22.3 26.3 33.7 11.7 120
LOW
21.7% 18.6% 21.9% 28.1% 9.7% 100%
41. 1X. Summary, Conclusion and Recommendation
•The following are the findings:
1.Most of the respondents were females ,belonging to 31-50 age brackets are
majority and were married and also belonged to high school and college level and a
fourth were self-employed and a high percentage belonged to marginal income level.
2.On the buying experiences, more than half had bad experiences in buying. Of
those who had bad experiences, more than half had asked to replace or exchange the
items and a fourth did not complain because they had no time to complain.
3.On the awareness level of consumer’s right, respondents have high awareness
level on the right to information, right to safety and right to basic need, low awareness
level on their right to choose, right to redress, right to representation, right to consumer
education and right to healthy environment.
4.On the awareness level of consumers buying responsibilities, respondents have
high awareness level.
5.Consumers have very low awareness level on the appropriate agencies to bring
their redress.
•
42. 1X. Summary, Conclusion and Recommendation
•Based on findings, the following conclusions were drawn:
1)Majority of respondents were mostly females, belonged to the middle age
bracket and were at high school and college level, with high percentage marginal
income and self-employed.
2)Majority of the respondents have bad buying experiences and positively
response either by returning the item have them exchange and time constraint was the
main reason why consumers did not file complaint.
3)Consumers had high level of awareness on their right to information, safety and
right to basic needs but low on their right to choose, redress, representation, consumer
education and right to healthy environment.
4)On consumers’ awareness level on their consumer’s buying responsibilities,
consumers have high level of awareness.
5)On the appropriate agency to file complaint, consumers do not have enough
awareness on the appropriate agencies to bring their redress.
•
43. 1X. Summary, Conclusion and Recommendation
Recommendation
•Based on the findings and conclusions of the study, the following
recommendations were drawn:
1)To the consumer educators, to focus on making consumer take action on
their rights and responsibilities as consumers.
2)To consumer advocacy group, a combination of different IEC strategies be
used continuously in order to ensure the adoption of new knowledge by the
respondents.
3)To Department of Trade and Industry and other government agencies
advocating consumer education; promote and focus on the use of interpersonal
communication strategies (e.i. seminars, meetings, trainings, house-to-house
visits) as better strategies in promoting consumer education.
4) To future researchers, to validate the results of this study by replicating the
studies to other place.
5)To future researchers, develop interpersonal communication networking
system as evolutionary strategies in promoting consumer education.