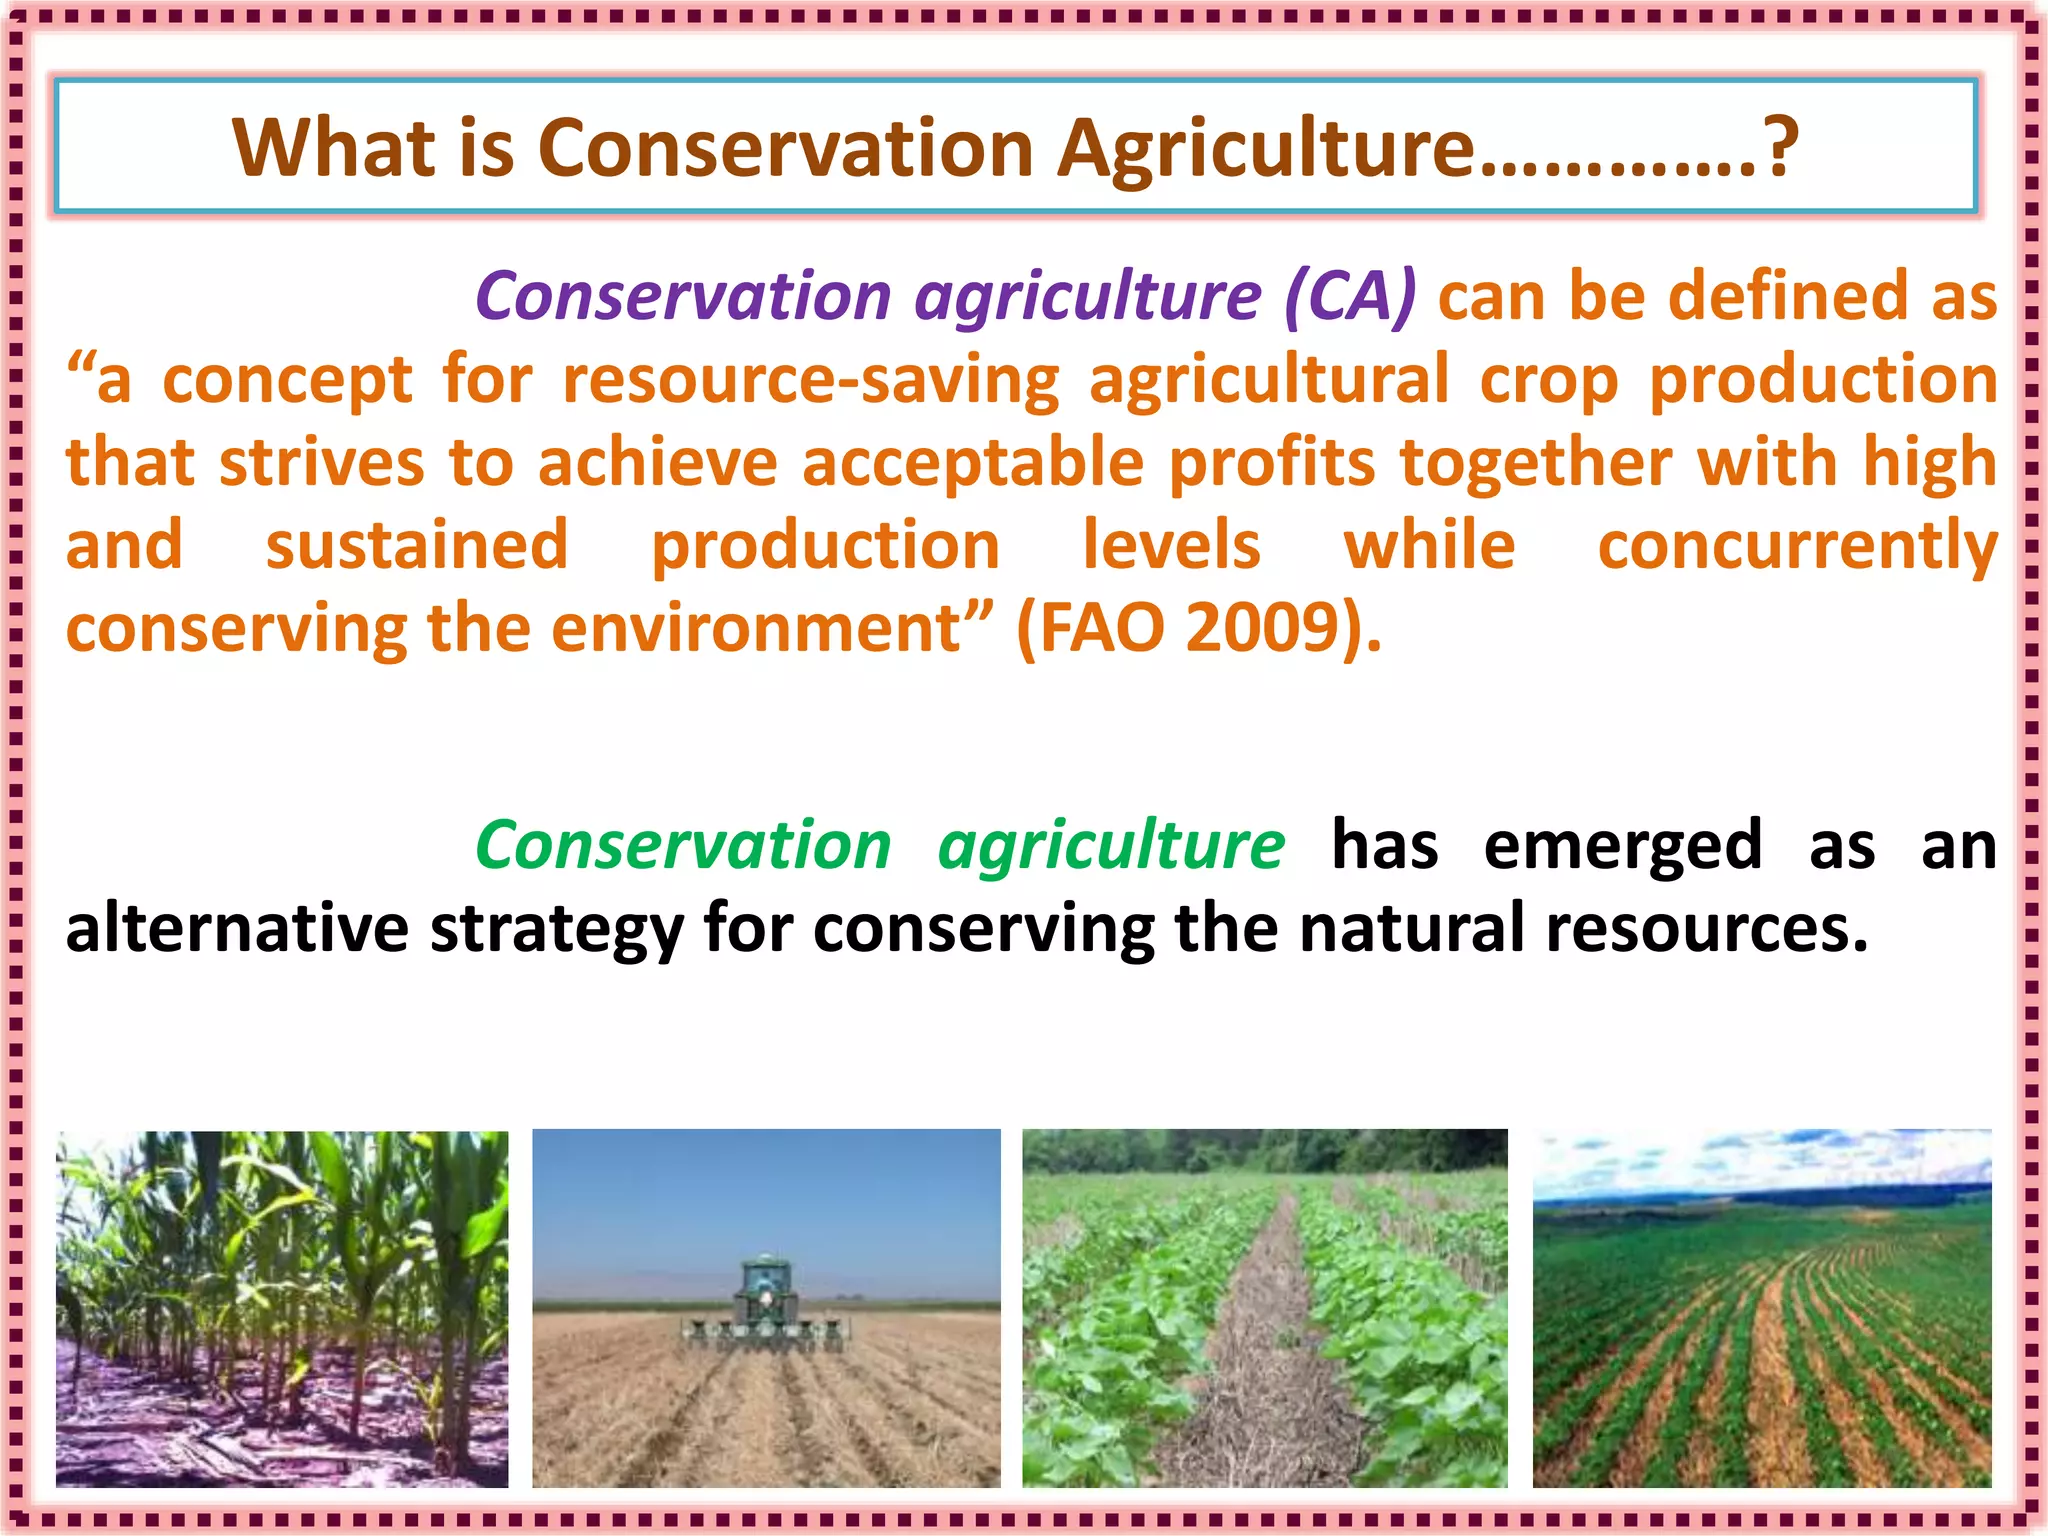
RECENT ADVANCES IN CONSERVATION
AGRICULTURE IN INDIAN CONTEXT
AMBRESHA
PALB 5183
 Green revolution has increased food grain production by
four fold since 1950-51 with adoption of HYVs, intensive
input use, extensive tillage.
 The intensive cultivation has lead to degradation of
natural resources such as soil, water, vegetation etc.
Introduction:-
Indian Scenario:-
Total cultivable area- 142.2 m ha
Total degraded area – 120.7 m ha
 Rainfed - 87 m ha (Contribues 44% of food needs)
 Irrigated – 62 m ha (Contribues 56% of food needs)
 Water erosion – 73.3 m ha
 Wind erosion – 12.4 m ha
 Salinlty & alkalinity – 6.64 m ha
 Soil acidity – 5.7 m ha
Problems associated with Conventional Agriculture
 Erratic rainfall distribution
 Delayed planting
 Reduction of soil fertility and physical structure
 Increased erosion
 High labour/ energy requiremet
Conservation agriculture (CA) can be defined as
“a concept for resource-saving agricultural crop production
that strives to achieve acceptable profits together with high
and sustained production levels while concurrently
conserving the environment” (FAO 2009).
Conservation agriculture has emerged as an
alternative strategy for conserving the natural resources.
What is Conservation Agriculture………….?
 The term “Conservation tillage” refers to a number of strategies and
techniques for establishing crops in a previous crop's residues, which are
purposely left on the soil surface.
 The principal benefits of conservation tillage are improved rain water
conservation and the reduction of soil erosion.
 Additional benefits include
 reduced fuel consumption
 reduced soil compaction
 reduced labour requirements
 improved soil health
FAO ,2009
Table 1: Extent of No-tillage / Conservation agriculture adoption world wide.
Fig. 1: Adoption of zero tillage in India
The principles of conservation agriculture with the most
important functions are:
1. Minimum mechanical soil disturbance
2. Permanent organic soil cover
 Erosion control
 Soil C build up
 Erosion control
 Biodiversity and environment
3. Diversified crop rotations in the
case of annual crops or plant
associations in case of perennial crops
 Pest and disease control
 Soil structure
 Biodiversity
4. Fertilizer management..?
CA practices are such practices which include….
 Direct sowing
 No-tillage
 Reduced tillage / minimum tillage
 No burning of crop residues
Permanent crop and weed residue mulch
Continuous cropland use
Crop rotations and cover crops
Specialized equipment
 Reduce surface runoff and control erosion.
 Add organic matter and improves soil
structure and tilth.
 Legumes fix atmospheric nitrogen.
Help to control weeds.
Increase soil productivity .
Residue cover/ Cover crops
Tab. 8: Water storage, runoff and evaporation from field plots at Jodhpur.
10 May to 27 October 2009 (adapted from Russel, 1999)
Treatment Storage
(mm)
Runoff
(mm)
Evaporation
(mm)
Evaporative
loss (%)
Straw @ 2.2 t ha-1, Normal subtillage 30 26 265 83
Straw @ 4.5 t ha-1, Normal subtillage 29 10 282 88
Straw @ 4.5 t ha-1, Extra loose subtillage 54 5 262 82
Straw @ 9.0 t ha-1, Normal subtillage 87 trace 234 73
Straw @ 17.9 t ha-1 , No tillage 139 0 182 57
Straw @ 4.5 t ha-1, Disked 27 28 266 83
No straw. Disked 7 60 254 79
Contour basin listing 34 0 287 89
Singh et al., 2010Jodhpur, 2010
Note: Based on precipitation, which was 321 mm for the period
Tab. 12: Effect of tillage practices on yield and yield attribute parameters under
different tillage methods over two years (pooled data for two years)
Veersingh et al., 2011Panthnagar, Uttarakhand
Tab.13: Effect of varying tillage and crop residue management (TCRM) practices on
grain/cotton lint yield, stover yield and total P uptake of different kharif crops in
wheat-based cropping system
Tillage and
crop residue
management
Crop Mean
Maize Pigeon pea Soybean groundnut Cotton
Grain/Cotton lint yield (t ha-1)
CT-R 2.41 1.11 0.93 1.26 1.35 1.41
CT+R 2.72 1.31 1.15 1.34 1.45 1.59
ZT-R 2.06 1.09 0.76 1.09 1.31 1.26
ZT+R 2.39 1.23 0.96 1.27 1.95 1.55
CD (P=0.05) 0.13
Total P uptake (kg ha-1)
CT-R 19.1 13.2 12.6 10.9 34.1 18.0
CT+R 20.7 14.1 14.9 11.9 40.0 20.3
ZT-R 16.2 11.8 10.9 9.6 33.2 16.4
ZT+R 17.8 14.0 13.0 11.0 46.9 20.6
CD (P=0.05) 1.62
Pradhan et al., 2011IARI, New Delhi
Note; CT: Conventional tillage, ZT: Zero tillage, +R: With residue, -R: Without residue
Tab. 14: Effect of crop residue management on soil fertility of a loamy sand soil
over 11 years of the rice-wheat cropping system at Ludhiana.
Beri et al., 2005Ludhiana, Punjab
Fig. 5: Grain yield and water productivity of wheat under different crop
establishment techniques
Malik et al., 2006Hisar ( Haryana)
Tab. 16: Soil moisture status at sowing of wheat and water use efficiency
under different tillage observations in silty clay loam soil of North Bihar.
Anon., 2013PUSA (Bihar)
 Higher diversity in crop production
 Reduced risk of pest and weed infestations
 Better distribution and exploration of water and nutrients in soil profile
 Increased N fixation through legumes and improved balance of N/P/K
from both organic and mineral sources
 Increased humus formation
The effects of Crop Diversification/ Rotation
Tab. 20: Evaluation of prominent cropping systems in relation to yield, variable cost,
net returns, irrigation water applied and land use efficiency (average of 3 years)
Tewatia et al., 2009Multiloation trial, India
Pest management and
ecological balance
Tab. 24: Effect of cultural practices on survival of larvae of rice stem borers
Jaipal, 2012Hissar (Haryana)
Tab. 26: Earthworm population under various tillage treatments with
and without residue mulch
Residue
management
Direct Drilling
(NT)
Reduced Tillage
(RT)
Conventional
Tillage (CT)
Retained 18 14 5
Burnt 13 7 4
(Jaipal, 2012)Hissar (Haryana)
Reduced tillage and direct seeding with appropriate machines
that reduce costs of labour, Fuel and system of machinery.
Increased opportunities for crop diversification, better response
to market opportunities.
Mechanical weeding and inter-culture operations in dry land
crops reduce labour costs.
Mechanical placement of fertilizers below the soil surface-
improved fertilizer use efficiency
Reduced seed requirement
Improved yields of all crops
Mechanization in Conservation Agriculture
Fig. 7: Average saving of resources under resource conservation technologies
compared to conventional sowing
Singh and Sharma., 2012PDFSR, Modipuram (U.P)
72 85 60 78 84 35
Tab. 29: Comparative performance of second generation tillage machines on wheat
growth and yield parameters.
Sowing method Tillers m-2 Biomass
(t ha-1)
1000 grain
weight (g)
Yield (t ha-1)
Rotary disc drill 381 13.3 36.7 4.42
Double disc drill 260 9.8 35.0 3.39
Star wheel 228 8.3 32.8 2.96
Zero till drill 371 12.2 35.9 4.22
CD @ 5% 30 0.9 0.7 0.28
Sharma et al., 2011PDFSR, Modipuram (U.P)
Plate 1a: Double-dics drill Plate 1b: Happy seeder
Plate 1c: Star wheel/punch planter Plate 1d: Rotary disc drill
Plate 1: Different types of drills for seeding into loose residues
Plate. 5: Trash mulching in sugarcane and Rotovator for trash incorporation
Sacred groves (SG) for biological conservation
• SG are patches of greeneries conserved and protected on religious
ground mainly employing social fencing.
• “Live and let Live”
• 3 types
# Forest sacred groves
# Village sacred groves
# Vegetation patches
 Medicinal plants: Acorus calamus
Atlantia monophylla
Gardenia gummnifera
Helicteres isora
Gloriosa superba
Conclusion
۞CA known to improve physical, chemical and biological properties
of soil.
۞Nutrient, water, energy, labor and time saving was observed with
high efficiency.
۞Ecological balance is attained with sustained yield and returns.
۞CA is specific to site, crop and environment conditions.
Conservation agriculture

Conservation agriculture

  • 2.
    RECENT ADVANCES INCONSERVATION AGRICULTURE IN INDIAN CONTEXT AMBRESHA PALB 5183
  • 3.
     Green revolutionhas increased food grain production by four fold since 1950-51 with adoption of HYVs, intensive input use, extensive tillage.  The intensive cultivation has lead to degradation of natural resources such as soil, water, vegetation etc. Introduction:-
  • 4.
    Indian Scenario:- Total cultivablearea- 142.2 m ha Total degraded area – 120.7 m ha  Rainfed - 87 m ha (Contribues 44% of food needs)  Irrigated – 62 m ha (Contribues 56% of food needs)  Water erosion – 73.3 m ha  Wind erosion – 12.4 m ha  Salinlty & alkalinity – 6.64 m ha  Soil acidity – 5.7 m ha
  • 5.
    Problems associated withConventional Agriculture  Erratic rainfall distribution  Delayed planting  Reduction of soil fertility and physical structure  Increased erosion  High labour/ energy requiremet
  • 6.
    Conservation agriculture (CA)can be defined as “a concept for resource-saving agricultural crop production that strives to achieve acceptable profits together with high and sustained production levels while concurrently conserving the environment” (FAO 2009). Conservation agriculture has emerged as an alternative strategy for conserving the natural resources. What is Conservation Agriculture………….?
  • 7.
     The term“Conservation tillage” refers to a number of strategies and techniques for establishing crops in a previous crop's residues, which are purposely left on the soil surface.  The principal benefits of conservation tillage are improved rain water conservation and the reduction of soil erosion.  Additional benefits include  reduced fuel consumption  reduced soil compaction  reduced labour requirements  improved soil health
  • 8.
    FAO ,2009 Table 1:Extent of No-tillage / Conservation agriculture adoption world wide.
  • 9.
    Fig. 1: Adoptionof zero tillage in India
  • 10.
    The principles ofconservation agriculture with the most important functions are: 1. Minimum mechanical soil disturbance 2. Permanent organic soil cover  Erosion control  Soil C build up  Erosion control  Biodiversity and environment 3. Diversified crop rotations in the case of annual crops or plant associations in case of perennial crops  Pest and disease control  Soil structure  Biodiversity 4. Fertilizer management..?
  • 11.
    CA practices aresuch practices which include….  Direct sowing  No-tillage  Reduced tillage / minimum tillage  No burning of crop residues Permanent crop and weed residue mulch Continuous cropland use Crop rotations and cover crops Specialized equipment
  • 12.
     Reduce surfacerunoff and control erosion.  Add organic matter and improves soil structure and tilth.  Legumes fix atmospheric nitrogen. Help to control weeds. Increase soil productivity . Residue cover/ Cover crops
  • 13.
    Tab. 8: Waterstorage, runoff and evaporation from field plots at Jodhpur. 10 May to 27 October 2009 (adapted from Russel, 1999) Treatment Storage (mm) Runoff (mm) Evaporation (mm) Evaporative loss (%) Straw @ 2.2 t ha-1, Normal subtillage 30 26 265 83 Straw @ 4.5 t ha-1, Normal subtillage 29 10 282 88 Straw @ 4.5 t ha-1, Extra loose subtillage 54 5 262 82 Straw @ 9.0 t ha-1, Normal subtillage 87 trace 234 73 Straw @ 17.9 t ha-1 , No tillage 139 0 182 57 Straw @ 4.5 t ha-1, Disked 27 28 266 83 No straw. Disked 7 60 254 79 Contour basin listing 34 0 287 89 Singh et al., 2010Jodhpur, 2010 Note: Based on precipitation, which was 321 mm for the period
  • 14.
    Tab. 12: Effectof tillage practices on yield and yield attribute parameters under different tillage methods over two years (pooled data for two years) Veersingh et al., 2011Panthnagar, Uttarakhand
  • 15.
    Tab.13: Effect ofvarying tillage and crop residue management (TCRM) practices on grain/cotton lint yield, stover yield and total P uptake of different kharif crops in wheat-based cropping system Tillage and crop residue management Crop Mean Maize Pigeon pea Soybean groundnut Cotton Grain/Cotton lint yield (t ha-1) CT-R 2.41 1.11 0.93 1.26 1.35 1.41 CT+R 2.72 1.31 1.15 1.34 1.45 1.59 ZT-R 2.06 1.09 0.76 1.09 1.31 1.26 ZT+R 2.39 1.23 0.96 1.27 1.95 1.55 CD (P=0.05) 0.13 Total P uptake (kg ha-1) CT-R 19.1 13.2 12.6 10.9 34.1 18.0 CT+R 20.7 14.1 14.9 11.9 40.0 20.3 ZT-R 16.2 11.8 10.9 9.6 33.2 16.4 ZT+R 17.8 14.0 13.0 11.0 46.9 20.6 CD (P=0.05) 1.62 Pradhan et al., 2011IARI, New Delhi Note; CT: Conventional tillage, ZT: Zero tillage, +R: With residue, -R: Without residue
  • 16.
    Tab. 14: Effectof crop residue management on soil fertility of a loamy sand soil over 11 years of the rice-wheat cropping system at Ludhiana. Beri et al., 2005Ludhiana, Punjab
  • 17.
    Fig. 5: Grainyield and water productivity of wheat under different crop establishment techniques Malik et al., 2006Hisar ( Haryana)
  • 18.
    Tab. 16: Soilmoisture status at sowing of wheat and water use efficiency under different tillage observations in silty clay loam soil of North Bihar. Anon., 2013PUSA (Bihar)
  • 19.
     Higher diversityin crop production  Reduced risk of pest and weed infestations  Better distribution and exploration of water and nutrients in soil profile  Increased N fixation through legumes and improved balance of N/P/K from both organic and mineral sources  Increased humus formation The effects of Crop Diversification/ Rotation
  • 20.
    Tab. 20: Evaluationof prominent cropping systems in relation to yield, variable cost, net returns, irrigation water applied and land use efficiency (average of 3 years) Tewatia et al., 2009Multiloation trial, India
  • 21.
  • 22.
    Tab. 24: Effectof cultural practices on survival of larvae of rice stem borers Jaipal, 2012Hissar (Haryana)
  • 23.
    Tab. 26: Earthwormpopulation under various tillage treatments with and without residue mulch Residue management Direct Drilling (NT) Reduced Tillage (RT) Conventional Tillage (CT) Retained 18 14 5 Burnt 13 7 4 (Jaipal, 2012)Hissar (Haryana)
  • 24.
    Reduced tillage anddirect seeding with appropriate machines that reduce costs of labour, Fuel and system of machinery. Increased opportunities for crop diversification, better response to market opportunities. Mechanical weeding and inter-culture operations in dry land crops reduce labour costs. Mechanical placement of fertilizers below the soil surface- improved fertilizer use efficiency Reduced seed requirement Improved yields of all crops Mechanization in Conservation Agriculture
  • 25.
    Fig. 7: Averagesaving of resources under resource conservation technologies compared to conventional sowing Singh and Sharma., 2012PDFSR, Modipuram (U.P) 72 85 60 78 84 35
  • 26.
    Tab. 29: Comparativeperformance of second generation tillage machines on wheat growth and yield parameters. Sowing method Tillers m-2 Biomass (t ha-1) 1000 grain weight (g) Yield (t ha-1) Rotary disc drill 381 13.3 36.7 4.42 Double disc drill 260 9.8 35.0 3.39 Star wheel 228 8.3 32.8 2.96 Zero till drill 371 12.2 35.9 4.22 CD @ 5% 30 0.9 0.7 0.28 Sharma et al., 2011PDFSR, Modipuram (U.P)
  • 27.
    Plate 1a: Double-dicsdrill Plate 1b: Happy seeder Plate 1c: Star wheel/punch planter Plate 1d: Rotary disc drill Plate 1: Different types of drills for seeding into loose residues
  • 28.
    Plate. 5: Trashmulching in sugarcane and Rotovator for trash incorporation
  • 29.
    Sacred groves (SG)for biological conservation • SG are patches of greeneries conserved and protected on religious ground mainly employing social fencing. • “Live and let Live” • 3 types # Forest sacred groves # Village sacred groves # Vegetation patches  Medicinal plants: Acorus calamus Atlantia monophylla Gardenia gummnifera Helicteres isora Gloriosa superba
  • 30.
    Conclusion ۞CA known toimprove physical, chemical and biological properties of soil. ۞Nutrient, water, energy, labor and time saving was observed with high efficiency. ۞Ecological balance is attained with sustained yield and returns. ۞CA is specific to site, crop and environment conditions.