Download as PDF, PPTX


![A Comparison: SVM Vs Naïve Bays
Ravi Nakulan 3
• In order to run both the algorithms for comparison, I have used Jupyter notebook as an IDE to write my
Python codes.
• Here are the following codes and their descriptions accordingly.
• Named the file as: Clustering Model_Cancer Data_Assignment No. 04
Footnote:
*IDE: Integrated Development Environment
In[1]. Loaded Necessary Libraries:
Pandas: Mainly to work with tabular data; 2d
table object (DataFrame)
Numpy: Mainly to work with numerical data;
multi-dimensional array
Matplotlib.pyplot: To use collection of
functions to create a figure, plotting area in
figure, plot lines etc.](https://image.slidesharecdn.com/assignmentno4ravinakulandata1200-01slideshare-210319144004/85/SVM-Vs-Naive-Bays-Algorithm-Jupyter-Notebook-3-320.jpg)
![A Comparison: SVM Vs Naïve Bays…continued
Ravi Nakulan 4
• After loading the necessary libraries, we loaded our cancer.csv dataset from our respective folder
In[2]. Load Dataset
• Used the code pd.read_csv(./cancer.csv’) to
call the data
• cancer.head () gives us first 05 rows starting
from serial number 0 (zero) till number 4
• We got our top 5 rows after running our
code
• Where “Class” is our dependent variable (y)
• From id to Mitoses are the independent
variables (x)
• Our “Class” has two values 2 & 4
• 2 means: benign (no cancer)
• 4 means: malignant (cancer)](https://image.slidesharecdn.com/assignmentno4ravinakulandata1200-01slideshare-210319144004/85/SVM-Vs-Naive-Bays-Algorithm-Jupyter-Notebook-4-320.jpg)
![A Comparison: SVM Vs Naïve Bays…continued
Ravi Nakulan 5
• Dropped Class from x axis which is our dependent
variable and define as y=cancer[‘Class’].to_numpy()
• We train (20%) & test (80%) of the data and used
random_state=100 to get the same result every time
and avoid getting different results, when we run the
code
• To Standardize or Scaling the dataset sc.fit helps to
structure the data and preprocessing information of
existing categories and then sc.transform helps to
transform the preprocessing information
In[3]. We created x & y variables
• Codes and their descriptions…](https://image.slidesharecdn.com/assignmentno4ravinakulandata1200-01slideshare-210319144004/85/SVM-Vs-Naive-Bays-Algorithm-Jupyter-Notebook-5-320.jpg)
![A Comparison: SVM Vs Naïve Bays…continued
Ravi Nakulan 6
The code used as a for-loop function, and it
lookup at the first line :
and runs the code and come back again to
see if its there any other to run the code again
and creates automatically both outputs (SVM
& Naïve Bayes)
N
B
In[4]. Script for SVM and NB
S
V
M
• Codes and their descriptions…
We did the necessary imports and create the
dataset
Footnote:
*NB: Naïve Bayes](https://image.slidesharecdn.com/assignmentno4ravinakulandata1200-01slideshare-210319144004/85/SVM-Vs-Naive-Bays-Algorithm-Jupyter-Notebook-6-320.jpg)
![A Comparison: SVM Vs Naïve Bays…continued
Ravi Nakulan 7
• We got the output of our codes from in[3] & in[4]
Precision: positive predictive values
Recall: truth/sensitivity
f1-score: weighted average of Precision & Recall
Accuracy: fraction of our prediction that how much the model is right
Precision, determines how many of them actual positive, as predicted positive. No Cancer accuracy is 98%
but Cancer positive accuracy is 100%
Recall, calculates how many of the actual positives our model has predicted/captured as True Positive
So, for No Cancer it is 100% and for Cancer it is 96%. Very important to predict cancer positive patient, but
the prediction is 96% which is a concern.
f1-score: f1-score balances between Precision & Recall. So SVM no cancer score is 99% while cancer score
is 98%
Accuracy: It’s a ratio of correctly predicted observations to the total observations, which is 99%
Precision, determines how many of them actual positive, as predicted positive. No Cancer accuracy is 99%
but Cancer positive accuracy is 94%
Recall, calculates how many of the actual positives our model has predicted/captured as True Positive
So, for No Cancer it is 97% and for Cancer it is 98%. Very important to predict cancer positive patient, and it
is better than SVM prediction as 96% to 98% through NB.
f1-score: f1-score balances between Precision & Recall. So NB no cancer score is 98% while cancer score is
96%
Accuracy: It’s a ratio of correctly predicted observations to the total observations, which is 97%](https://image.slidesharecdn.com/assignmentno4ravinakulandata1200-01slideshare-210319144004/85/SVM-Vs-Naive-Bays-Algorithm-Jupyter-Notebook-7-320.jpg)
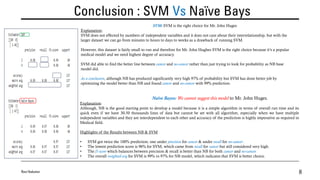

The document outlines a clustering model creation for cancer data by Ravi Nakulan, comparing the performance of Support Vector Machine (SVM) and Naïve Bayes algorithms on a cancer dataset. The analysis reveals that while Naïve Bayes provides a 97% accuracy, SVM outperforms with a 99% overall prediction accuracy, making it the preferable choice for Mr. John Hughes in a medical context. The conclusion emphasizes SVM's superior ability to handle multiple independent variables and its robust accuracy in predicting cancer outcomes.