Downloaded 24 times
![Research Methodology Graduate Study Notes by DrRijal Page 2
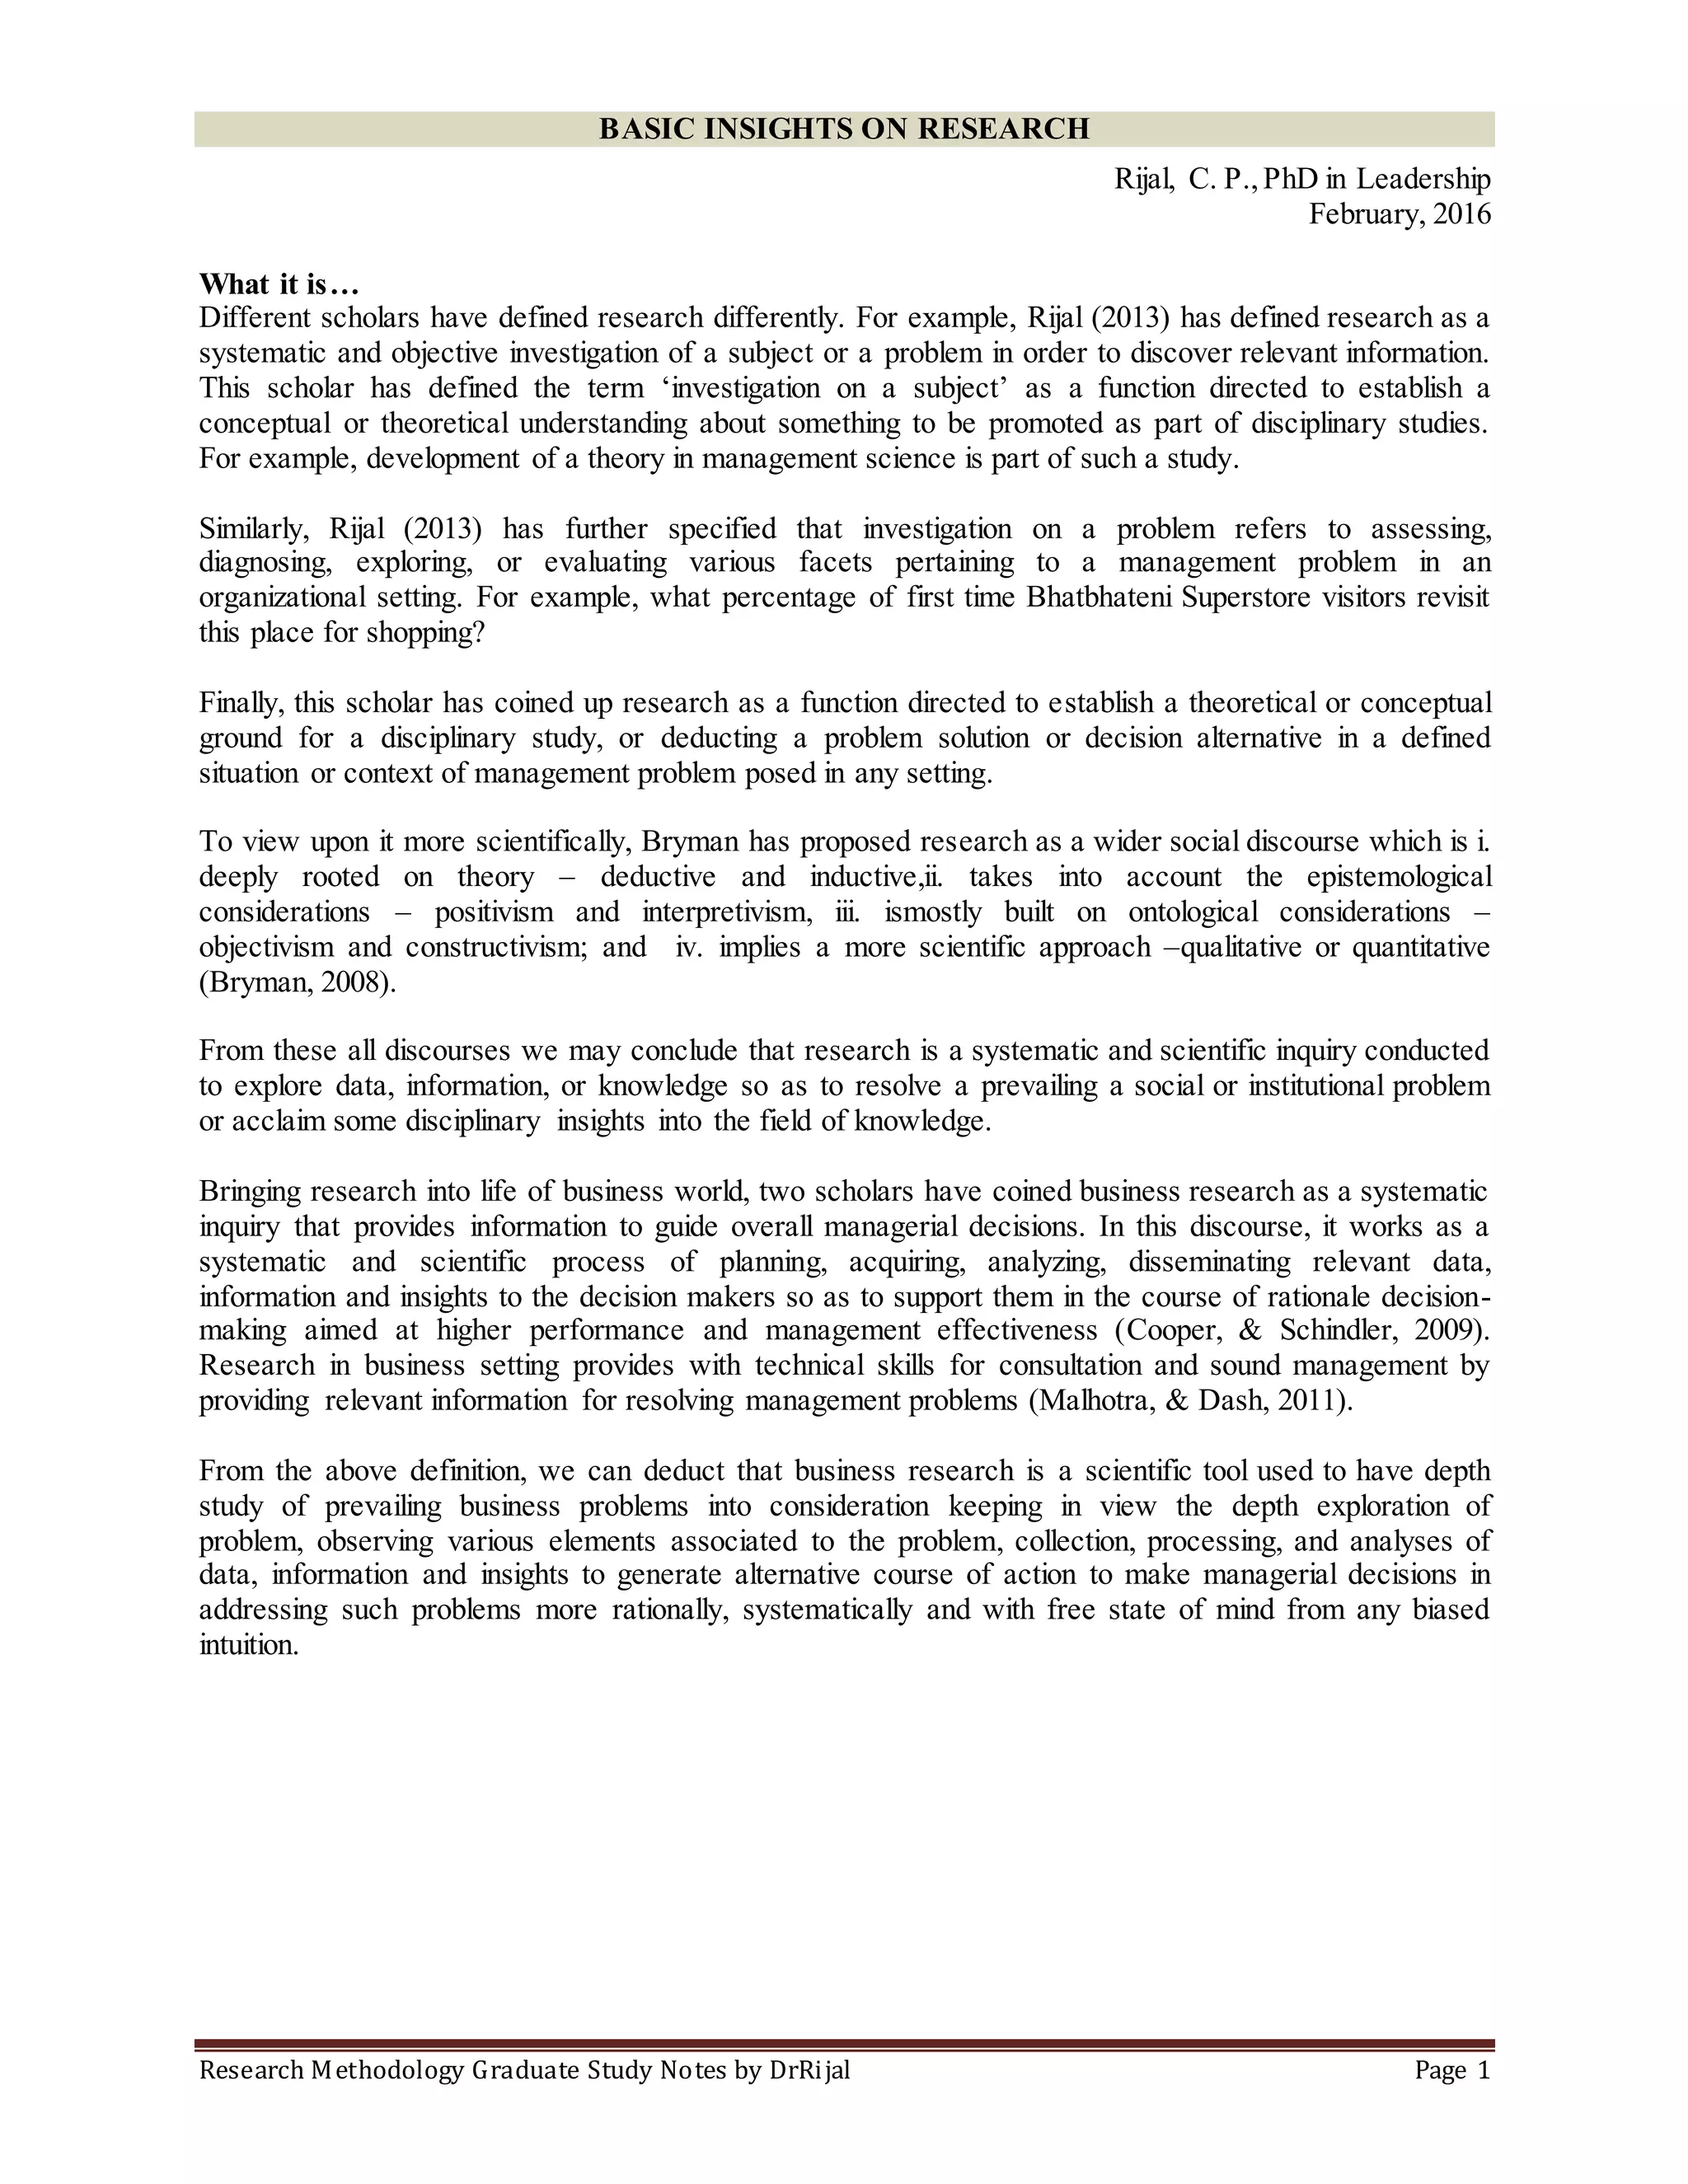
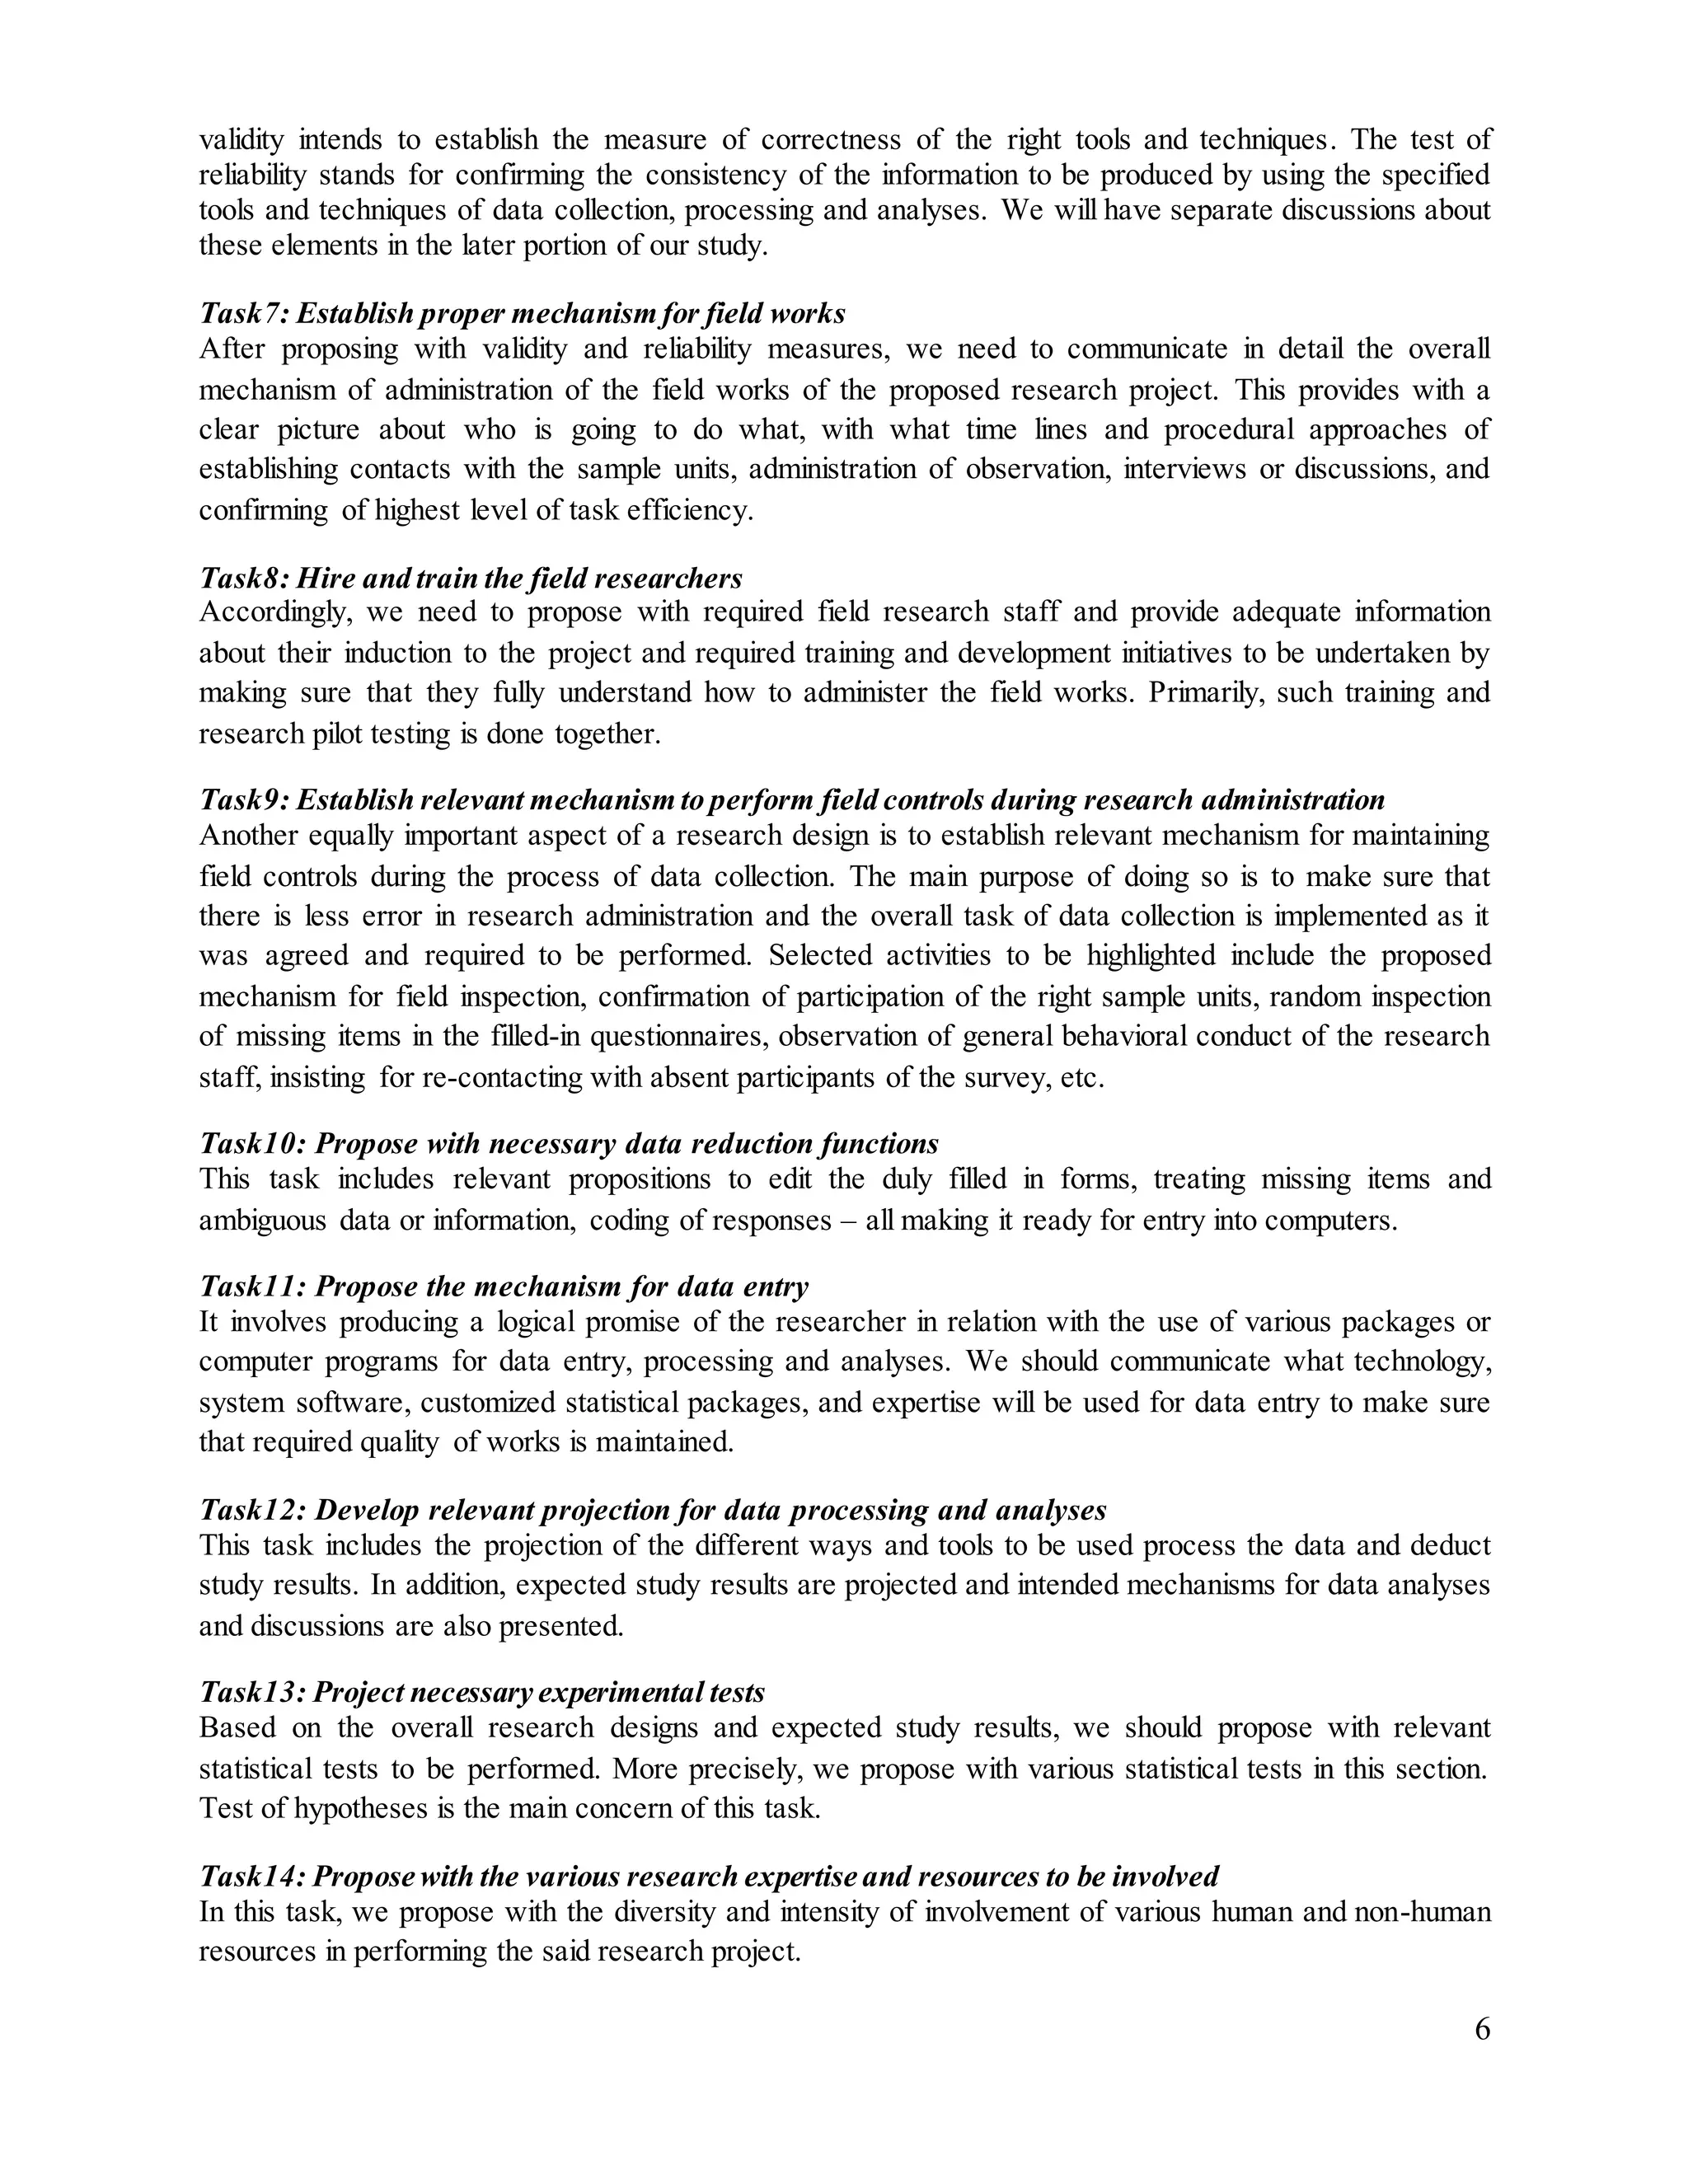
THE RESEARCH PROCESS
Step I: Explore and Define the ResearchProblem
Task1: Explore the research gap through –
preliminary review of various research publications; their study limitations, delimitations and
recommendations for further research would serve as the gap for research,
observation of general attitude and behavior of the employees in organization also may give a
glimpse of a glimpse of a problematic situation in an organizational setting; it also may serve as a
missing link for crafting an applied research for an institution,
consultation with research mentors, experts and thematic consultants would serve instrumental in
figuring out a gap for research in both academic as well as applied fields,
taking reference of newer policy developments within and beyond the nation may provide a good
indication of a research in a particular field of study, and
performing a scenario analyses of various happening and outlining the general trends also would
serve very much instrumental to figure out an issue for investigation.
Task2: Establish the purpose or objectives of the research
Craft a primary or general purpose or objective, and a few secondary objectives at functional
level.
Please remember,the following are the levels to be applied while crafting functional level
objectives in a research project:
1. Assess
2. Explore
3. Evaluate
4. Examine
5. Compare
6. Estimate
7. Propagate
Task3: Compose the statement of problem
It refers to the grand questiontaken into consideration of your inquiry.
It may be written in either affirmative, say, for example, [There exists a lot of ambiguity about the
issue of leadership readiness in the Nepalese private sector to maintain financial transparency] or
interrogative form, say, for example, [What is the overall level of readiness of leadership in the
Nepalese private sector to maintain financial transparency?]
Task4: Craft the research questions (RQ)
RQs are formed by defusing the grand question into consideration of research.
Each RQ should carry only one issue of one concern for inquiry.
Step I: Explore and Define the Research Problem
Step II: Design the Research
Step III: Administer the Research
Step IV: Perform Data Reduction and Analyses
Step V: Develop and Submit the Research Report](https://image.slidesharecdn.com/conceptualperspectivesonresearchmethods-160221154309/75/Conceptual-perspectives-on-research-methods-2-2048.jpg)
![9
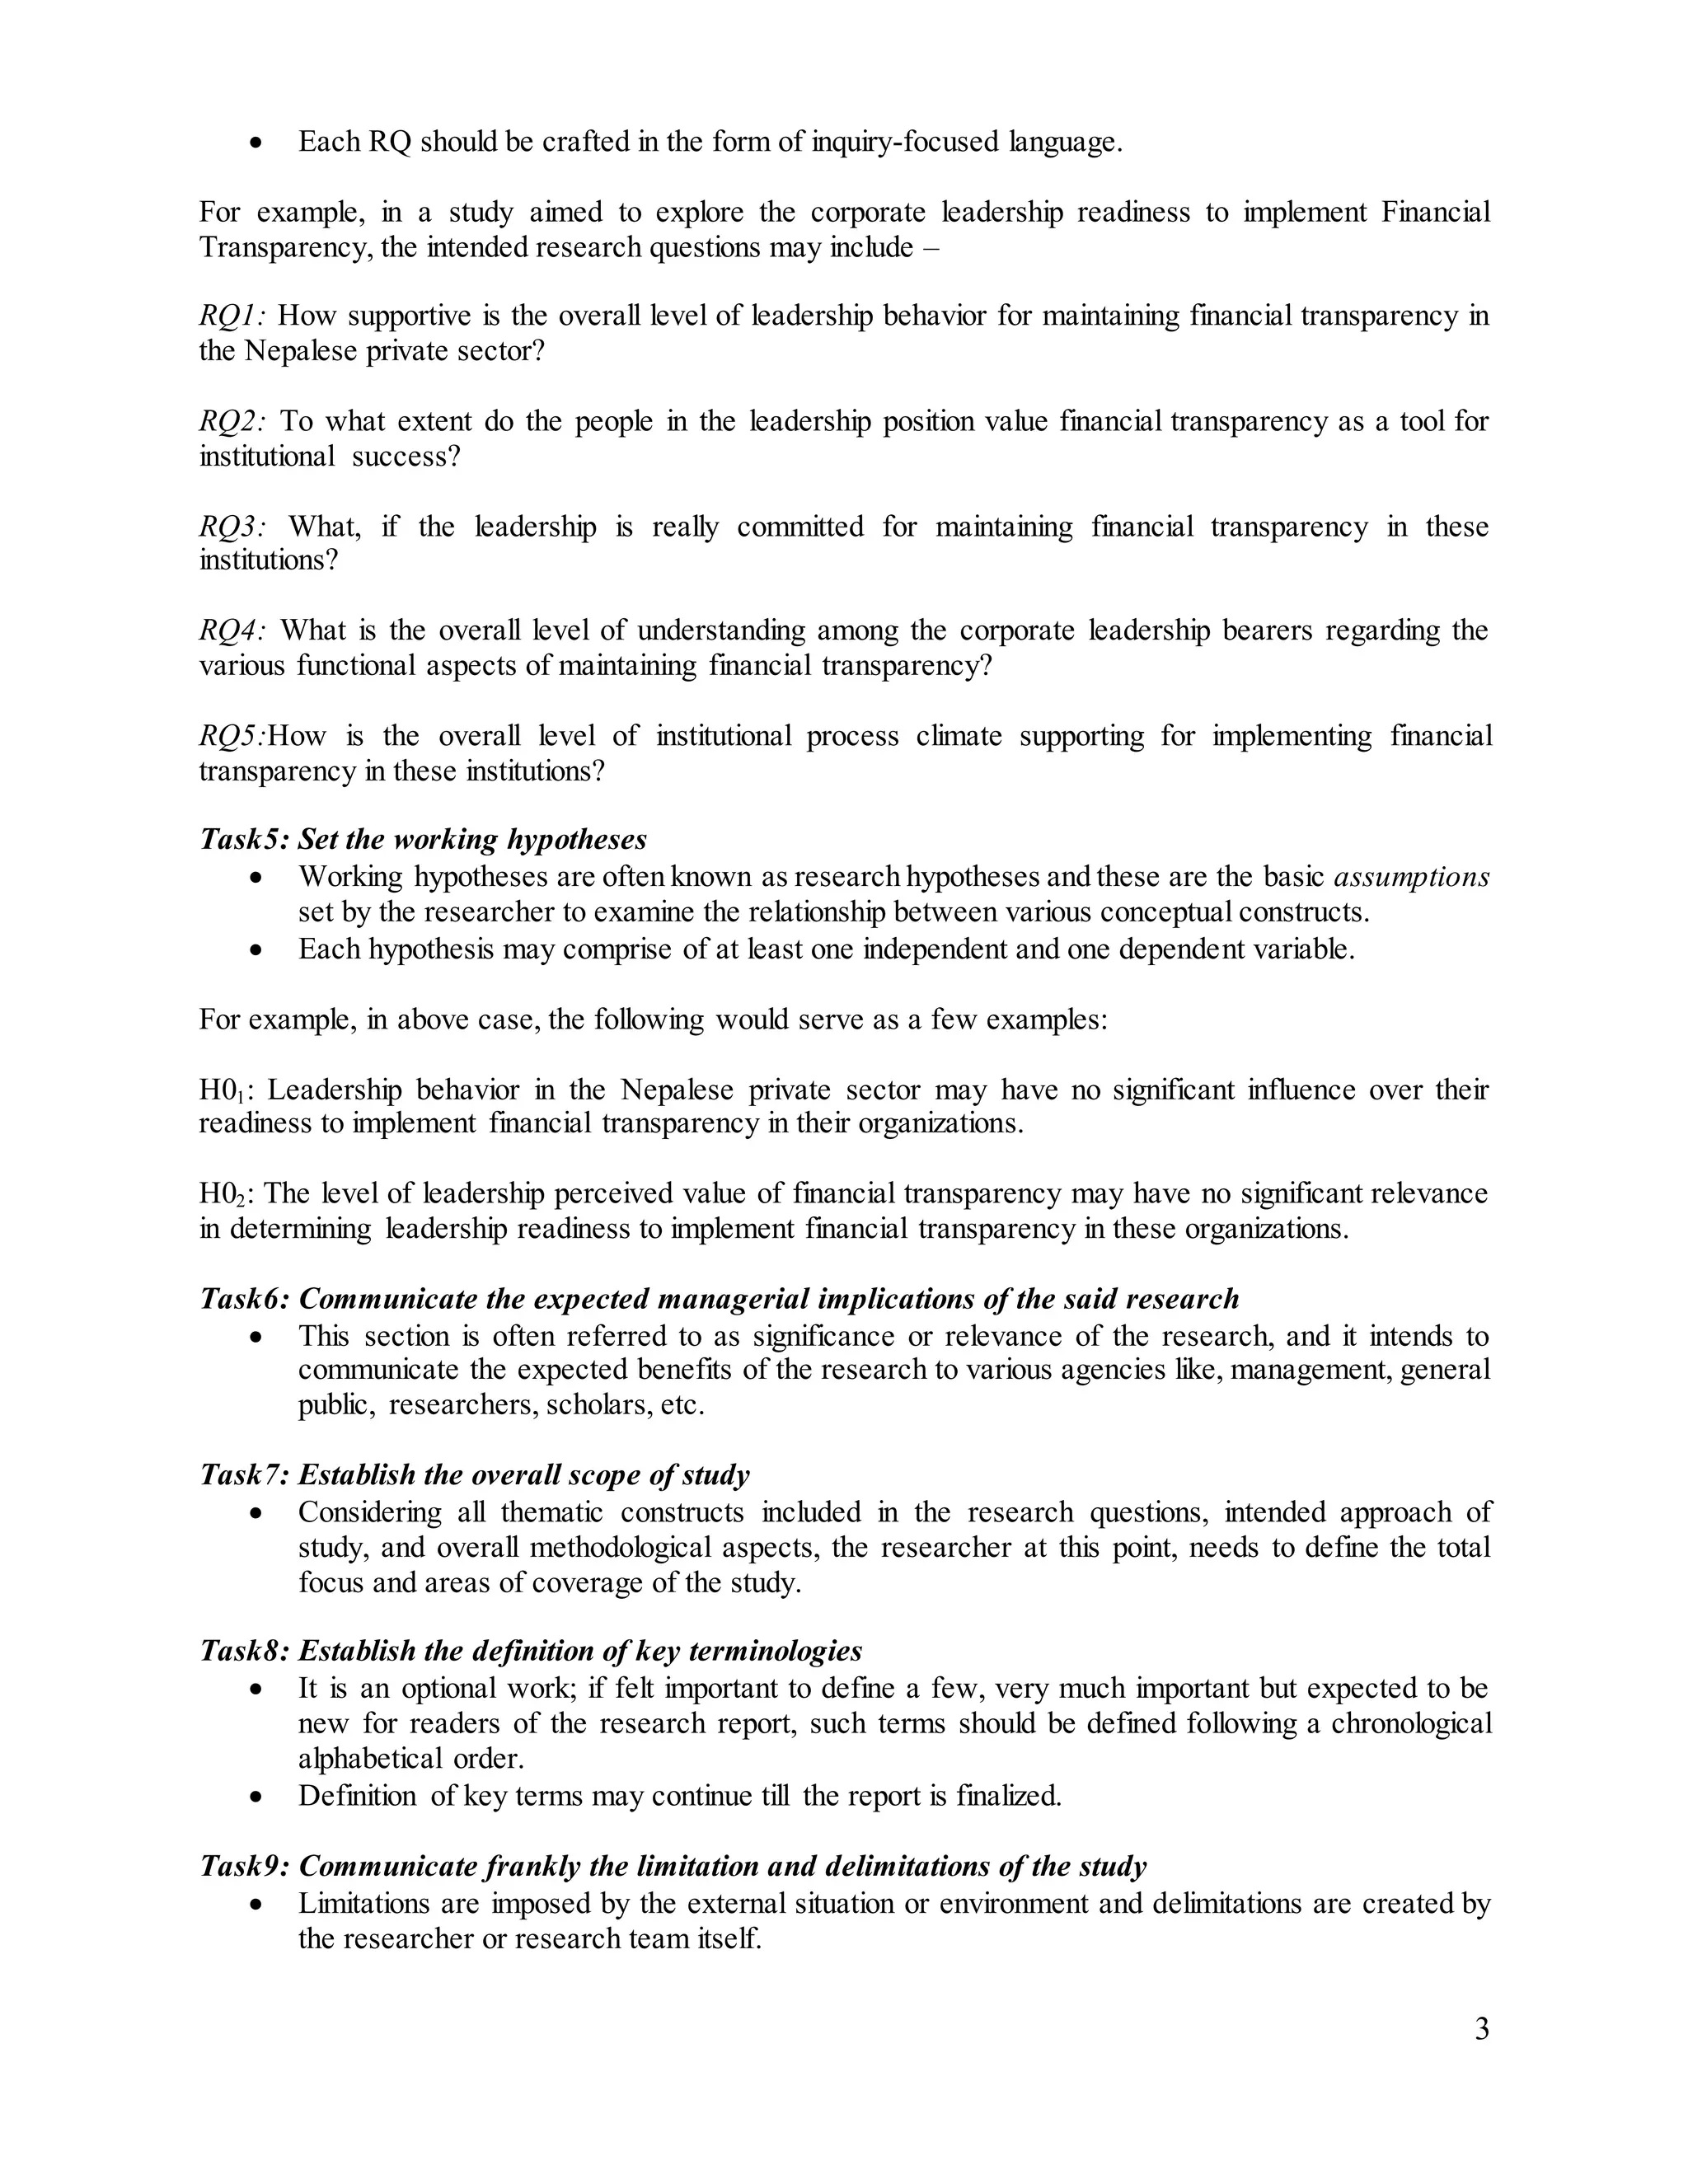
scientific research design to have relevant statistical testing of the significance of association of various
constructs as set in working hypotheses.
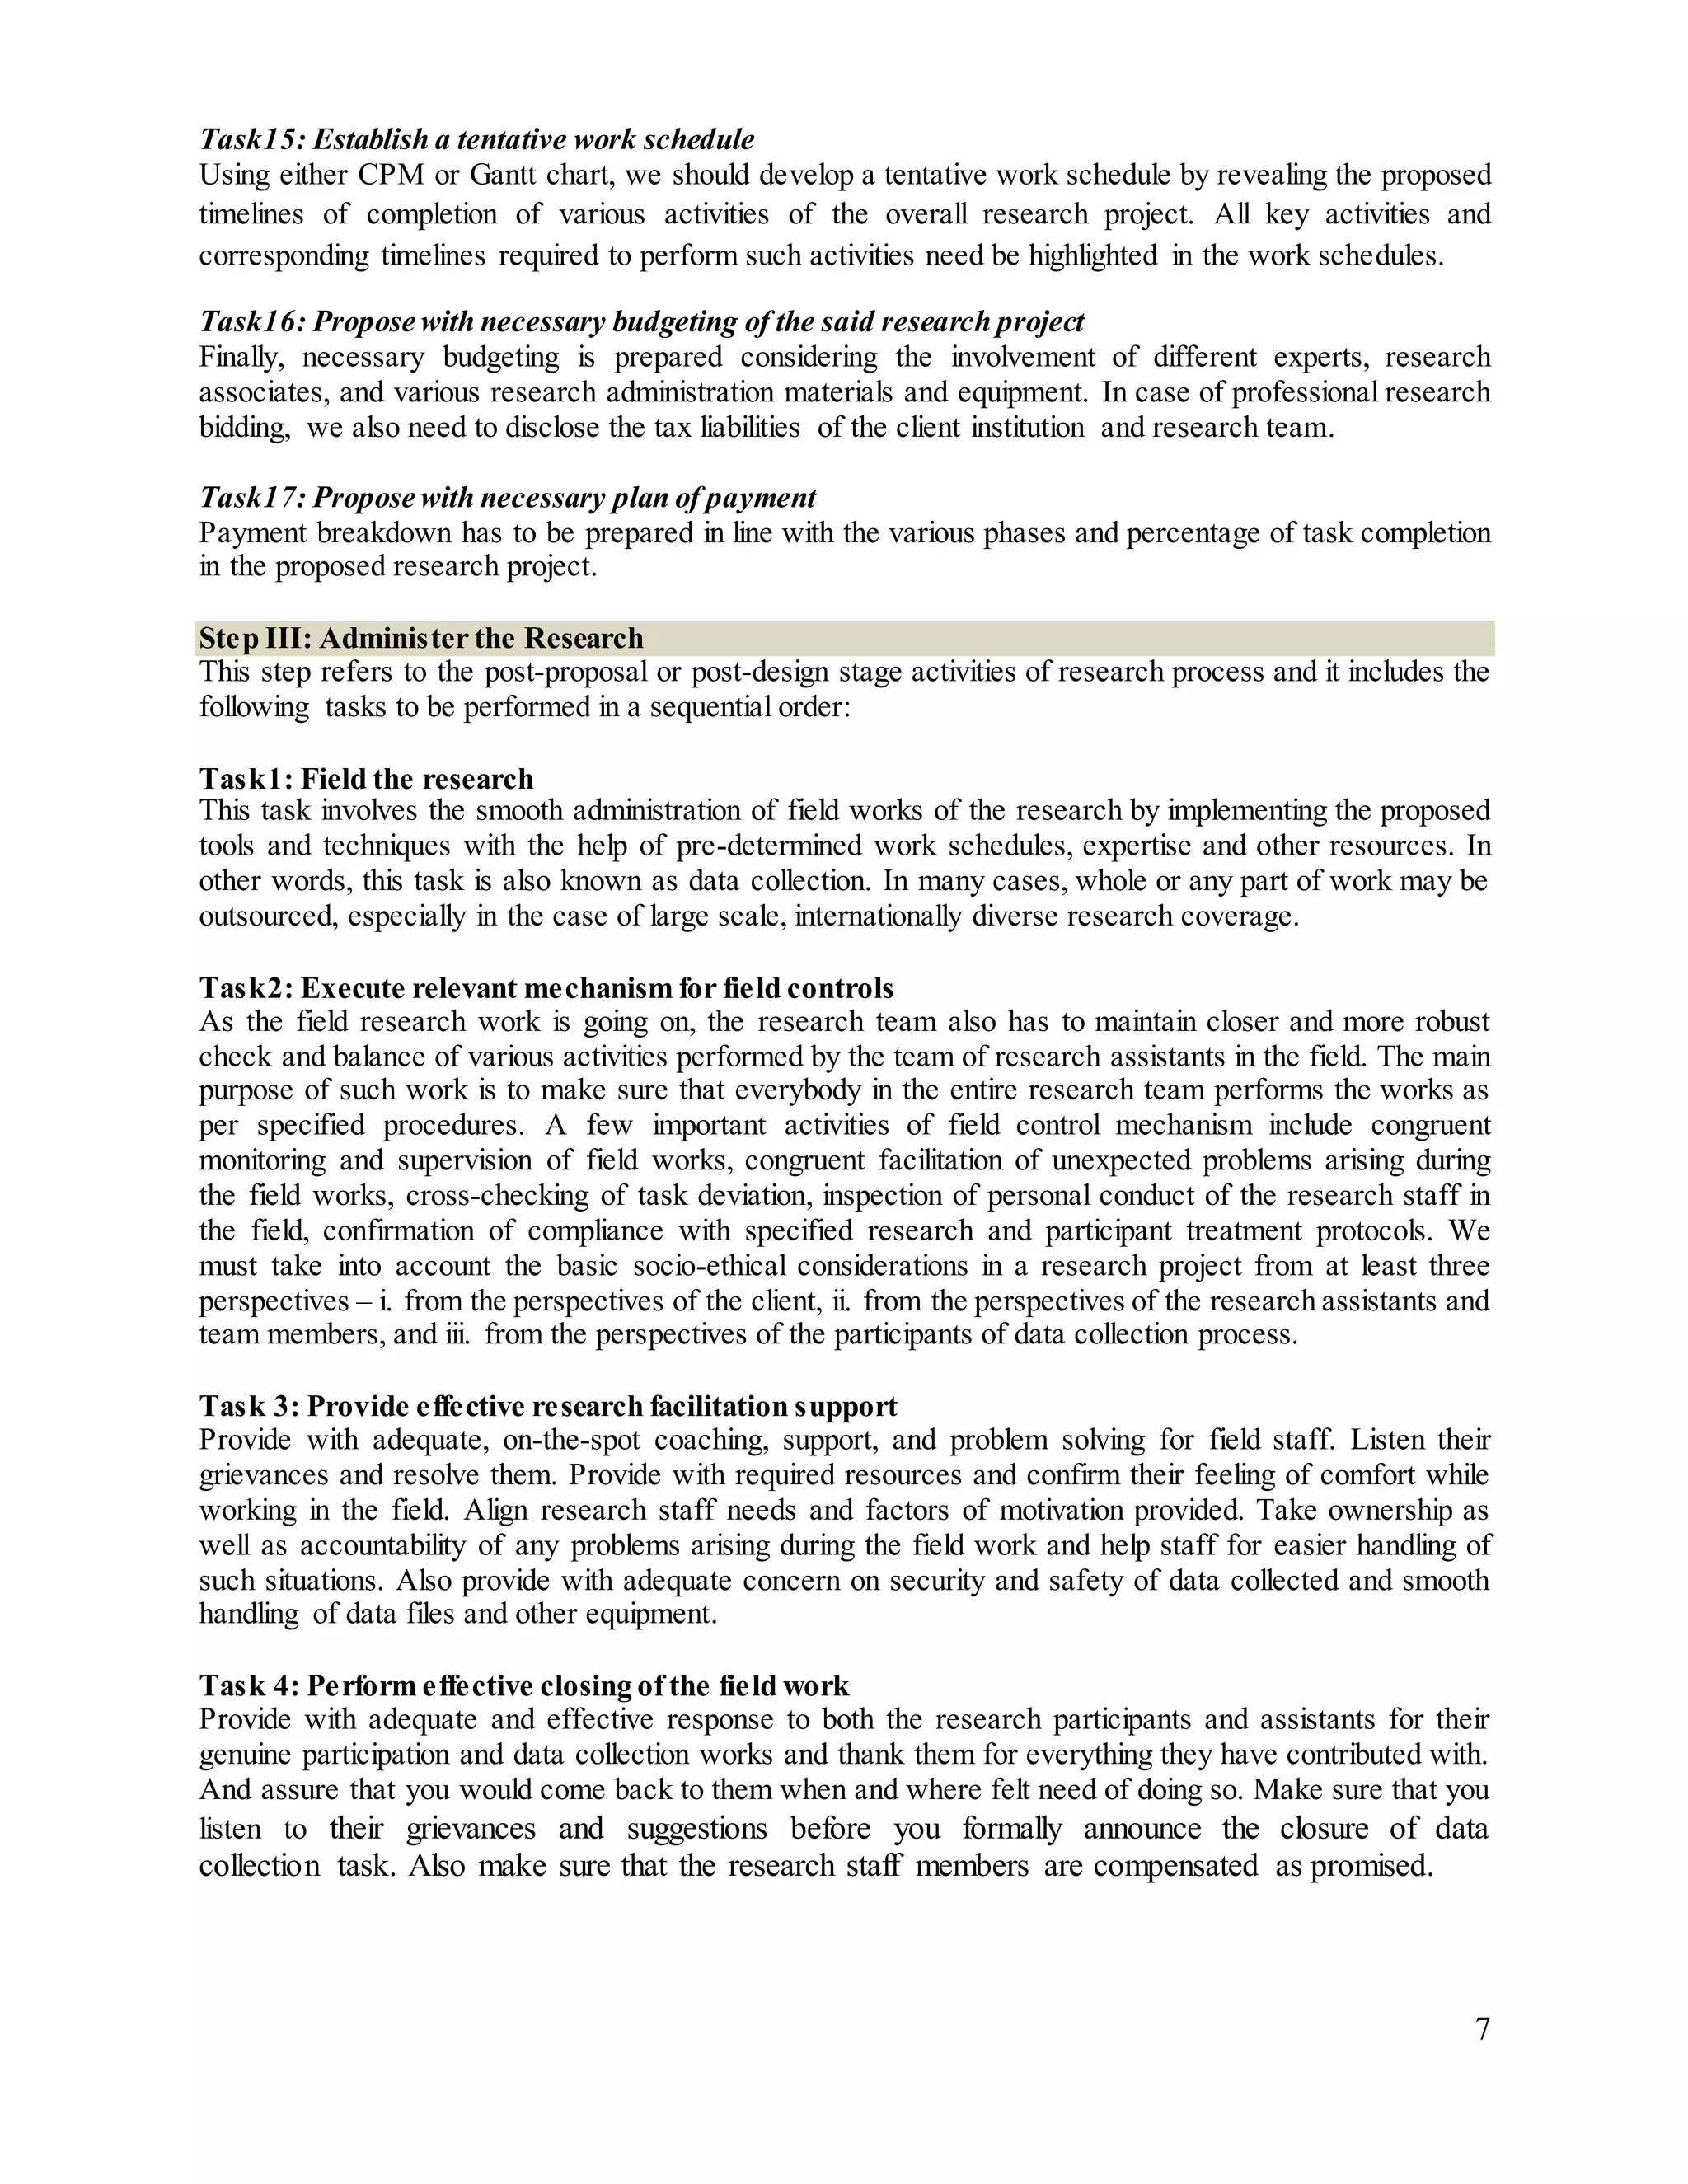
Task 8: Produce relevant inferences
Finally, based on various descriptive analyses, scientific testing and/or depth exploration of the subject
matter of inquiry, relevant statistical or technical inferences are deducted to address the prevailing
problem or subject matter taken into consideration of the research.
Step V: Develop and Submit the Research Report
As the final step of formal research system process, this step involves the activities related to preparation
of study report, its presentation and submission. Following task description provides with the detailed
accounts of activities performed in this step:
Task1: Prepare the first draft report
Following all documentation of activities related to problem definition, research design, administration of
research, treatment of data for information processing and analyses, a draft report has to be prepared.
Normally, an academic research is drafted in five distinctive chapters [Chapter 1: Introduction, Chapter 2:
Review of Literature, Chapter 3: Research Methodology, Chapter 4: Data Presentation and Analyses, and
Chapter 5: Summary, Discussions, Conclusions, and Recommendations]. Similarly, an applied or
professional research report may be crafted in four chapters or sections [Section 1: Introduction, Section2:
Research Methodology, Section 3: Data Presentation and Analyses, and Section 4: Summary,
Conclusions, and Recommendations].
Task2: Edit the draft report
After the first draft of the study report is ready, it is closely examined by respective language and
technical experts to minimize the technical, structural and grammatical errors.
Task3: Develop the second draft report
Incorporating the editing notes in the first draft report, the experts develop the second draft report making
it ready for formal presentation with respective stakeholders.
Task4: Make a presentation on second draft report and solicit feedback for improvement
Formal presentation of the report is made using relevant presentation materials accompanied with hard
copy of the second draft report. Respective participants are requested to provide necessary feedback for
further improvement. The stakeholders are asked to put forward their concerns, reservations, objections,
and suggestions for further improvement of the information and overall structural body of report.
Task5: Incorporate the feedback and prepare the final draft report
After making presentation and collecting feedback from respective stakeholders, we should revise the
draft report to give it the final shape.
Task6: Seek for final approval after confirming necessary changes or updates
As soon as the final draft is ready, we should bring it to brief discussion with the key stakeholders to
receive their final consent for production making it confirm with them that the report is developed in the
preferred shape with all required components addressed.
Task7: Prepare and submit the final report
On receiving the consent for production, we should develop final production, sign it up and submit to the
designated authority assigning the research work. In the case of professional research assignment, it is
recommended to receive a letter of task completion after submission and acceptance of the final report.](https://image.slidesharecdn.com/conceptualperspectivesonresearchmethods-160221154309/75/Conceptual-perspectives-on-research-methods-9-2048.jpg)
![10
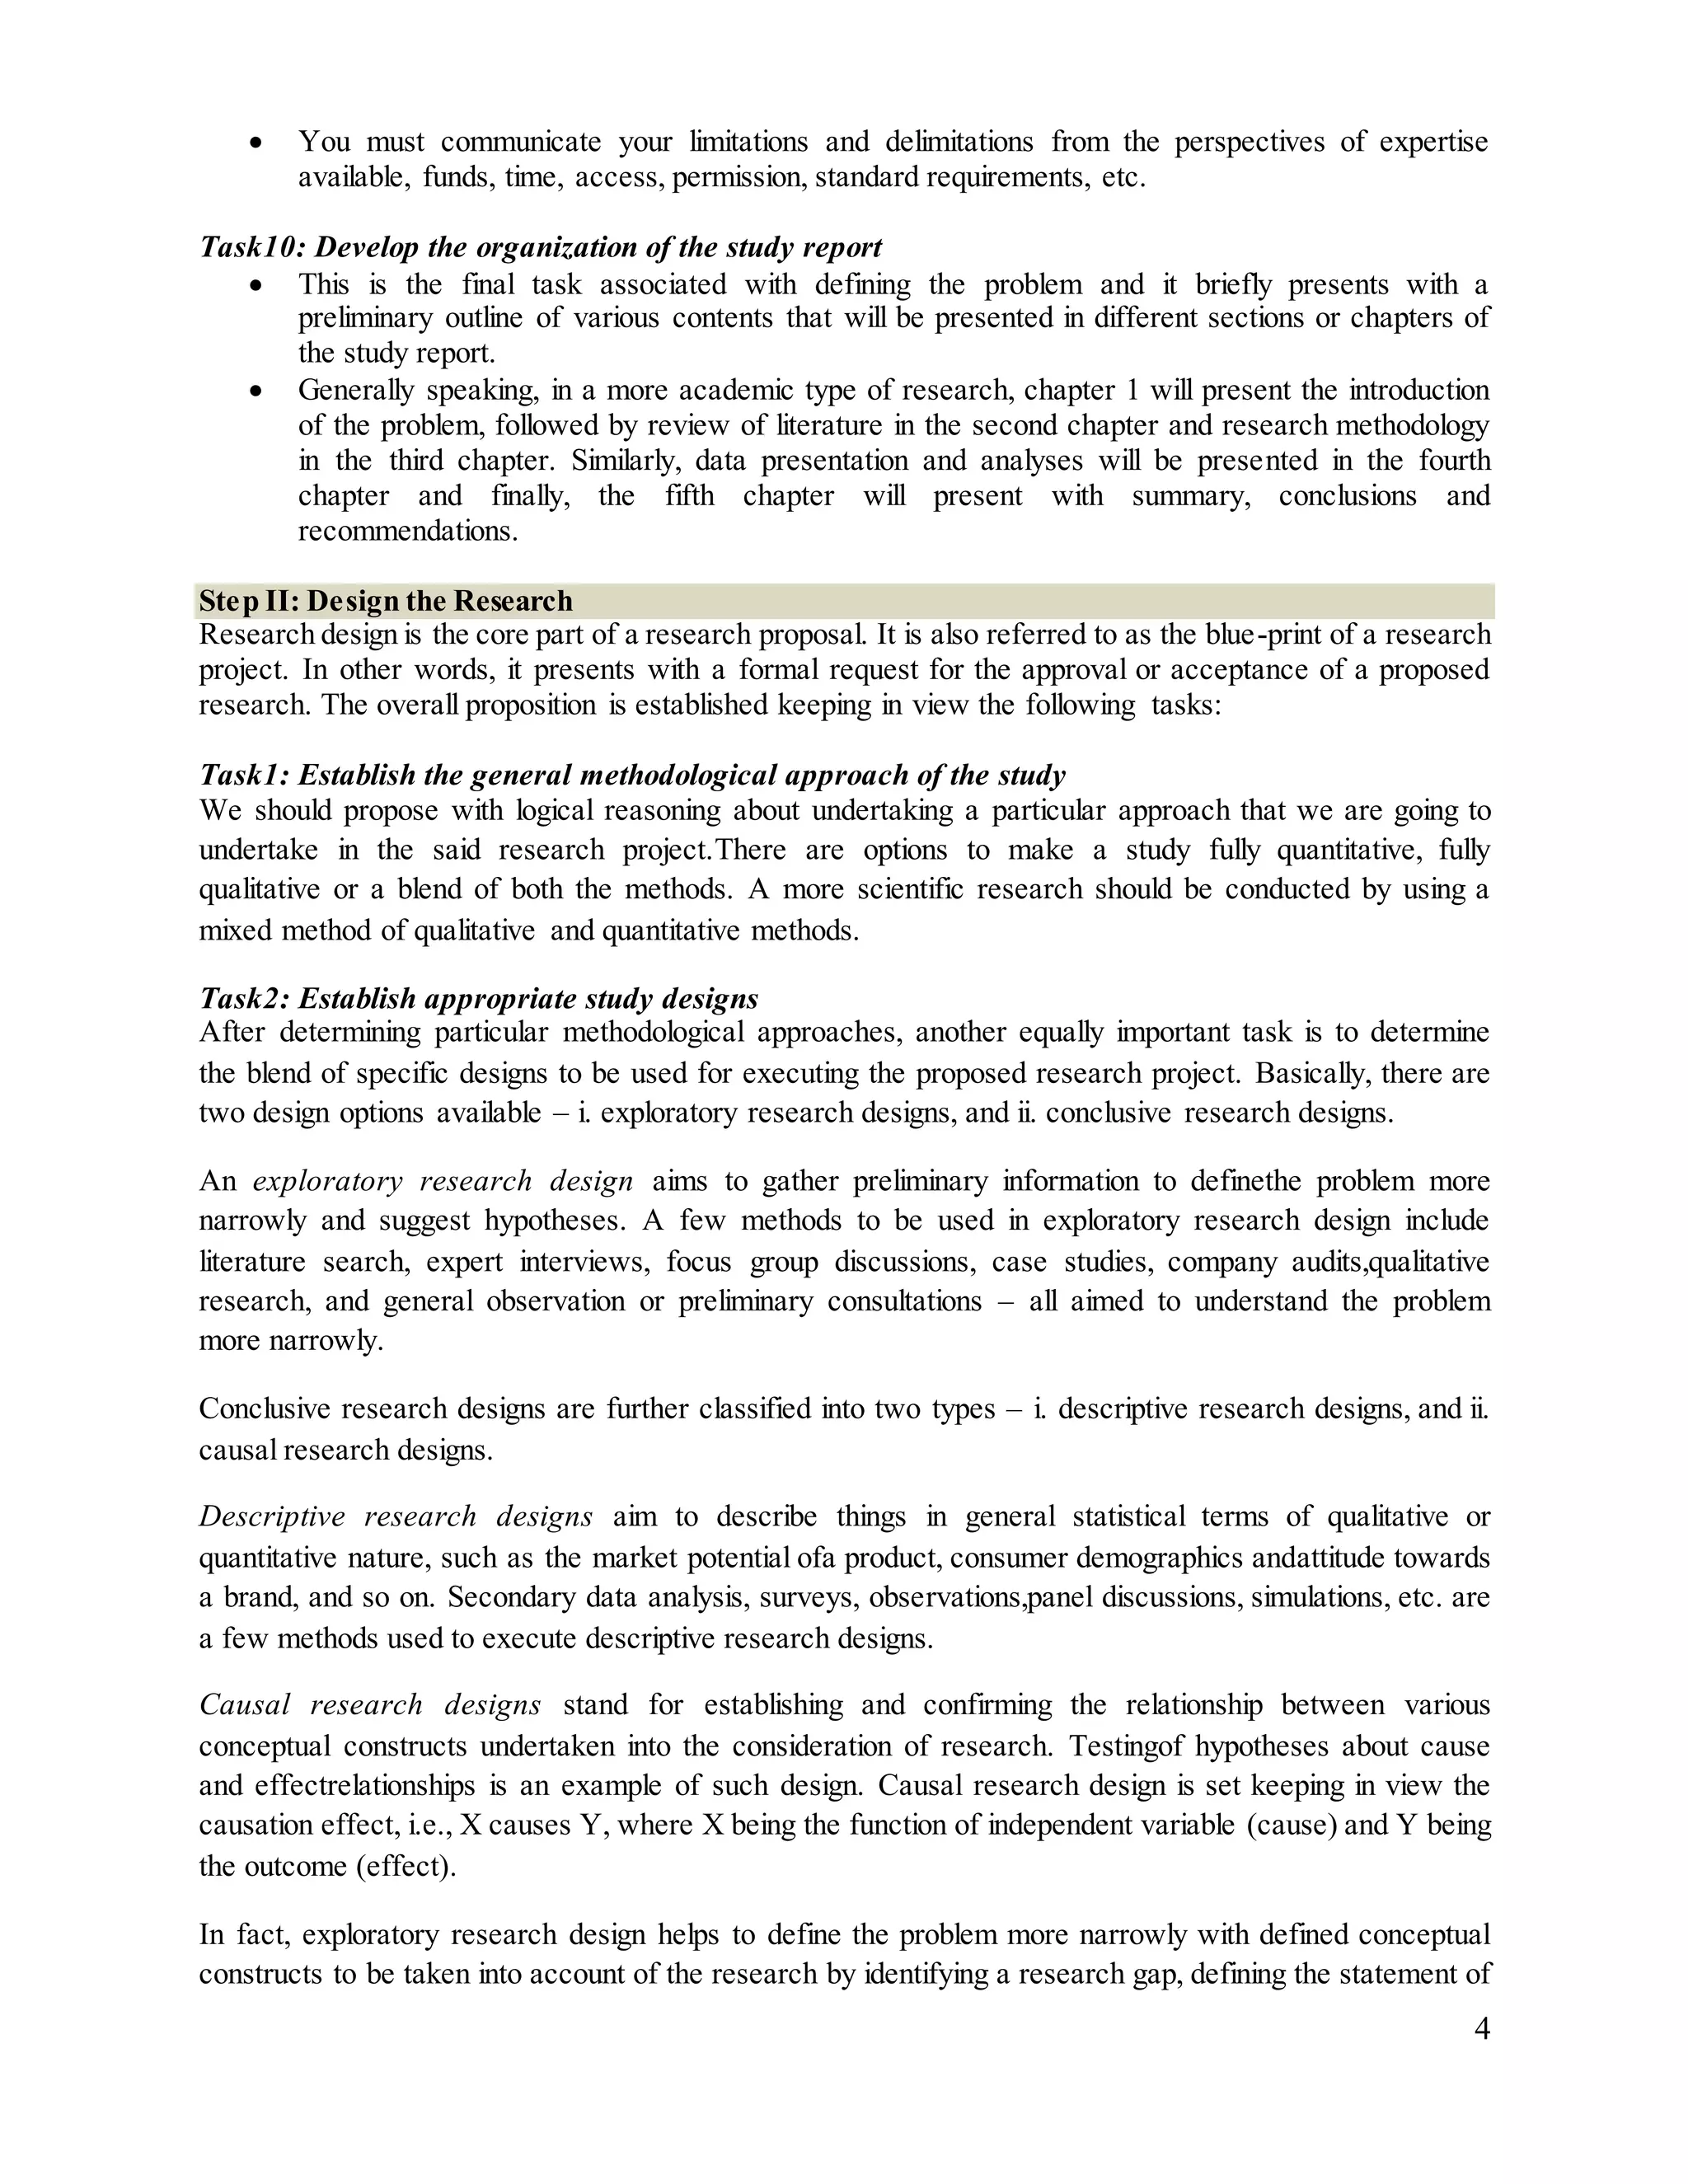
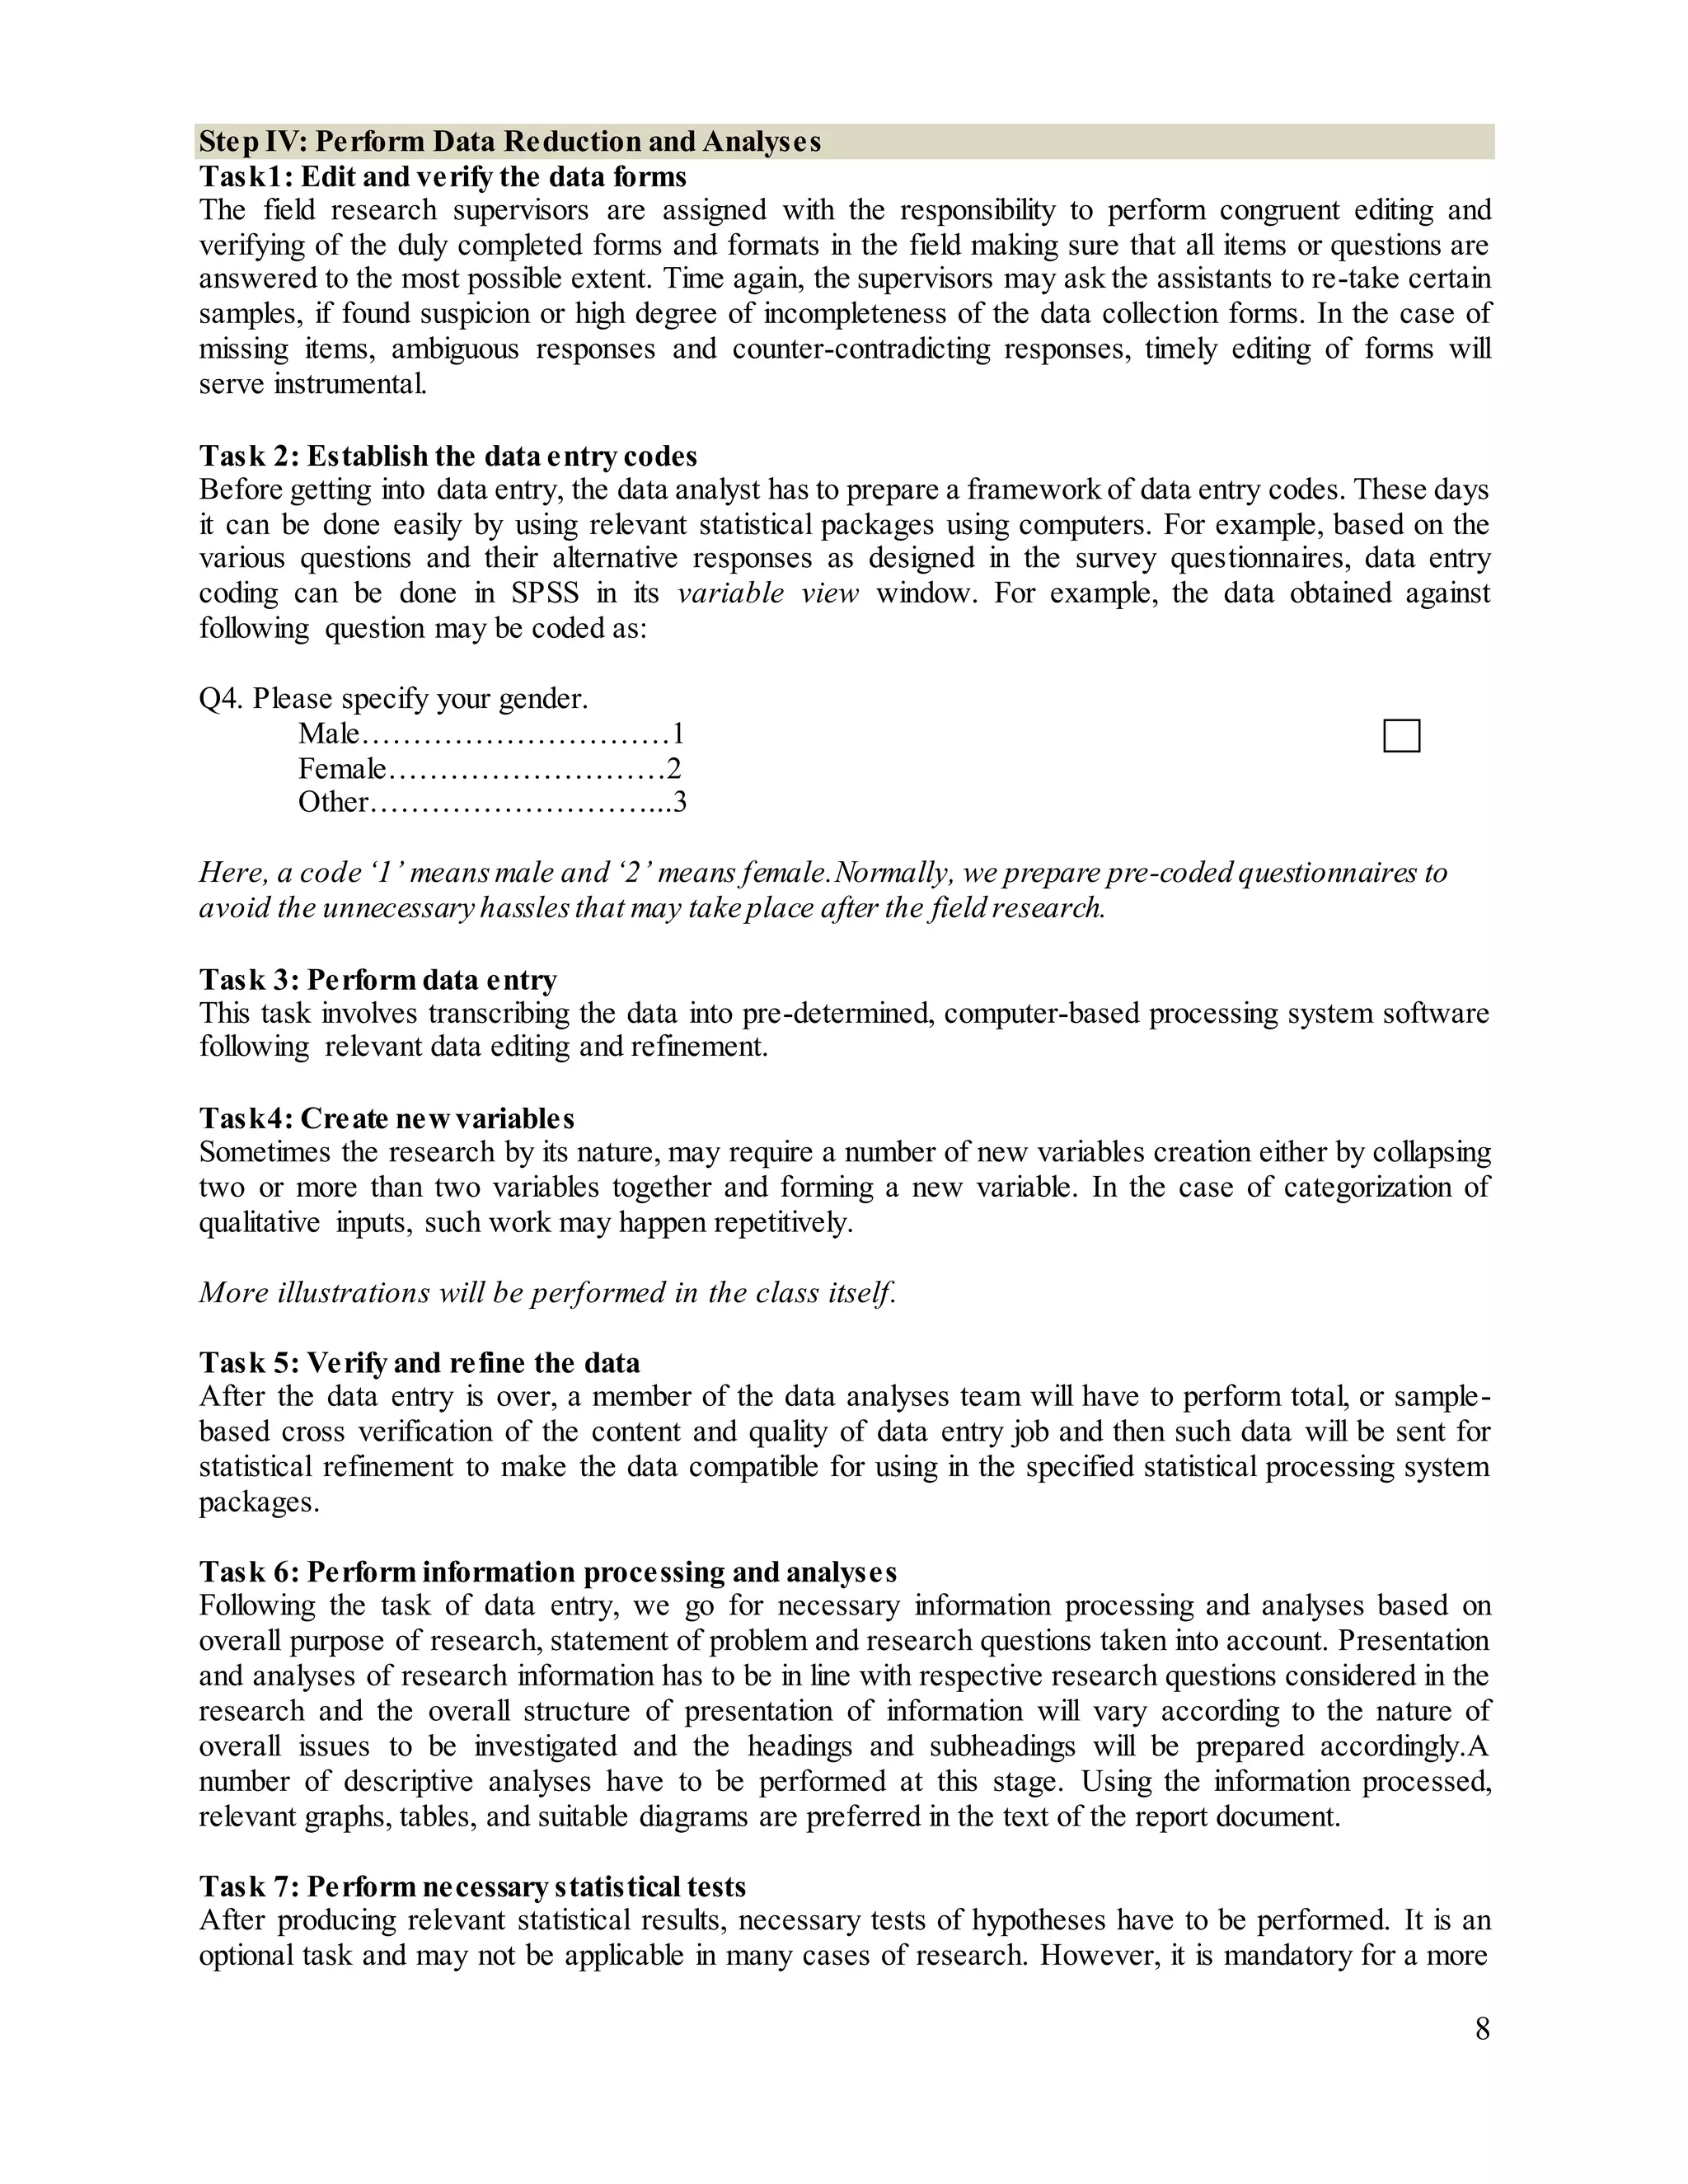
Post-research Initiatives
Many cases, the valuable efforts made for conducting high quality research and coming up with highly
effective research findings and decision alternatives go just useless as a result of failure to maintain
necessary coordination between the research team and the employer of the research project.
Unfortunately, both the parties happen to understand that submission of final study report is the last job of
the researcher. As a consequence, it lacks suffers from effective implementation. In fact, as professional
providers of research services, we should coordinate with the client organization for by reserving our
effective involvement in a number of follow-up cases so as to facilitate effectively in transforming the
research inputs into organization’s policy development, action programming, capacity building and
decision implementation process.
Important Terminologies in Research
Statistics and Parameters: A statistic is a numerical measure computed from a sample and a
parameter is a numerical measure computed from a population. Thus, these terms are also
referred to as sample statistics and population parameters.
Frequency Distribution: The frequency (f) is the number of times a variable takes on a
particular value. Note that any variable has a frequency distribution. For example, roll a pair of
dice several times and record the resulting values (constrained to being between and 2 and 12),
counting the number of times any given value occurs (the frequency of that value occurring), and
take these all together to form a frequency distribution. Frequencies can be absolute when the
frequency provided is the actual count of the occurrences, or it can be relative when they are
normalized by dividing the absolute frequency by the total number of observations [0, 1].
Relative frequencies are particularly useful if you want to compare the distributions drawn from
two different sources, i.e., while the numbers of observations of each source may be different.
Mean, Median, Mode and Range:The mean is the numerical average of the data set. Ordinarily,
the mean is computed by adding all the values in the set, then dividing the sum by the number of
values. The median is the number that is in the middle of a set of data. Arrange the numbers in
the set in order from least to greatest. Then find the number that is in the middle. What, if there
are even number of data in the set? In this case, take two central numbers, add them and divide
by 2 and there comes the median value. Say, for example, if a student’ scores in eight different
subjects are 45, 67, 74, 82, 88, 91, 92, 93, then his/her median score will be (82+88)/2 = 170/2 =
85. One important thing here is the data needs be converted into an array of ascending or
descending order before computing the median value. So, what is mode then? The mode is the
piece of data that occurs most frequently in the data set. A set of data can have i. one mode, more
than one mode, and no mode at all. The range is the difference between the lowest and highest
values in a data set. For example, in above case of marks earned by the student, the Range = 93 –
45 = 48. It reveals the numerical extent of the width of data set.
Variance and Standard Deviation: The variance is the average squared deviation from the
mean of a set of data. It is used to find the standard deviation. Process: 1. Find the mean of the
data. Hint: Mean is the average, so add up the values and divide by the number of items. 2.
Subtract the mean from each value; the result is called the deviation from the mean.3. Square
each deviation of the mean. 4. Find the sum of the squares. 5. Divide the total by the number of
items. The variance formula includes the Sigma Notation, , which represents the sum of all the
items to the right of Sigma; Here, mean is represented by and n is the number of
items. Standard Deviation shows the variation in data. If the data is close together, the standard
2
( )x
n
](https://image.slidesharecdn.com/conceptualperspectivesonresearchmethods-160221154309/75/Conceptual-perspectives-on-research-methods-10-2048.jpg)
![19
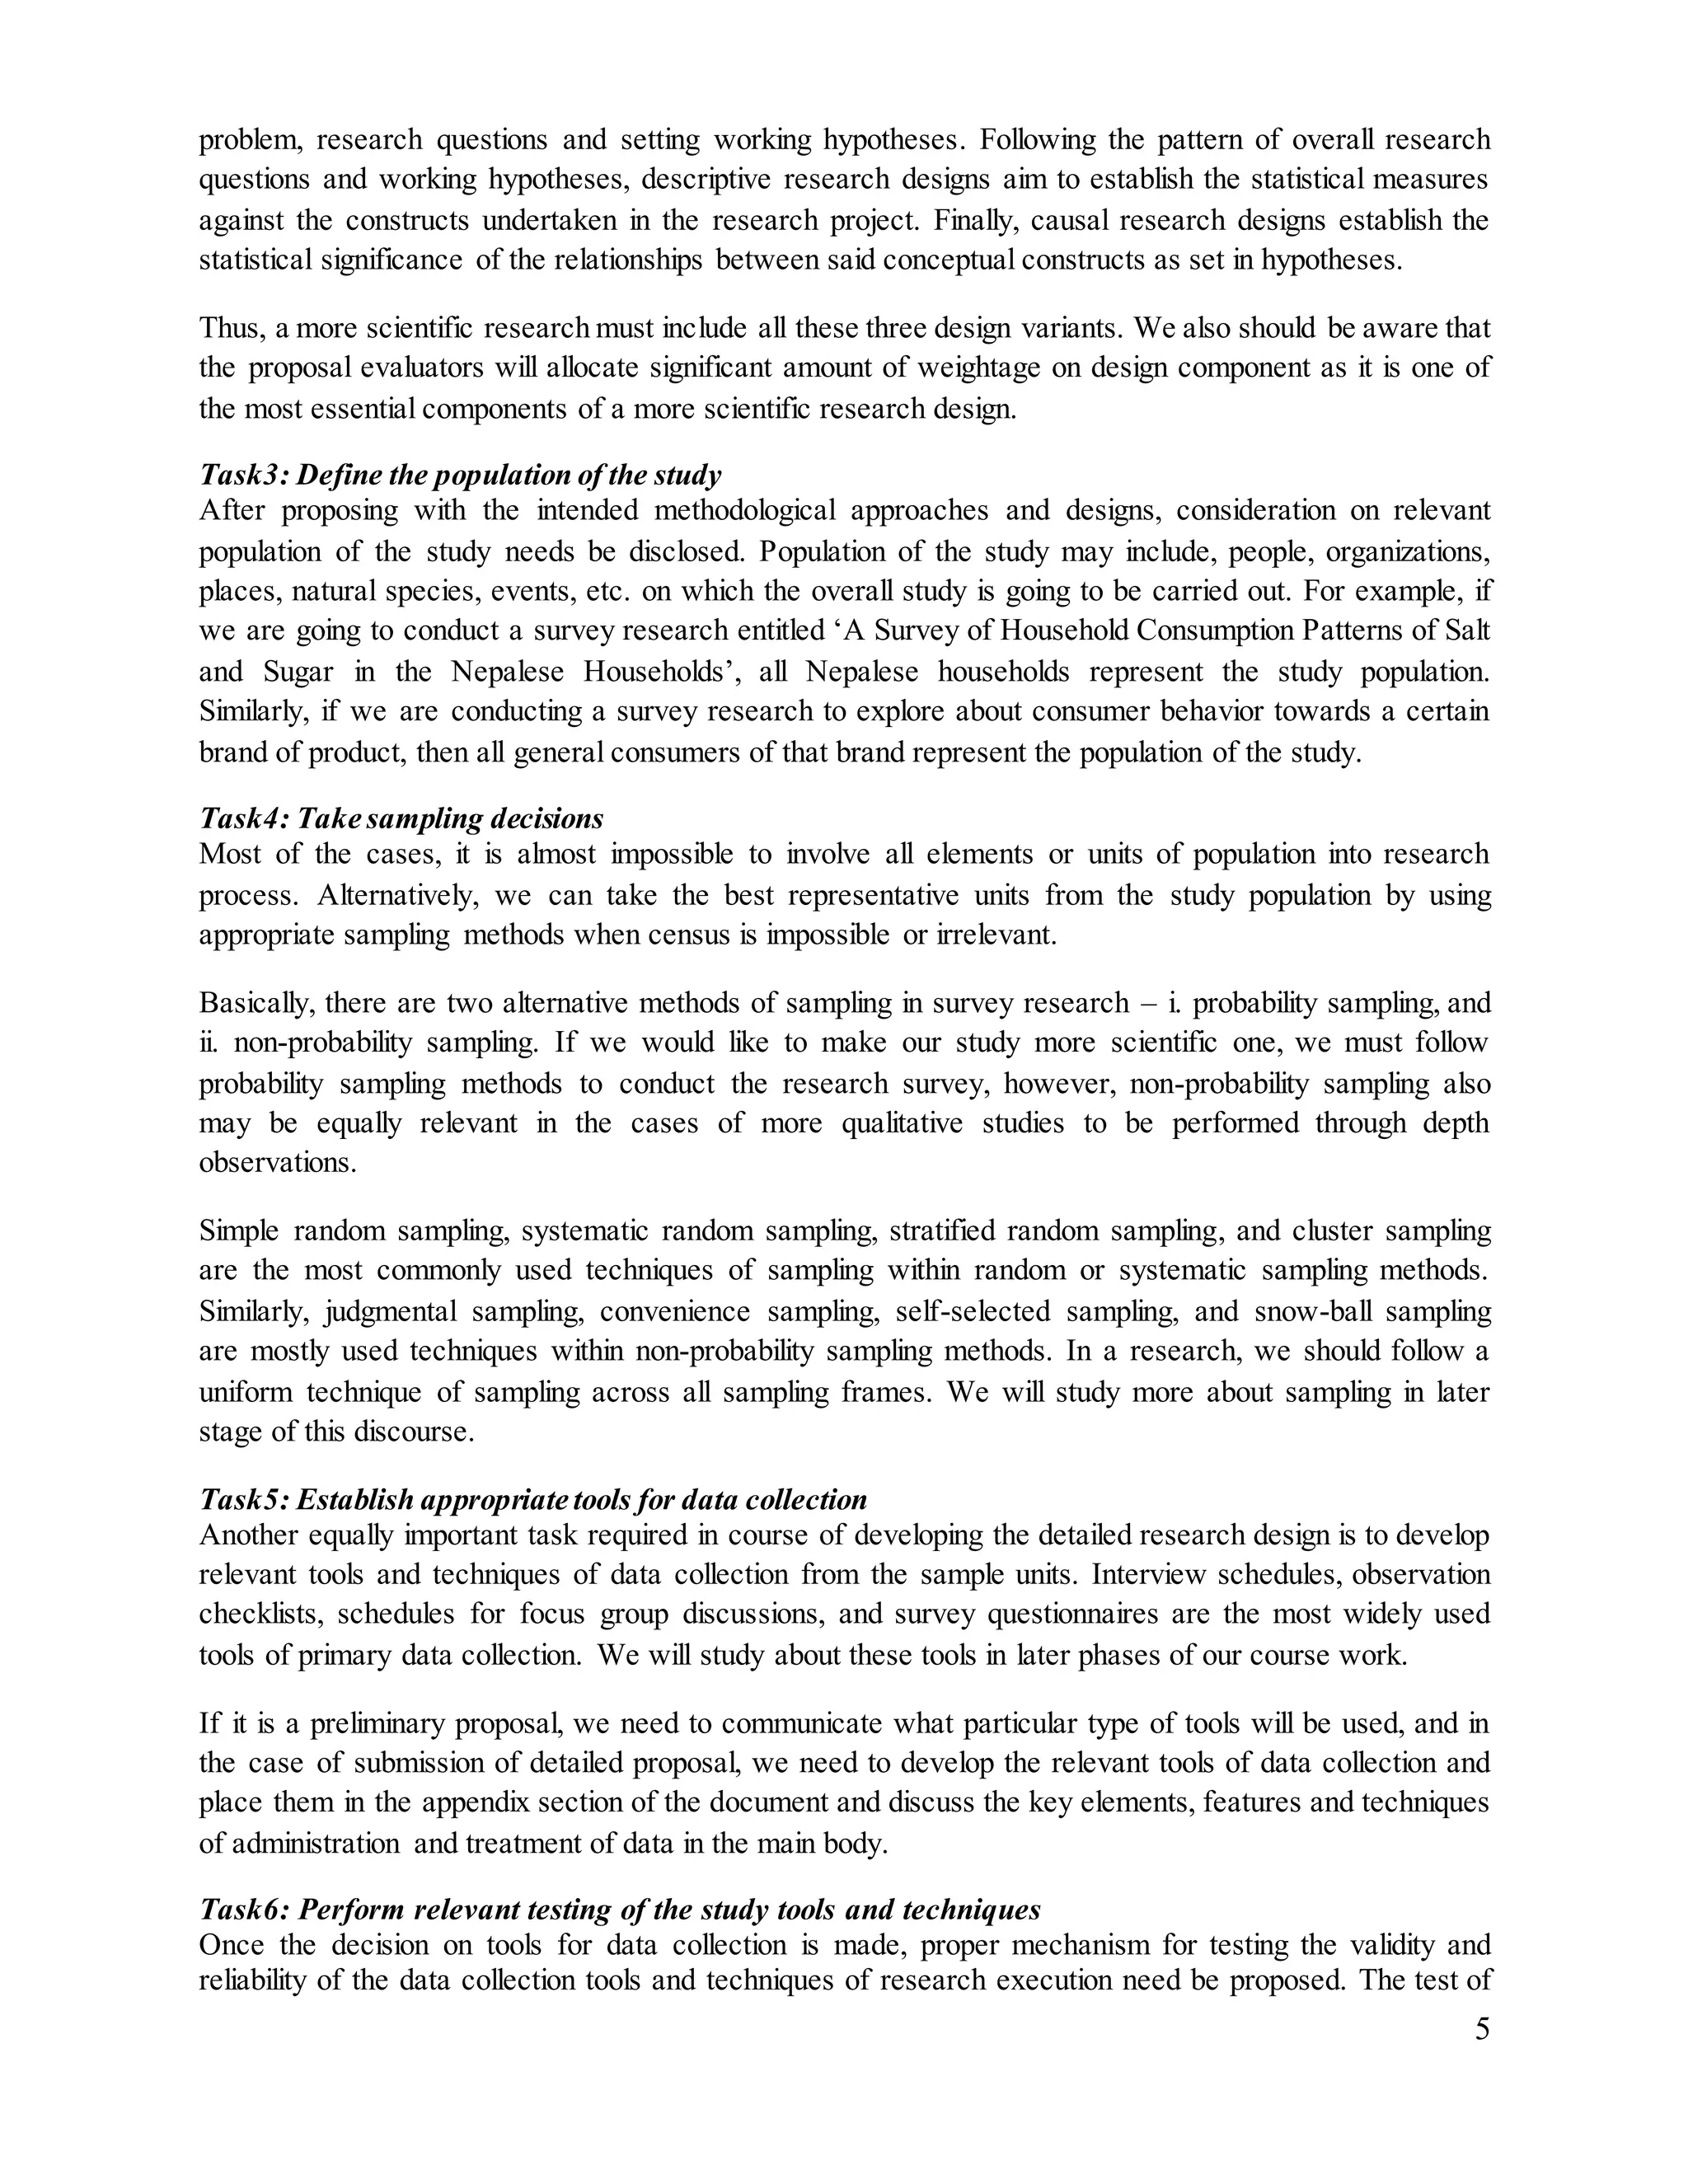
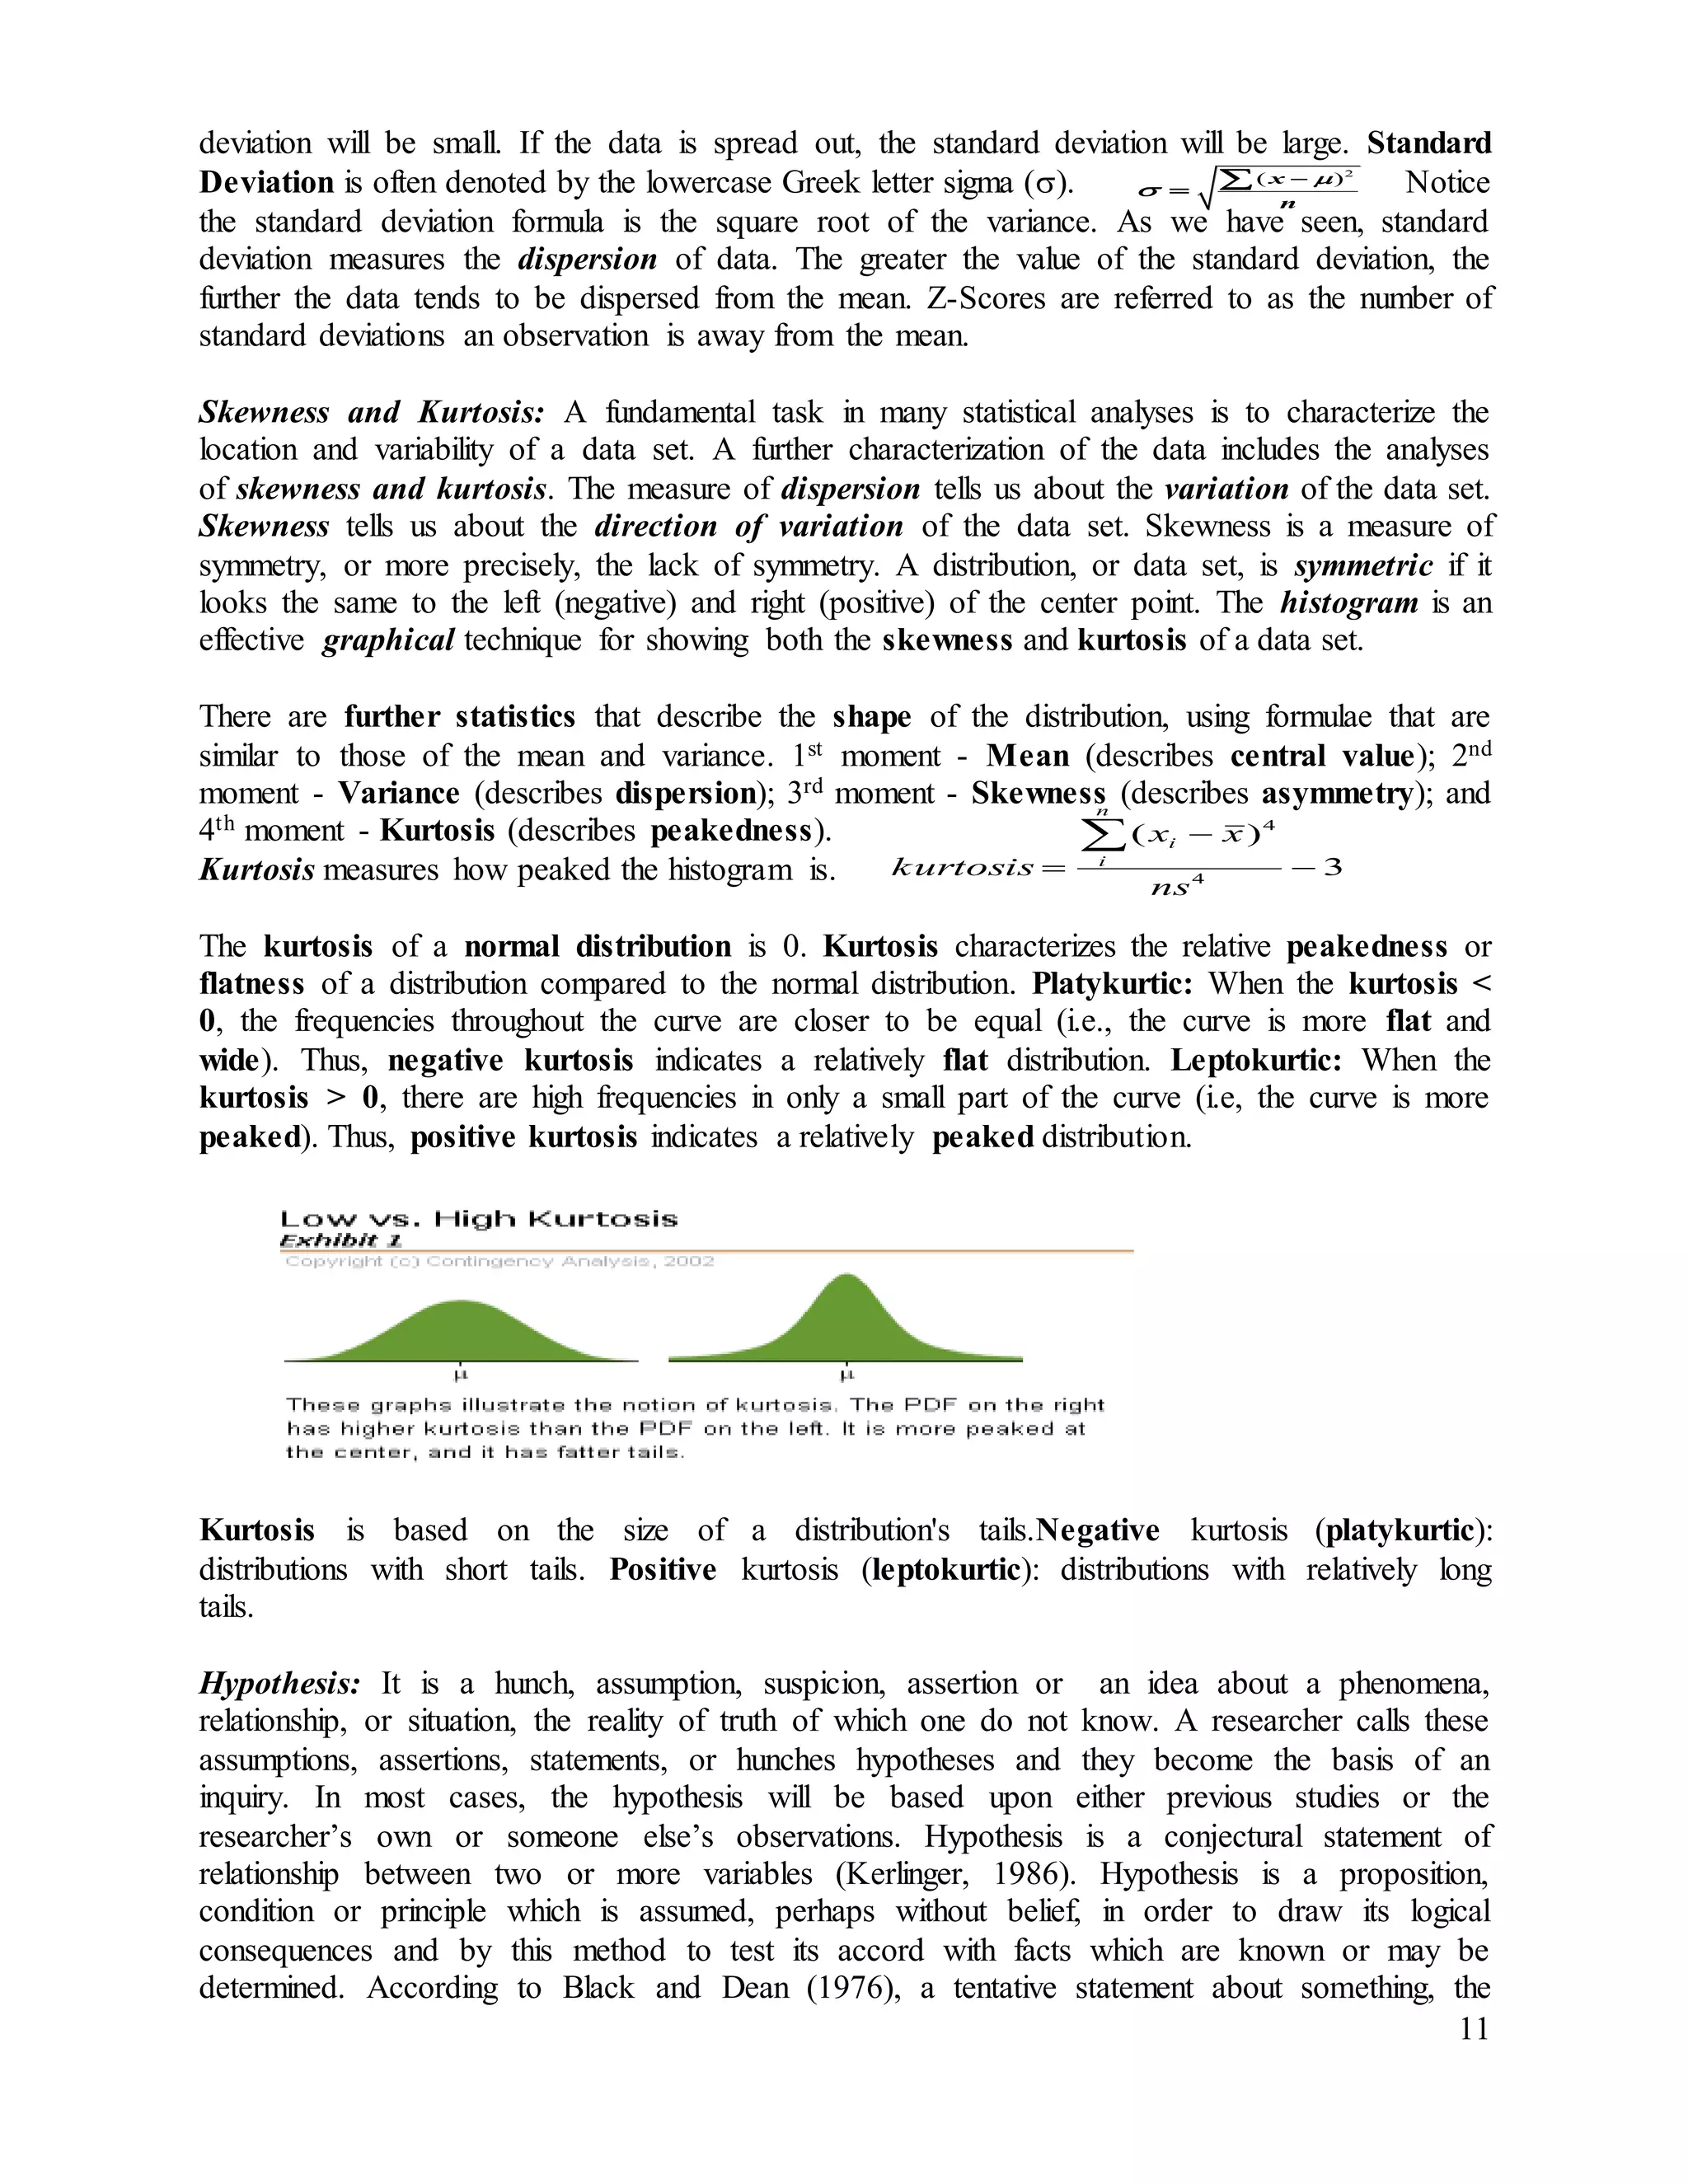
The third and last aspect of reliability is internal consistency (or homogeneity). Internal
consistency concerns the extent to which items on the test or instrument are measuring the same
thing. If, for example, you are developing a test to measure organizational commitment you
should determine the reliability of each item. If the individual items are highly correlated with
each other you can be highly confident in the reliability of the entire scale. The appeal of an
internal consistency index of reliability is that it is estimated after only one test administration
and therefore avoids the problems associated with testing over multiple time periods. Internal
consistency is estimated via the split-half reliability index, coefficient alpha (Cronbach, 1951)
index or the Kuder-Richardson formula 20 (KR-20) (Kuder, & Richardson, 1937) index. The
split-half estimate entails dividing up the test into two parts (e.g., odd/even items or first half of
the items/second half of the items), administering the two forms to the same group of individuals
and correlating the responses. Coefficient alpha and KR-20 both represent the average of all
possible split-half estimates.
The difference between the two is when they would be used to assess reliability. Specifically,
coefficient alpha is typically used during scale development with items that have several
response options (i.e., 1 = strongly disagree to 5 = strongly agree) whereas KR-20 is used to
estimate reliability for dichotomous (i.e., Yes/No; True/False) response scales.
The formula to compute KR-20 is: KR-20 = N / (N - 1)[1 - Sum(piqi)/Var(X)]
Where Sum(piqi) = sum of the product of the probability of alternative responses; and to calculate
coefficient alpha: N/(N - 1)[1 - sum Var(Yi)/Var(X)]
where N = # items
sumVar(Yi) = sum of item variances
Var(X) = composite variance (Allen & Yen, 1979)
Granted, this is the probably more than you would ever want to know about reliability but better
I provide you with too much information than too little. A couple of questions that you may have
at this point are: 1. What is considered a ‘good’ or ‘adequate’ reliability value?, and 2. How do I
improve the reliability of my survey instrument?
With respect to the first question, obviously, the higher the reliability value the more reliable the
measure. The general convention in research has been prescribed by Nunnally and Bernstein
(1994) who state that one should strive for reliability values of .70 or higher. Regarding the
second question, reliability values increase as test length increases (see Gulliksen, 1950 for a
complete discussion of the relationship between test length and reliability). The more items we
have in our scale to measure the construct of interest, the more reliable the scale will become.
However, the problem with simply increasing the number of scale items when performing
applied research is that respondents are less likely to participate and answer completely when
confronted with the prospect of replying to a lengthy questionnaire. Therefore, the best approach
is to develop a scale that completely measures the construct of interest and yet does so in as
parsimonious or economical a manner as is possible. A well-developed yet brief scale may lead
to higher levels of respondent participation and comprehensiveness of responses so that one
acquires a rich pool of data with which to answer their research question.
Validity: Validity is defined as the extent to which the instrument measures what it purports to
measure. For example, a test that is used to screen applicants for a job is valid if its scores are
directly related to future job performance. There are many different types of validity, including:
content validity, face validity, criterion-related validity (or predictive validity), construct validity,](https://image.slidesharecdn.com/conceptualperspectivesonresearchmethods-160221154309/75/Conceptual-perspectives-on-research-methods-19-2048.jpg)
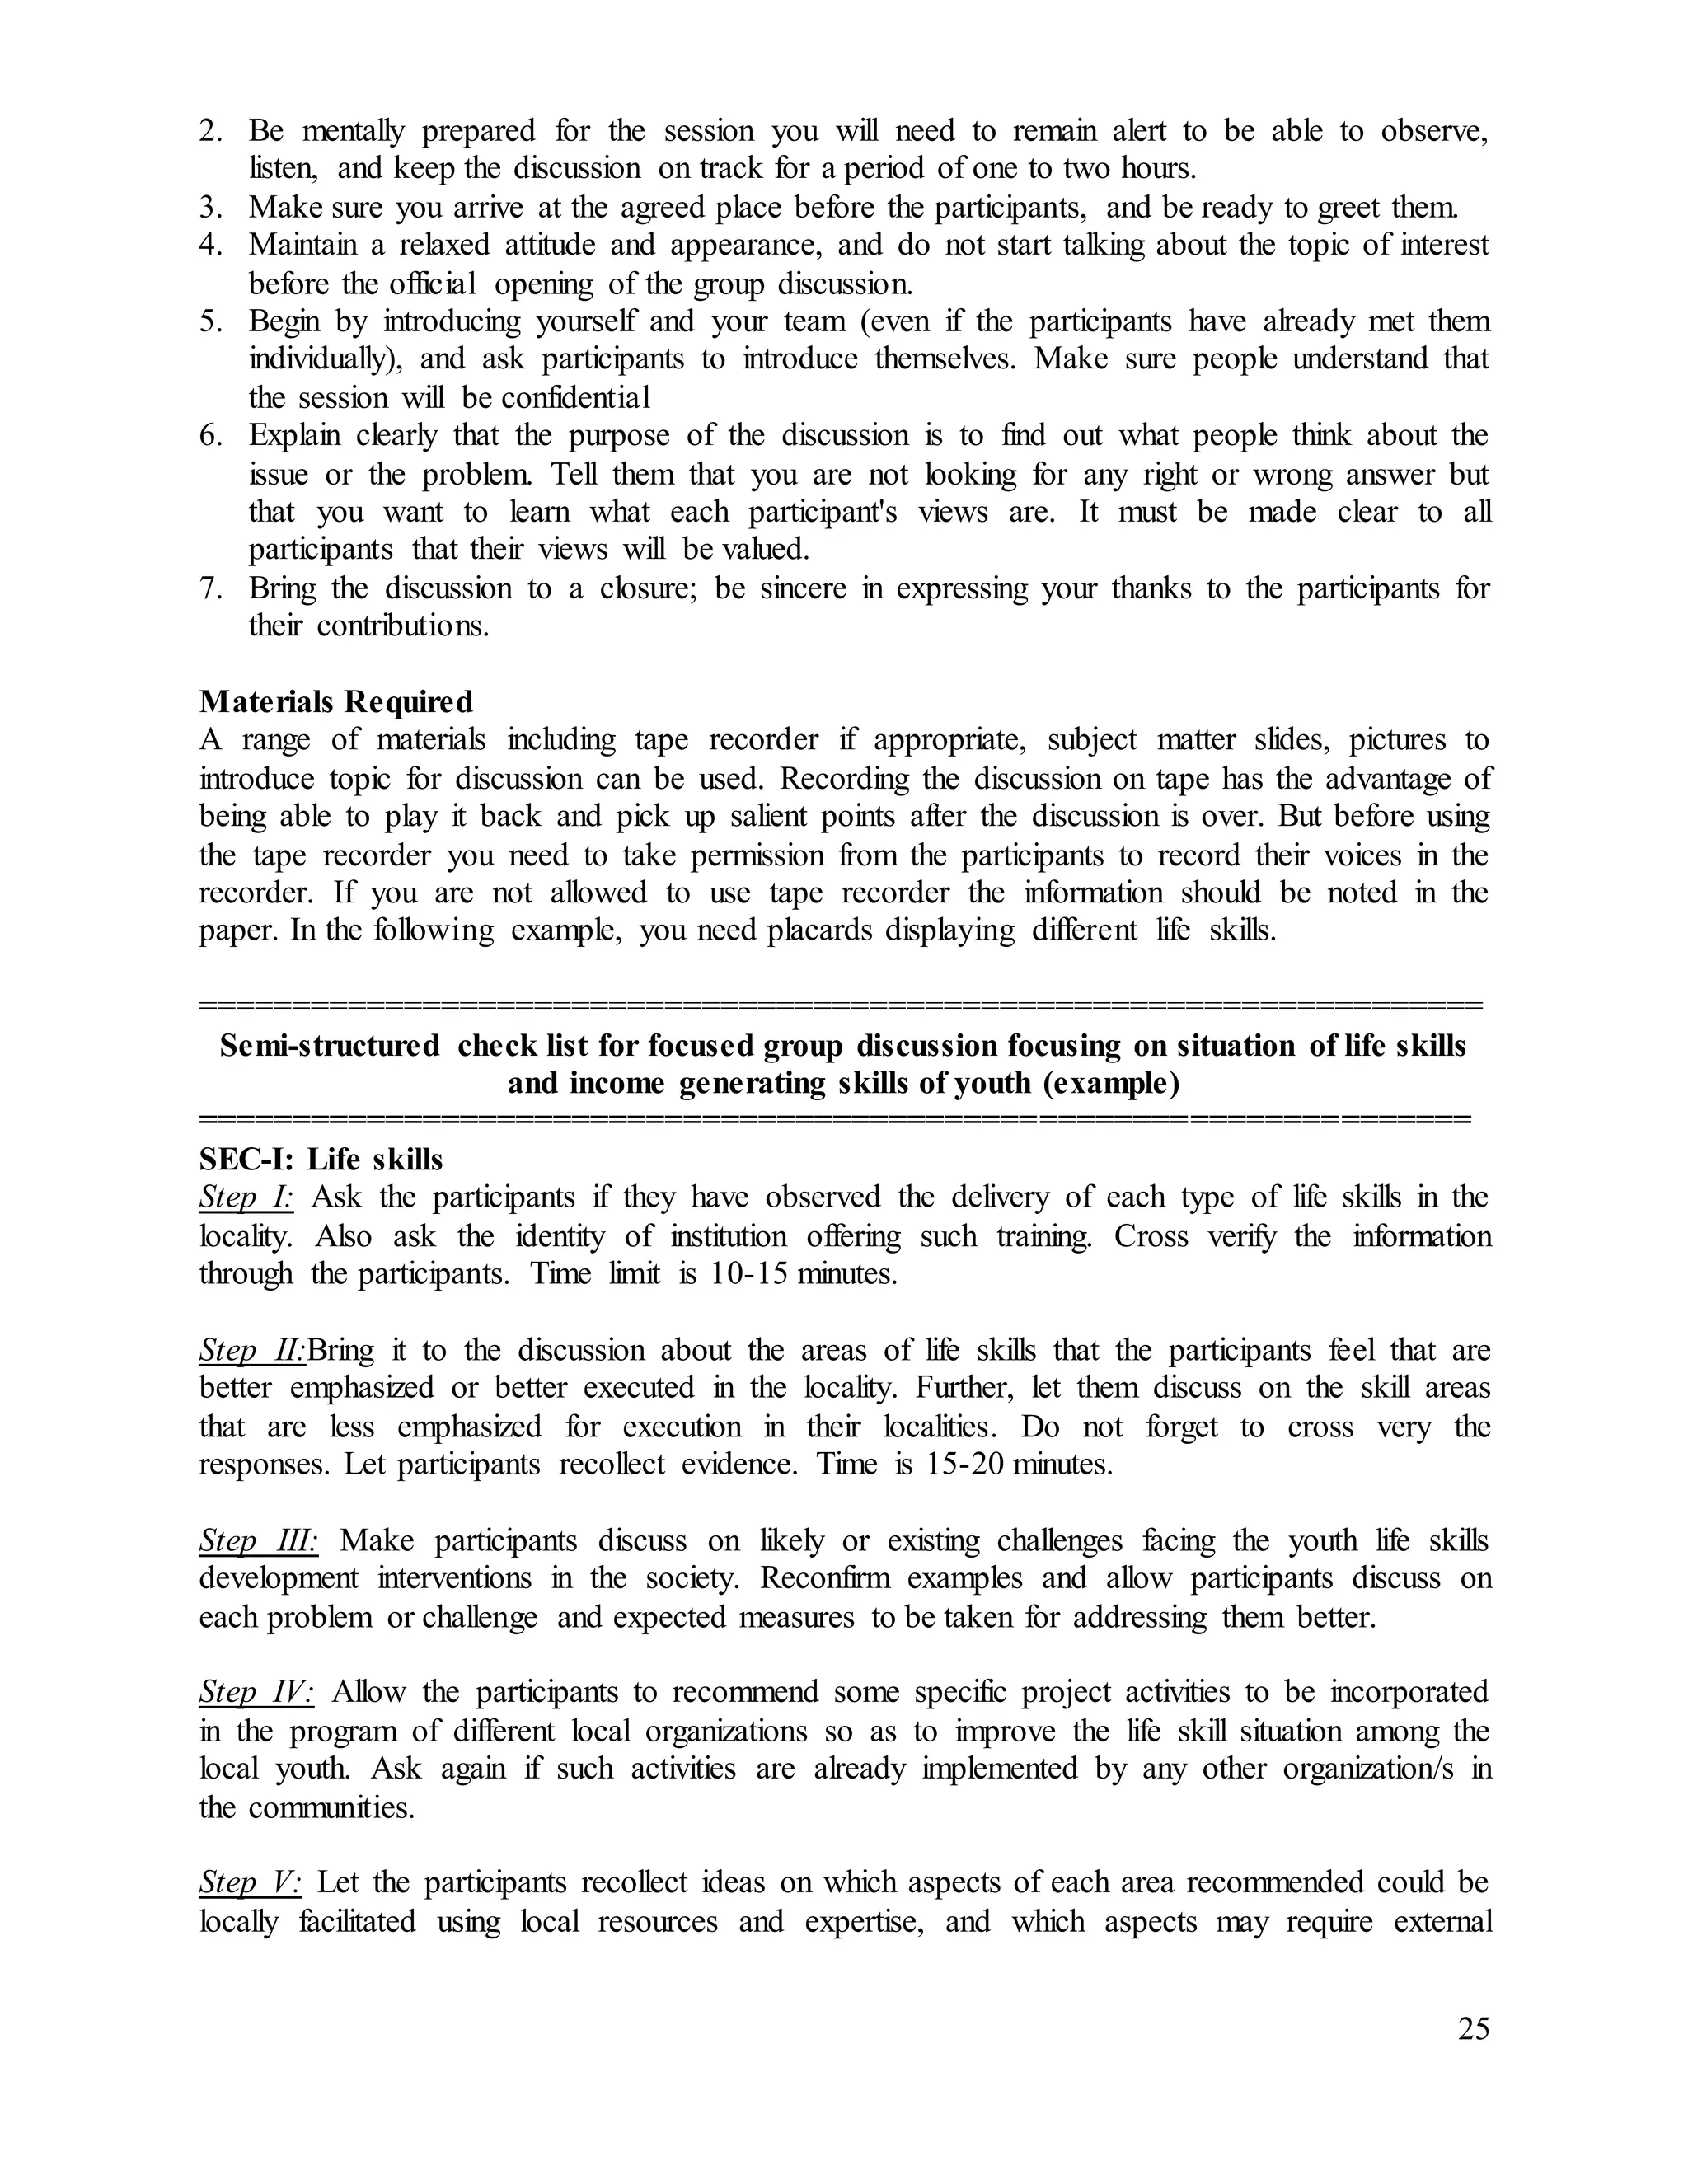
![26
support. Also try to explore the nature of institutional support sought by the community
members.
SEC-II: Income generating skills
Step I: Ask the participants if they have observed the delivery of each type of income generating
skills in the locality. Also ask the identity of institution offering such training. Cross verify the
information through the participants. Time limit is 15-20 minutes.
Step II: Bring it to the discussion about the areas of income generating skills that the participants
felt to be better executed in the locality; also extend the discussion towards the areas that are less
executed. Do not forget to cross-verify the responses. Let the participants recollect evidences.
Time is 10-15 minutes.
Step III: Make the participants discuss on likely or existing challenges facing the youth income
generating skills development interventions in the society.Recollect examples and then allow
them discuss on each problem or challenge. Subsequently, let them explore some corrective
measures to be taken.
Step IV: Allow the participants to recommend some specific project activities to be incorporated
in the programs of different local organizations so as to improve the income generating skill
situation among the local youth. Ask again if such activities are already implemented by any
organization/s in the communities.
Step V: Let the participants recollect ideas on which aspects of each area recommended could be
locally facilitated using local resources and expertise, and which aspects may require external
support; also try to seek the expected institutional support for better delivery of such services.
Closing the discussion
Finally, reconfirm what they have shared; get their agreement on inputs produced; communicate
them how such inputs will be used in the days to come; and thank them for active participation
and giving their productive time in this respect; and Namaste and Goodbye!
Contents to be used in reporting focused group discussion
[Purpose of this report; how the focus group discussions were conducted; information about
number of people participated in the focus group discussions and number of focus groups
conducted; key themes of discussion and their narratives; costs and timescales; focus group
discussion results; conclusions]](https://image.slidesharecdn.com/conceptualperspectivesonresearchmethods-160221154309/75/Conceptual-perspectives-on-research-methods-26-2048.jpg)

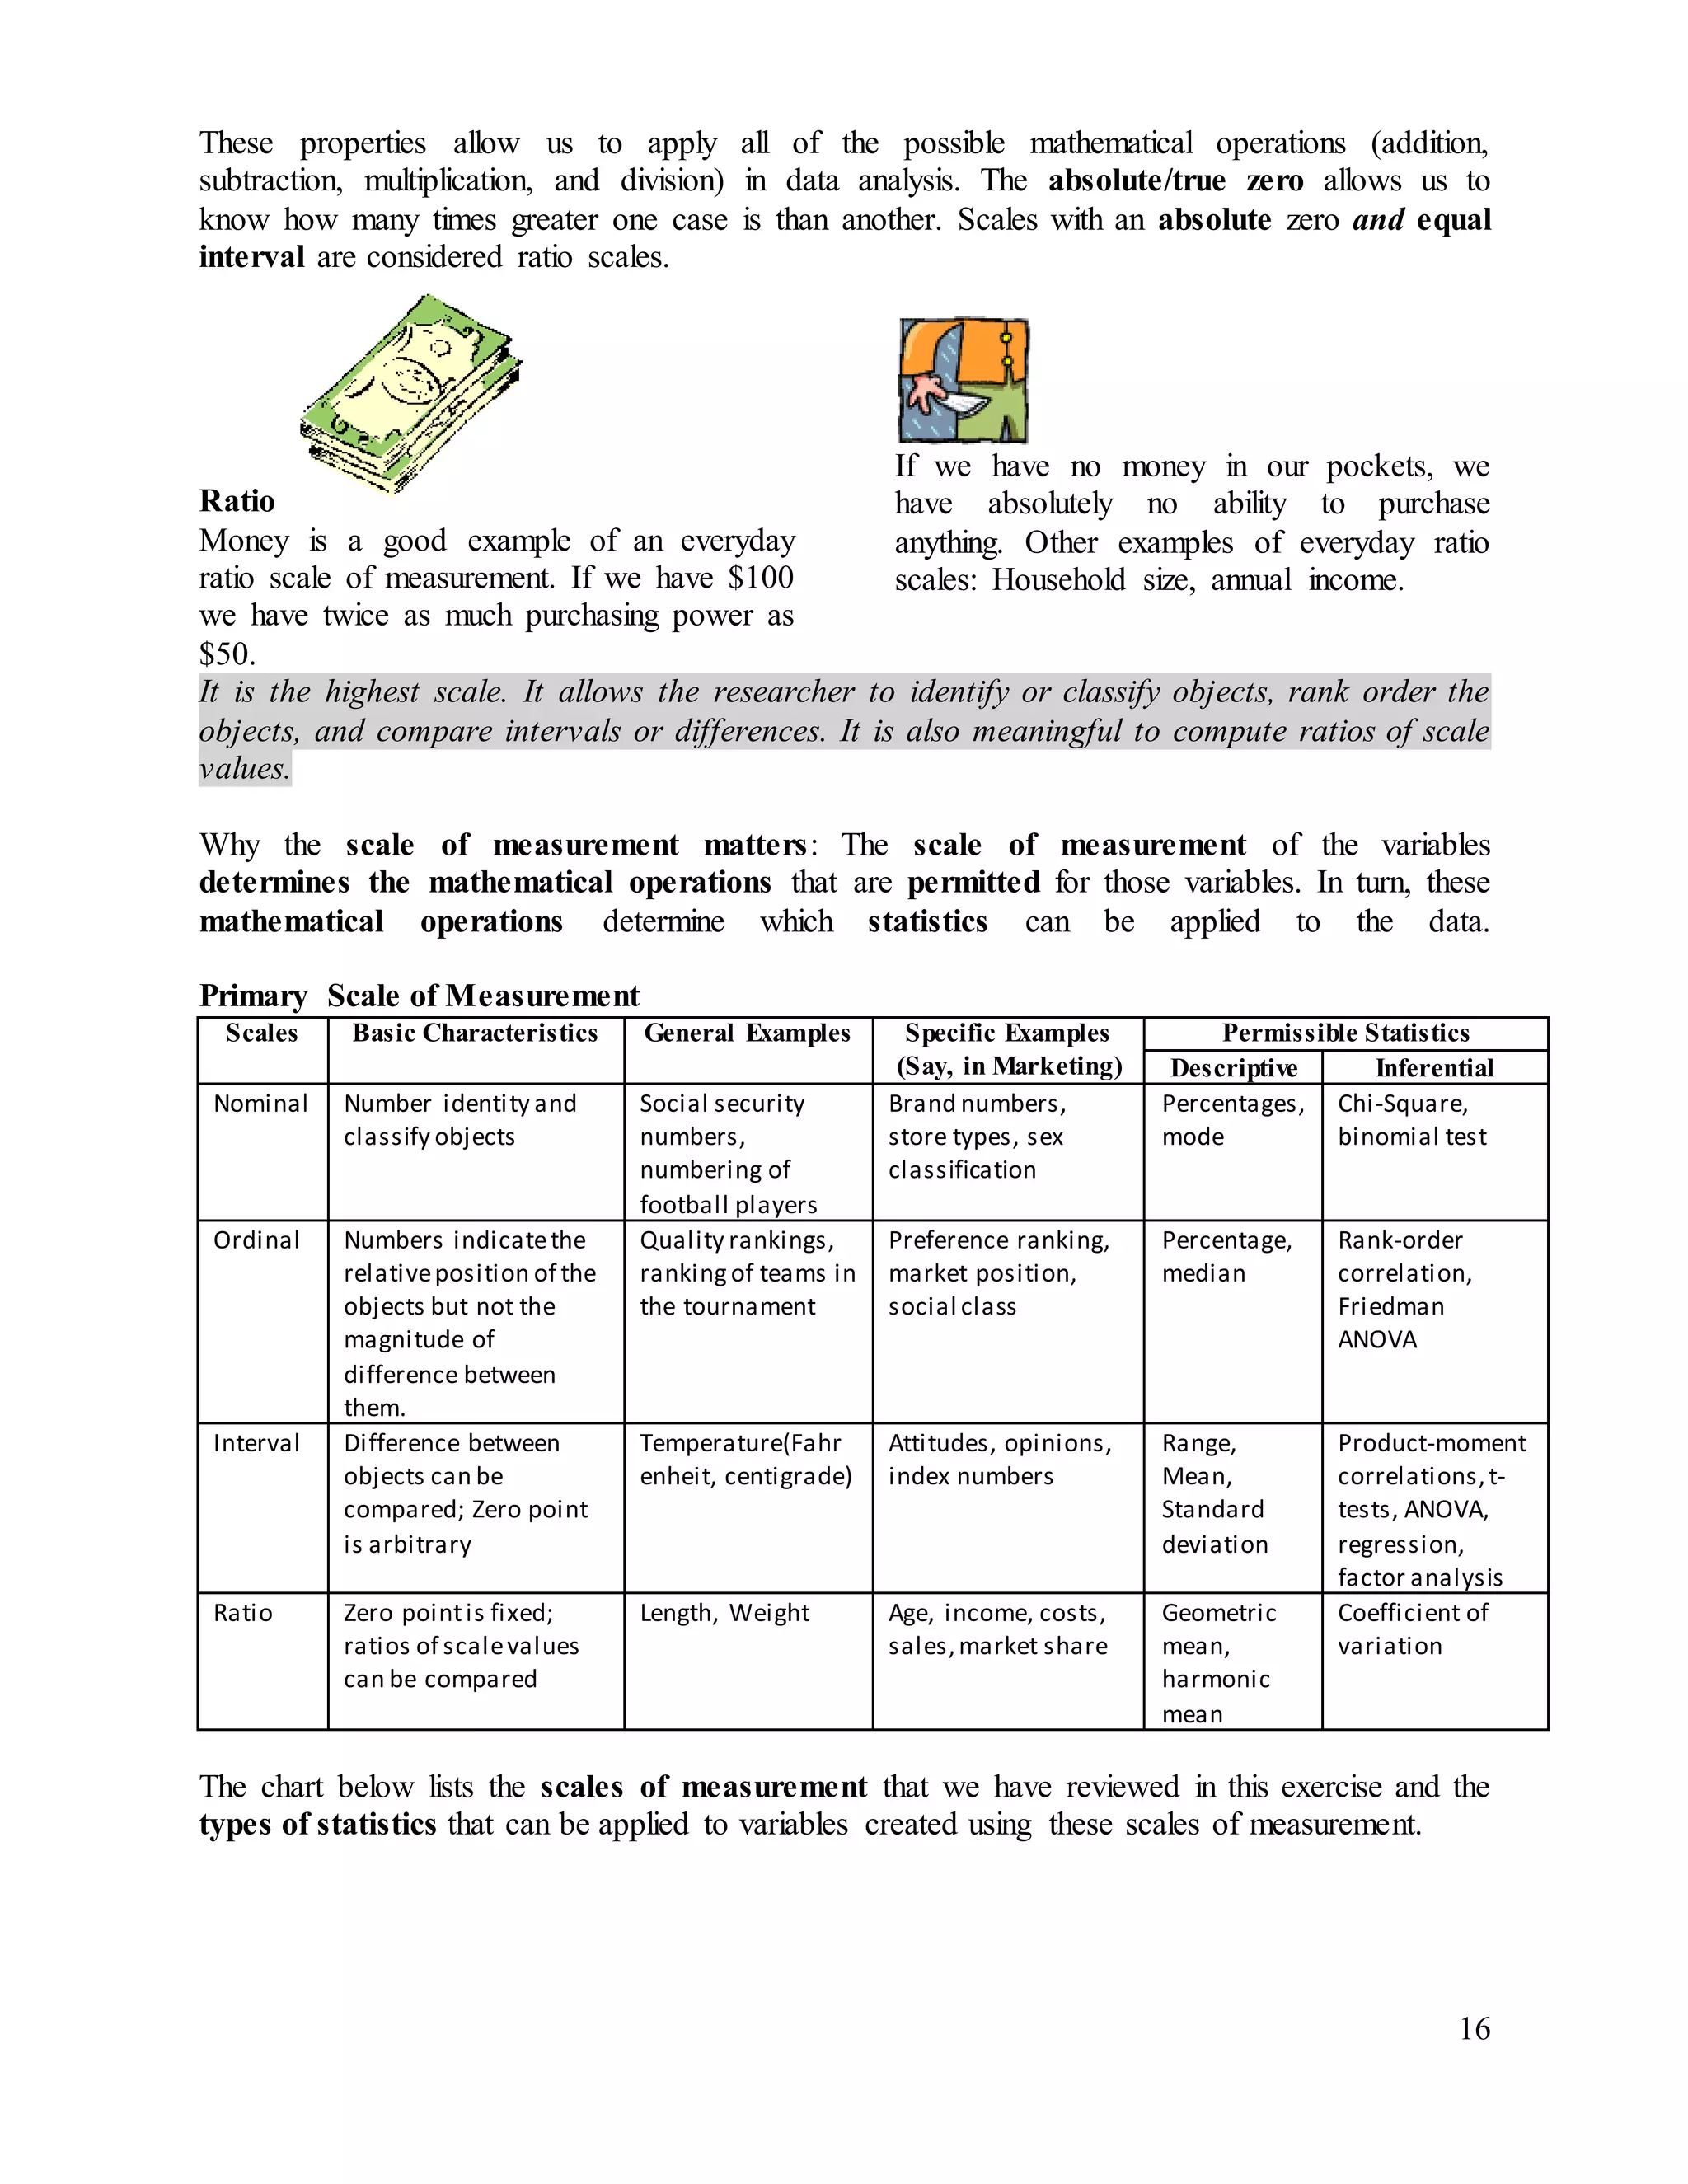
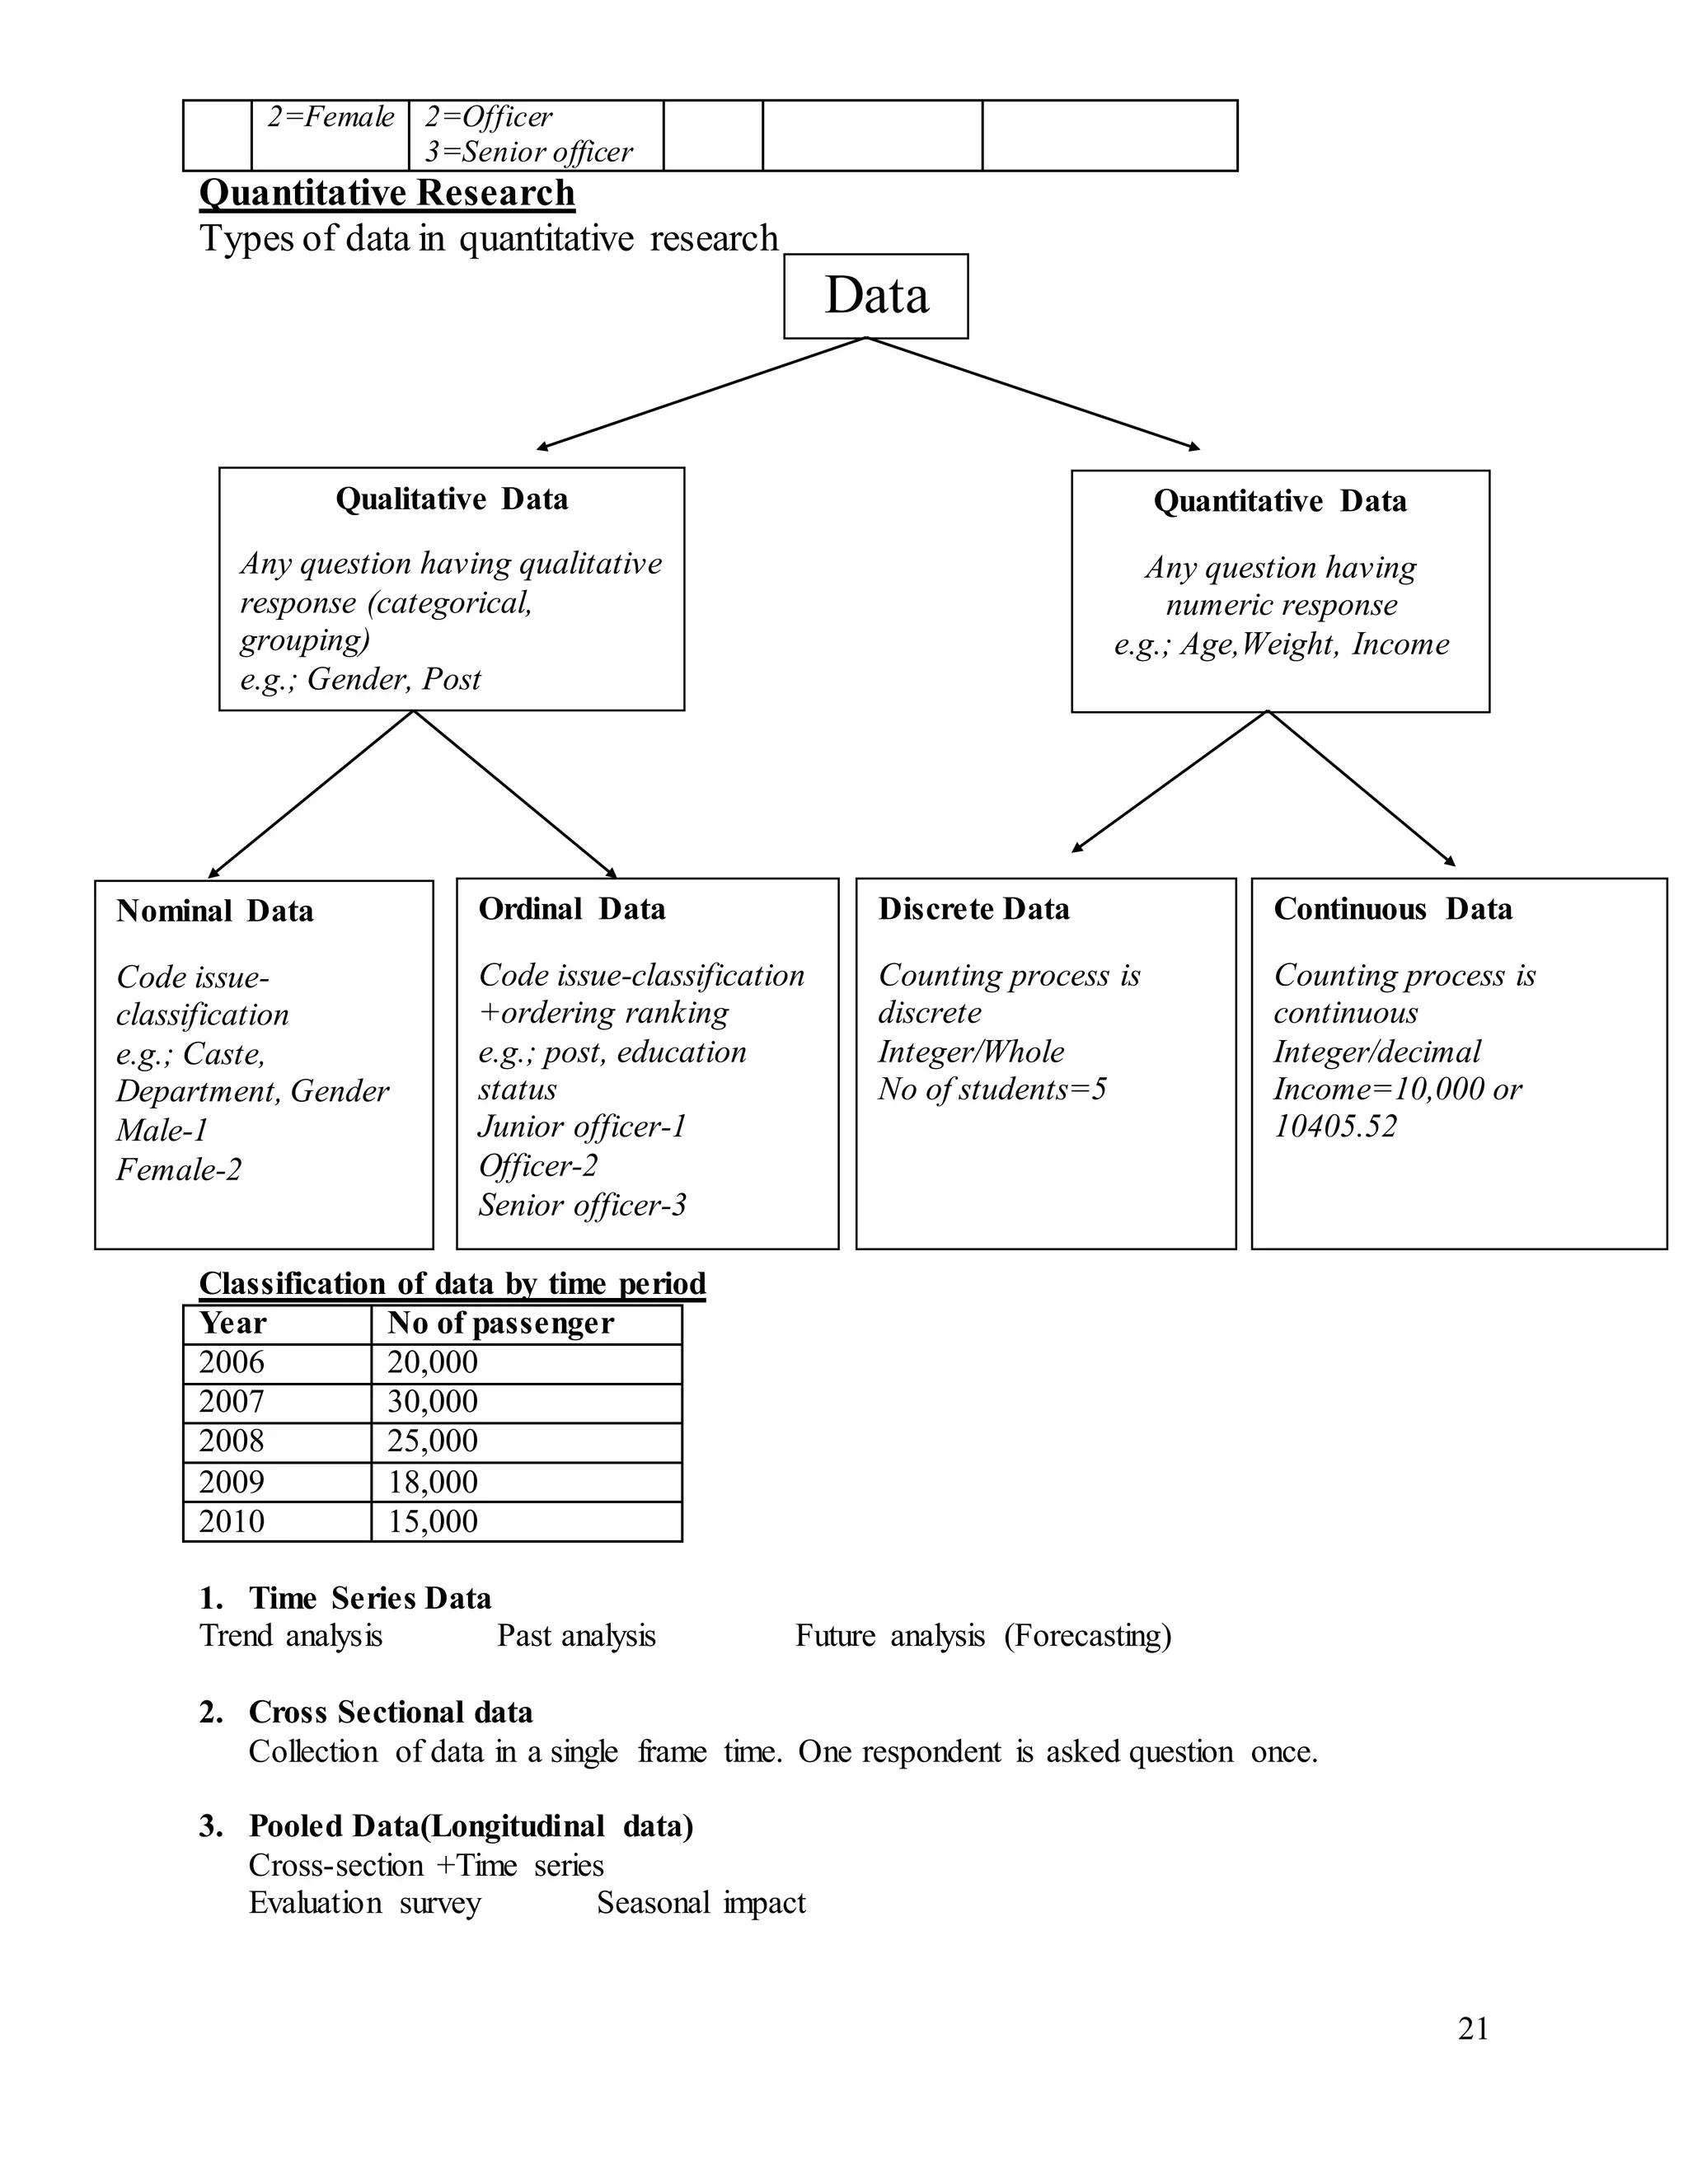
This document outlines the fundamental aspects of research methodology, emphasizing the systematic nature of research as a tool for investigating and addressing problems, particularly in business contexts. It details the process of defining research problems, designing methodologies, and the importance of systematic inquiry in generating data that informs managerial decisions. Furthermore, it provides a step-by-step guide, including tasks for formulating research objectives, questions, and hypotheses, along with data collection and analysis techniques.


